Oklahoma Investment Properties for Sale
Browse homes for sale and investment properties in Oklahoma. Refine your search by price, property type, or more.
Best cash flowing properties in Oklahoma
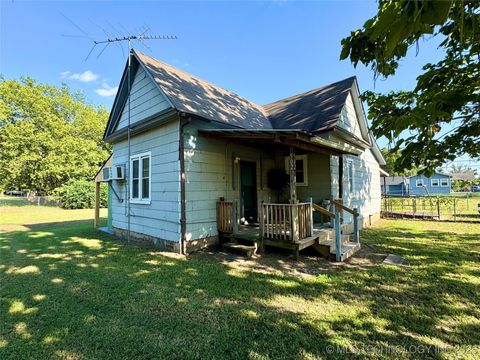
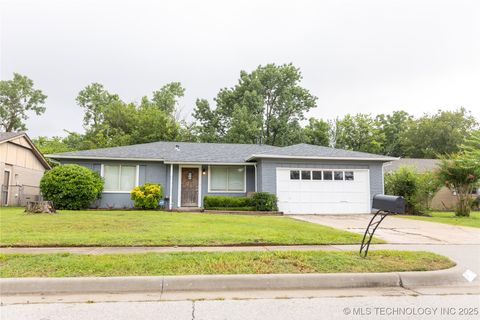
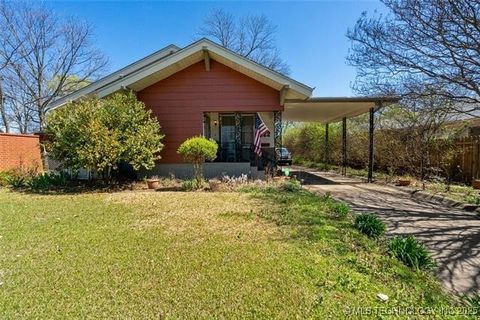
Active
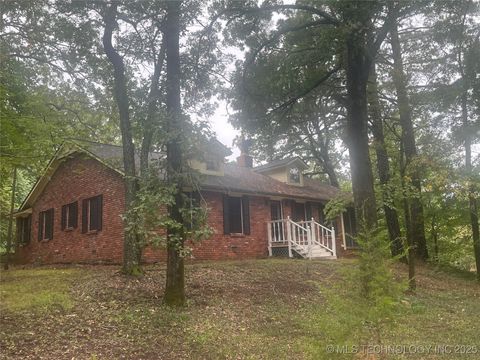
$67,900
1
bds
|
1
ba
|
908
sqft
|
built
1920
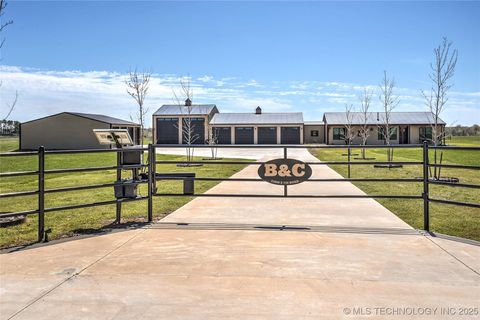
502 E 4th St, Stroud, OK 74079
$811
Cash flow
13.9%
Cash-on-Cash Return
14.3%
Cap rate
1.8%
Rent to Value Ratio

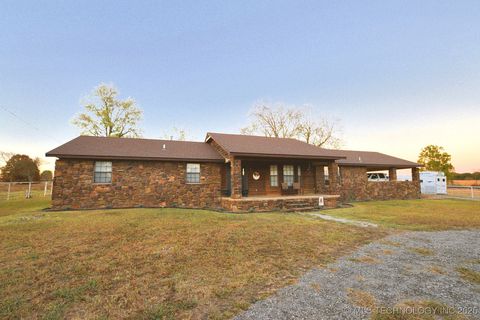
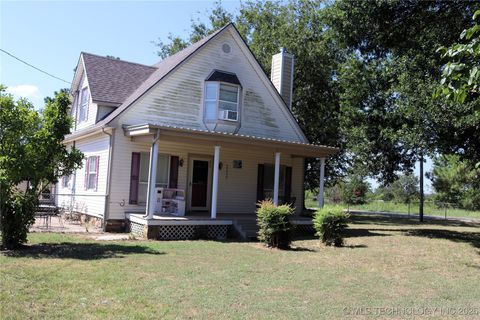
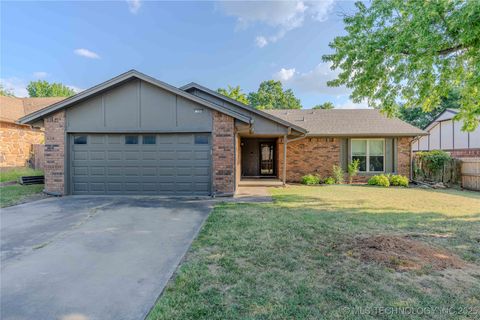
Active
$139,900
3
bds
|
2
ba
|
1,710
sqft
|
built
1910
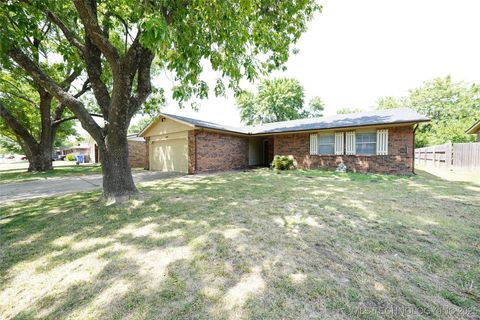
406 Denver St, Pawnee, OK 74058
$258
Cash flow
9.6%
Cash-on-Cash Return
7.9%
Cap rate
1.0%
Rent to Value Ratio
2,018 out of 3,769 properties for sale in Oklahoma
Limited Results Shown
Create a free account, or log in to reveal all property listings and enjoy the complete experience.

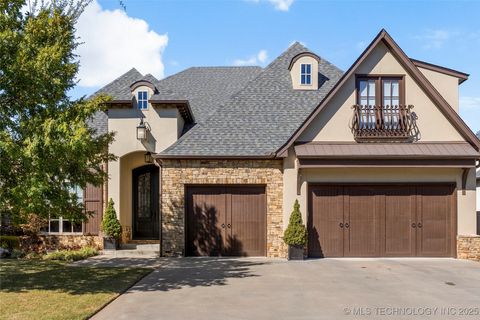
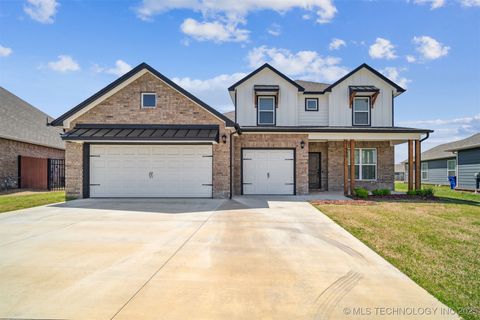
Active
$269,999
2
bds
|
2
ba
|
1,025
sqft
|
built
1968
7373 N 485 Rd, Hulbert, OK 74441
$4
Cash flow
0.1%
Cash-on-Cash Return
5.7%
Cap rate
1.0%
Rent to Value Ratio

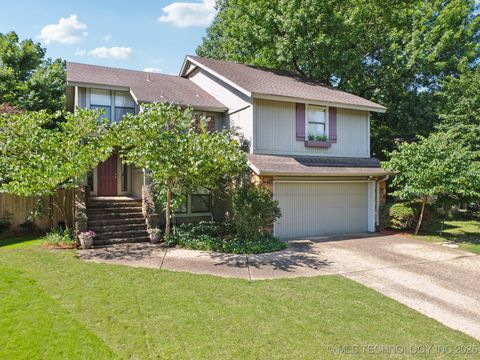
Active
$260,000
3
bds
|
2
ba
|
1,520
sqft
|
built
2005
13155 E 132nd St N, Collinsville, OK 74021
$-357
Cash flow
-7.2%
Cash-on-Cash Return
4.0%
Cap rate
0.6%
Rent to Value Ratio

Active
$619,000
3
bds
|
3
ba
|
2,615
sqft
|
built
1936
1208 E 29th St, Tulsa, OK 74114
$-1,681
Cash flow
-14.2%
Cash-on-Cash Return
2.4%
Cap rate
0.4%
Rent to Value Ratio

Active
$1,200,000
5
bds
|
4
ba
|
5,270
sqft
|
built
1935
1225 E 18th St, Tulsa, OK 74120
$-3,264
Cash flow
-14.2%
Cash-on-Cash Return
2.4%
Cap rate
0.4%
Rent to Value Ratio

Active
$1,475,000
4
bds
|
6
ba
|
5,012
sqft
|
built
2001
3661 S Lewis Ave, Tulsa, OK 74105
$-5,126
Cash flow
-18.1%
Cash-on-Cash Return
1.5%
Cap rate
0.3%
Rent to Value Ratio

Active
$999,500
4
bds
|
5
ba
|
5,340
sqft
|
built
2004
8403 S Allegheny Ave, Tulsa, OK 74137
$-2,337
Cash flow
-12.2%
Cash-on-Cash Return
2.9%
Cap rate
0.5%
Rent to Value Ratio

Active
$1,599,000
4
bds
|
3
ba
|
3,915
sqft
|
built
2022
9501 S 4170 Rd, Claremore, OK 74017
$-4,400
Cash flow
-14.4%
Cash-on-Cash Return
2.4%
Cap rate
0.3%
Rent to Value Ratio

Active
$1,050,000
4
bds
|
6
ba
|
5,776
sqft
|
built
2006
10625 S Forest Ave, Jenks, OK 74037
$-4,286
Cash flow
-21.3%
Cash-on-Cash Return
0.8%
Cap rate
0.3%
Rent to Value Ratio

Active
$219,900
4
bds
|
2
ba
|
1,760
sqft
|
built
1970
105 Hinton Blvd, Mannford, OK 74044
$-52
Cash flow
-1.2%
Cash-on-Cash Return
5.4%
Cap rate
0.7%
Rent to Value Ratio

Active
$100,000
2
bds
|
2
ba
|
1,153
sqft
|
built
1970
4302 E 67th St, Tulsa, OK 74136
$-17
Cash flow
-0.9%
Cash-on-Cash Return
5.5%
Cap rate
1.3%
Rent to Value Ratio
Active
$365,000
3
bds
|
3
ba
|
2,058
sqft
|
built
1989
15318 W Jones Rd, Tahlequah, OK 74464
$101
Cash flow
1.4%
Cash-on-Cash Return
6.0%
Cap rate
0.8%
Rent to Value Ratio

Active
$375,000
6
bds
|
5
ba
|
5,850
sqft
|
built
1904
919 Nelson Dr, Muskogee, OK 74401
$-544
Cash flow
-7.6%
Cash-on-Cash Return
3.9%
Cap rate
0.5%
Rent to Value Ratio

Active
$160,000
3
bds
|
1
ba
|
1,014
sqft
|
built
1935
416 N Franklin Ave, Sand Springs, OK 74063
$151
Cash flow
4.9%
Cash-on-Cash Return
6.8%
Cap rate
0.9%
Rent to Value Ratio
Active
$1,060,000
5
bds
|
5
ba
|
5,449
sqft
|
built
2007
3270 Cypress Ln, Tahlequah, OK 74464
$-3,490
Cash flow
-17.2%
Cash-on-Cash Return
1.7%
Cap rate
0.3%
Rent to Value Ratio
Active
$850,000
2
bds
|
3
ba
|
2,160
sqft
|
built
1975
12219 Highway 62, Tahlequah, OK 74464
$-2,357
Cash flow
-14.5%
Cash-on-Cash Return
2.4%
Cap rate
0.3%
Rent to Value Ratio
Active
$238,700
3
bds
|
3
ba
|
1,841
sqft
|
built
1980
70041 S 336 Ct, Wagoner, OK 74467
$11
Cash flow
0.2%
Cash-on-Cash Return
5.7%
Cap rate
0.8%
Rent to Value Ratio
Active
$1,070,000
5
bds
|
6
ba
|
5,228
sqft
|
built
2012
4416 S Orange Ave, Broken Arrow, OK 74011
$-2,837
Cash flow
-13.8%
Cash-on-Cash Return
2.5%
Cap rate
0.5%
Rent to Value Ratio
Active
$320,000
4
bds
|
4
ba
|
1,500
sqft
|
built
2019
112 W Allen Rd, Tahlequah, OK 74464
$-455
Cash flow
-7.4%
Cash-on-Cash Return
4.0%
Cap rate
0.5%
Rent to Value Ratio
Active
$359,900
3
bds
|
3
ba
|
1,750
sqft
|
built
2022
8147 US Highway 77, Marietta, OK 73448
$-687
Cash flow
-10.0%
Cash-on-Cash Return
3.4%
Cap rate
0.5%
Rent to Value Ratio
Active
$299,900
3
bds
|
3
ba
|
2,595
sqft
|
built
1957
1335 N Mc Farland Pl, Claremore, OK 74017
$-386
Cash flow
-6.7%
Cash-on-Cash Return
4.1%
Cap rate
0.6%
Rent to Value Ratio
Active
$1,150,000
4
bds
|
6
ba
|
5,236
sqft
|
built
2012
21149 S Highway View Dr, Tahlequah, OK 74464
$-3,616
Cash flow
-16.4%
Cash-on-Cash Return
1.9%
Cap rate
0.3%
Rent to Value Ratio
Active
$205,000
3
bds
|
2
ba
|
1,377
sqft
|
built
1994
124 S 5th Ave, Stroud, OK 74079
$-125
Cash flow
-3.2%
Cash-on-Cash Return
4.9%
Cap rate
0.7%
Rent to Value Ratio
Active
$265,000
3
bds
|
2
ba
|
1,648
sqft
|
built
1970
904 NE 12th St, Wagoner, OK 74467
$-210
Cash flow
-4.1%
Cash-on-Cash Return
4.7%
Cap rate
0.7%
Rent to Value Ratio
Active
$220,000
3
bds
|
1
ba
|
1,239
sqft
|
built
1968
12636 E 34th St, Tulsa, OK 74146
$-244
Cash flow
-5.8%
Cash-on-Cash Return
4.3%
Cap rate
0.6%
Rent to Value Ratio
Active
$187,500
3
bds
|
2
ba
|
1,382
sqft
|
built
1960
1116 E 6th St, Cushing, OK 74023
$-159
Cash flow
-4.4%
Cash-on-Cash Return
4.7%
Cap rate
0.6%
Rent to Value Ratio
Active
$200,000
3
bds
|
2
ba
|
1,668
sqft
|
built
1930
20090 Sharp Rd, Okmulgee, OK 74447
$-13
Cash flow
-0.3%
Cash-on-Cash Return
5.6%
Cap rate
0.7%
Rent to Value Ratio
Active
$305,000
4
bds
|
2
ba
|
1,831
sqft
|
built
2021
26550 Columbia Crest Dr, Claremore, OK 74019
$-387
Cash flow
-6.6%
Cash-on-Cash Return
4.2%
Cap rate
0.6%
Rent to Value Ratio
Active
$979,500
3
bds
|
2
ba
|
2,621
sqft
|
built
2019
23800 E 720 Rd, Wagoner, OK 74467
$-2,490
Cash flow
-13.3%
Cash-on-Cash Return
2.6%
Cap rate
0.4%
Rent to Value Ratio
Active
$199,900
3
bds
|
2
ba
|
1,232
sqft
|
built
1978
1808 W Gary St, Broken Arrow, OK 74012
$13
Cash flow
0.3%
Cash-on-Cash Return
5.8%
Cap rate
0.8%
Rent to Value Ratio
Active
$138,500
2
bds
|
1
ba
|
846
sqft
|
built
1949
2333 W Easton Pl, Tulsa, OK 74127
$88
Cash flow
3.3%
Cash-on-Cash Return
6.4%
Cap rate
0.9%
Rent to Value Ratio
Active
$195,900
3
bds
|
2
ba
|
1,521
sqft
|
built
1981
2009 Tanglewood Ln, Muskogee, OK 74403
$-103
Cash flow
-2.7%
Cash-on-Cash Return
5.0%
Cap rate
0.7%
Rent to Value Ratio

Active
$299,000
4
bds
|
2
ba
|
2,168
sqft
|
built
1978
12517 E 38th St, Tulsa, OK 74146
$-346
Cash flow
-6.0%
Cash-on-Cash Return
4.3%
Cap rate
0.6%
Rent to Value Ratio
Active
$184,900
3
bds
|
2
ba
|
1,868
sqft
|
built
1932
322 C St SW, Ardmore, OK 73401
$139
Cash flow
3.9%
Cash-on-Cash Return
6.6%
Cap rate
0.9%
Rent to Value Ratio
Active
$235,000
3
bds
|
2
ba
|
1,497
sqft
|
built
1978
206 E 23rd St, Owasso, OK 74055
$-141
Cash flow
-3.1%
Cash-on-Cash Return
5.0%
Cap rate
0.7%
Rent to Value Ratio
Active
$115,000
1
bds
|
1
ba
|
720
sqft
|
built
1970
450 W 7th St, Tulsa, OK 74119
$-406
Cash flow
-18.4%
Cash-on-Cash Return
1.4%
Cap rate
1.2%
Rent to Value Ratio
Active
$255,000
3
bds
|
2
ba
|
1,539
sqft
|
built
2014
9222 S 251st East Ave, Broken Arrow, OK 74014
$-302
Cash flow
-6.2%
Cash-on-Cash Return
4.3%
Cap rate
0.6%
Rent to Value Ratio
Active
$400,000
3
bds
|
3
ba
|
2,868
sqft
|
built
2022
31950 E 62nd St S, Broken Arrow, OK 74014
$-520
Cash flow
-6.8%
Cash-on-Cash Return
4.1%
Cap rate
0.7%
Rent to Value Ratio
Active
$335,000
3
bds
|
3
ba
|
2,967
sqft
|
built
1981
9337 S Lakewood Ave, Tulsa, OK 74137
$-265
Cash flow
-4.1%
Cash-on-Cash Return
4.7%
Cap rate
0.7%
Rent to Value Ratio