Venice, FL Investment Properties for Sale
Browse homes for sale and investment properties in Venice, FL. Refine your search by price, property type, or more.
Best cash flowing properties in Venice, FL
Active
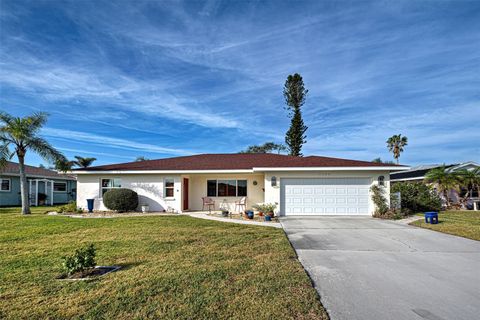
$299,000
3
bds
|
2
ba
|
1,656
sqft
|
built
1980
842 Linden Rd, Venice, FL 34293
$251
Cash flow
4.4%
Cash-on-Cash Return
7.2%
Cap rate
0.9%
Rent to Value Ratio

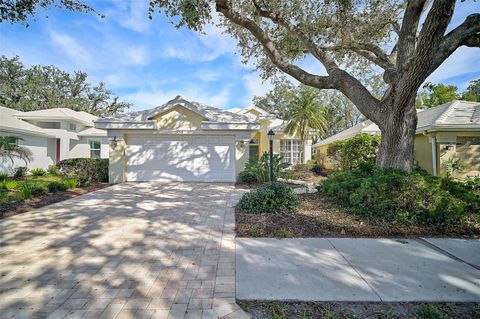
Active
$299,000
3
bds
|
2
ba
|
1,698
sqft
|
built
1990
3187 Galiot Rd, Venice, FL 34293
$100
Cash flow
1.7%
Cash-on-Cash Return
6.5%
Cap rate
0.8%
Rent to Value Ratio
581 out of 600 properties for sale in Venice, FL
Limited Results Shown
Create a free account, or log in to reveal all property listings and enjoy the complete experience.
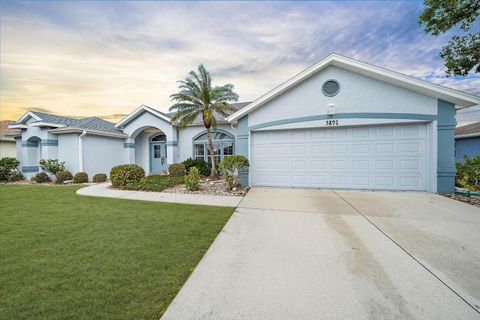
Active
$489,000
3
bds
|
3
ba
|
2,111
sqft
|
built
1993
5891 Madison Rd, Venice, FL 34293
$-550
Cash flow
-5.9%
Cash-on-Cash Return
4.8%
Cap rate
0.7%
Rent to Value Ratio
Active
$515,000
2
bds
|
2
ba
|
2,067
sqft
|
built
2003
651 Lakescene Dr, Venice, FL 34293
$-599
Cash flow
-6.1%
Cash-on-Cash Return
4.8%
Cap rate
0.7%
Rent to Value Ratio
Active
$599,000
3
bds
|
3
ba
|
2,505
sqft
|
built
1993
487 Summerfield Way, Venice, FL 34292
$-846
Cash flow
-7.4%
Cash-on-Cash Return
4.5%
Cap rate
0.7%
Rent to Value Ratio
Active
$1,348,000
4
bds
|
4
ba
|
3,673
sqft
|
built
2024
11571 Gleaming Ter, Venice, FL 34293
$-1,578
Cash flow
-6.1%
Cash-on-Cash Return
4.7%
Cap rate
0.7%
Rent to Value Ratio
Active
$450,000
3
bds
|
3
ba
|
1,568
sqft
|
built
1977
1723 N Gondola Ct, Venice, FL 34293
$-283
Cash flow
-3.3%
Cash-on-Cash Return
5.4%
Cap rate
0.7%
Rent to Value Ratio
Active
$405,000
3
bds
|
2
ba
|
1,637
sqft
|
built
1993
554 Fallbrook Dr, Venice, FL 34292
$-781
Cash flow
-10.1%
Cash-on-Cash Return
3.8%
Cap rate
0.7%
Rent to Value Ratio
Active
$697,500
3
bds
|
2
ba
|
2,478
sqft
|
built
2000
557 Marsh Creek Rd, Venice, FL 34292
$-1,244
Cash flow
-9.3%
Cash-on-Cash Return
4.0%
Cap rate
0.6%
Rent to Value Ratio
Active
$395,000
3
bds
|
2
ba
|
1,882
sqft
|
built
1992
560 Fallbrook Dr, Venice, FL 34292
$-864
Cash flow
-11.4%
Cash-on-Cash Return
3.5%
Cap rate
0.7%
Rent to Value Ratio
Active
$690,000
3
bds
|
3
ba
|
2,898
sqft
|
built
1992
256 Royal Oak Way, Venice, FL 34292
$-712
Cash flow
-5.4%
Cash-on-Cash Return
4.9%
Cap rate
0.7%
Rent to Value Ratio
Active
$440,000
2
bds
|
2
ba
|
1,907
sqft
|
built
2021
24269 Spartina Dr, Venice, FL 34293
$-1,564
Cash flow
-18.5%
Cash-on-Cash Return
1.9%
Cap rate
0.7%
Rent to Value Ratio

Active
$759,000
3
bds
|
3
ba
|
2,338
sqft
|
built
1999
770 Egret Walk Ln, Venice, FL 34292
$-1,080
Cash flow
-7.4%
Cash-on-Cash Return
4.4%
Cap rate
0.6%
Rent to Value Ratio
Active
$849,900
4
bds
|
3
ba
|
2,365
sqft
|
built
2019
20686 Valprato, Venice, FL 34293
$-1,862
Cash flow
-11.4%
Cash-on-Cash Return
3.5%
Cap rate
0.6%
Rent to Value Ratio

Active
$385,000
3
bds
|
2
ba
|
1,560
sqft
|
built
1997
320 Langholm Dr, Venice, FL 34293
$-540
Cash flow
-7.3%
Cash-on-Cash Return
4.5%
Cap rate
0.7%
Rent to Value Ratio
Active
$375,000
3
bds
|
3
ba
|
1,977
sqft
|
built
2005
1630 Monarch Dr, Venice, FL 34293
$-753
Cash flow
-10.5%
Cash-on-Cash Return
3.7%
Cap rate
0.9%
Rent to Value Ratio
Active
$514,900
3
bds
|
2
ba
|
2,457
sqft
|
built
1995
339 Meadow Beauty Ct, Venice, FL 34293
$-939
Cash flow
-9.5%
Cash-on-Cash Return
4.0%
Cap rate
0.6%
Rent to Value Ratio
Active
$624,900
3
bds
|
3
ba
|
2,665
sqft
|
built
2017
13925 Miranese St, Venice, FL 34293
$-1,688
Cash flow
-14.1%
Cash-on-Cash Return
2.9%
Cap rate
0.6%
Rent to Value Ratio
Active
$299,000
3
bds
|
2
ba
|
1,656
sqft
|
built
1980
842 Linden Rd, Venice, FL 34293
$251
Cash flow
4.4%
Cash-on-Cash Return
7.2%
Cap rate
0.9%
Rent to Value Ratio
Active
$925,000
3
bds
|
3
ba
|
2,402
sqft
|
built
2020
10705 Tarflower Dr, Venice, FL 34293
$-2,501
Cash flow
-14.1%
Cash-on-Cash Return
2.9%
Cap rate
0.6%
Rent to Value Ratio
Active
$1,250,000
4
bds
|
3
ba
|
3,048
sqft
|
built
1946
321 Pedro St, Venice, FL 34285
$-3,394
Cash flow
-14.2%
Cash-on-Cash Return
2.9%
Cap rate
0.4%
Rent to Value Ratio

Active
$437,000
3
bds
|
2
ba
|
1,722
sqft
|
built
1979
1608 Honey Ct, Venice, FL 34293
$-32
Cash flow
-0.4%
Cash-on-Cash Return
6.1%
Cap rate
0.8%
Rent to Value Ratio
Active
$385,000
2
bds
|
2
ba
|
1,437
sqft
|
built
2015
19155 Mangieri St, Venice, FL 34293
$-1,231
Cash flow
-16.7%
Cash-on-Cash Return
2.3%
Cap rate
0.6%
Rent to Value Ratio
Active
$1,000,000
3
bds
|
2
ba
|
1,659
sqft
|
built
1985
900 Osprey St, Venice, FL 34285
$-2,071
Cash flow
-10.8%
Cash-on-Cash Return
3.7%
Cap rate
0.5%
Rent to Value Ratio
Active
$499,000
3
bds
|
2
ba
|
1,987
sqft
|
built
2006
11467 Conch Ct, Venice, FL 34292
$-735
Cash flow
-7.7%
Cash-on-Cash Return
4.4%
Cap rate
0.7%
Rent to Value Ratio
Active
$729,000
2
bds
|
2
ba
|
1,113
sqft
|
built
1969
237 San Marco Dr, Venice, FL 34285
$-2,236
Cash flow
-16.0%
Cash-on-Cash Return
2.5%
Cap rate
0.4%
Rent to Value Ratio
Active
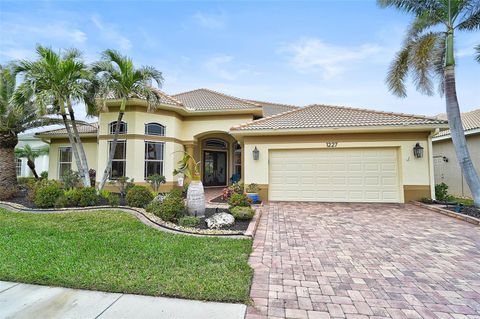
$825,000
3
bds
|
3
ba
|
2,783
sqft
|
built
2006
1227 Tuscany Blvd, Venice, FL 34292
$-1,538
Cash flow
-9.7%
Cash-on-Cash Return
3.9%
Cap rate
0.7%
Rent to Value Ratio
Active
$464,000
3
bds
|
3
ba
|
2,182
sqft
|
built
2015
11053 Barnsley Dr, Venice, FL 34293
$-454
Cash flow
-5.1%
Cash-on-Cash Return
5.0%
Cap rate
0.8%
Rent to Value Ratio
Active
$529,999
3
bds
|
2
ba
|
1,669
sqft
|
built
2019
9895 Wingood Dr, Venice, FL 34292
$-1,032
Cash flow
-10.2%
Cash-on-Cash Return
3.8%
Cap rate
0.7%
Rent to Value Ratio
Active
$299,000
3
bds
|
2
ba
|
1,698
sqft
|
built
1990
3187 Galiot Rd, Venice, FL 34293
$100
Cash flow
1.7%
Cash-on-Cash Return
6.5%
Cap rate
0.8%
Rent to Value Ratio
Active
$565,000
3
bds
|
2
ba
|
2,374
sqft
|
built
1954
800 Riviera St, Venice, FL 34285
$-870
Cash flow
-8.0%
Cash-on-Cash Return
4.3%
Cap rate
0.6%
Rent to Value Ratio
Active
$375,000
2
bds
|
2
ba
|
1,344
sqft
|
built
1969
2271 Sandlewood Dr, Venice, FL 34293
$-91
Cash flow
-1.3%
Cash-on-Cash Return
5.9%
Cap rate
0.7%
Rent to Value Ratio
Active
$579,900
3
bds
|
3
ba
|
2,000
sqft
|
built
2007
13240 Guyana St, Venice, FL 34293
$-1,502
Cash flow
-13.5%
Cash-on-Cash Return
3.0%
Cap rate
0.6%
Rent to Value Ratio
Active
$539,000
3
bds
|
2
ba
|
1,768
sqft
|
built
1990
9008 Allapata Ln, Venice, FL 34293
$-734
Cash flow
-7.1%
Cash-on-Cash Return
4.5%
Cap rate
0.7%
Rent to Value Ratio
Active
$380,000
3
bds
|
2
ba
|
1,610
sqft
|
built
1999
135 Braemar Ave, Venice, FL 34293
$-652
Cash flow
-9.0%
Cash-on-Cash Return
4.1%
Cap rate
0.7%
Rent to Value Ratio
Active
$5,900,000
5
bds
|
5
ba
|
5,043
sqft
|
built
1998
213 The Esplanade S, Venice, FL 34285
$-26,299
Cash flow
-23.3%
Cash-on-Cash Return
0.8%
Cap rate
0.2%
Rent to Value Ratio

Active
$1,199,900
4
bds
|
3
ba
|
2,721
sqft
|
built
1973
315 Park Blvd N, Venice, FL 34285
$-2,627
Cash flow
-11.4%
Cash-on-Cash Return
3.5%
Cap rate
0.4%
Rent to Value Ratio
Active
$399,900
2
bds
|
2
ba
|
1,698
sqft
|
built
1979
1290 Cambridge Dr, Venice, FL 34293
$-376
Cash flow
-4.9%
Cash-on-Cash Return
5.0%
Cap rate
0.7%
Rent to Value Ratio
Active
$775,000
3
bds
|
3
ba
|
2,620
sqft
|
built
2005
1206 Tuscany Blvd, Venice, FL 34292
$-1,426
Cash flow
-9.6%
Cash-on-Cash Return
3.9%
Cap rate
0.6%
Rent to Value Ratio
Active
$423,900
3
bds
|
3
ba
|
2,084
sqft
|
built
2010
1570 Monarch Dr, Venice, FL 34293
$-481
Cash flow
-5.9%
Cash-on-Cash Return
4.8%
Cap rate
0.7%
Rent to Value Ratio
Active
$599,000
3
bds
|
3
ba
|
2,329
sqft
|
built
1991
230 Vestavia Dr, Venice, FL 34292
$-1,129
Cash flow
-9.8%
Cash-on-Cash Return
3.9%
Cap rate
0.7%
Rent to Value Ratio
Active
$499,000
4
bds
|
2
ba
|
2,038
sqft
|
built
2020
11945 Lovegrass St, Venice, FL 34293
$-1,028
Cash flow
-10.7%
Cash-on-Cash Return
3.7%
Cap rate
0.6%
Rent to Value Ratio