Venice, FL Investment Properties for Sale
Browse homes for sale and investment properties in Venice, FL. Refine your search by price, property type, or more.
Best cash flowing properties in Venice, FL
Active
$475,000
2
bds
|
2
ba
|
867
sqft
|
built
1969
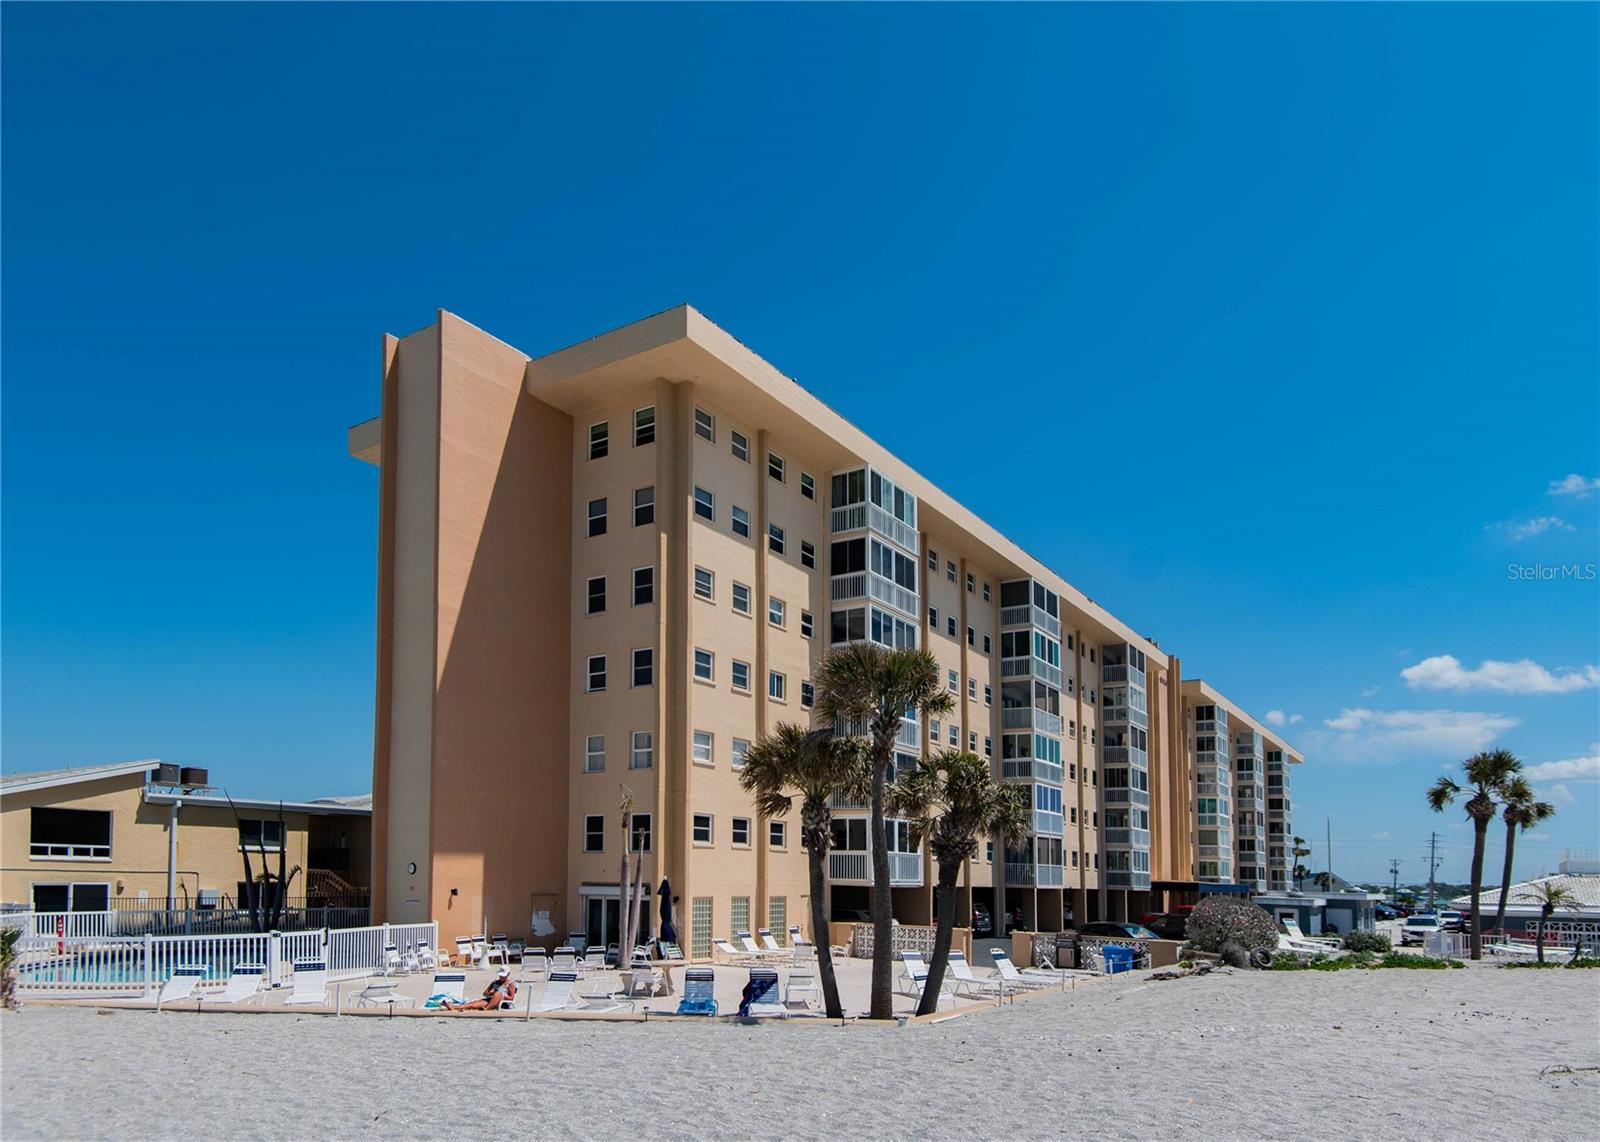
1255 Tarpon Center Dr, Venice, FL 34285
$225
Cash flow
2.5%
Cash-on-Cash Return
6.7%
Cap rate
1.0%
Rent to Value Ratio
Active
$200,000
2
bds
|
2
ba
|
940
sqft
|
built
1976
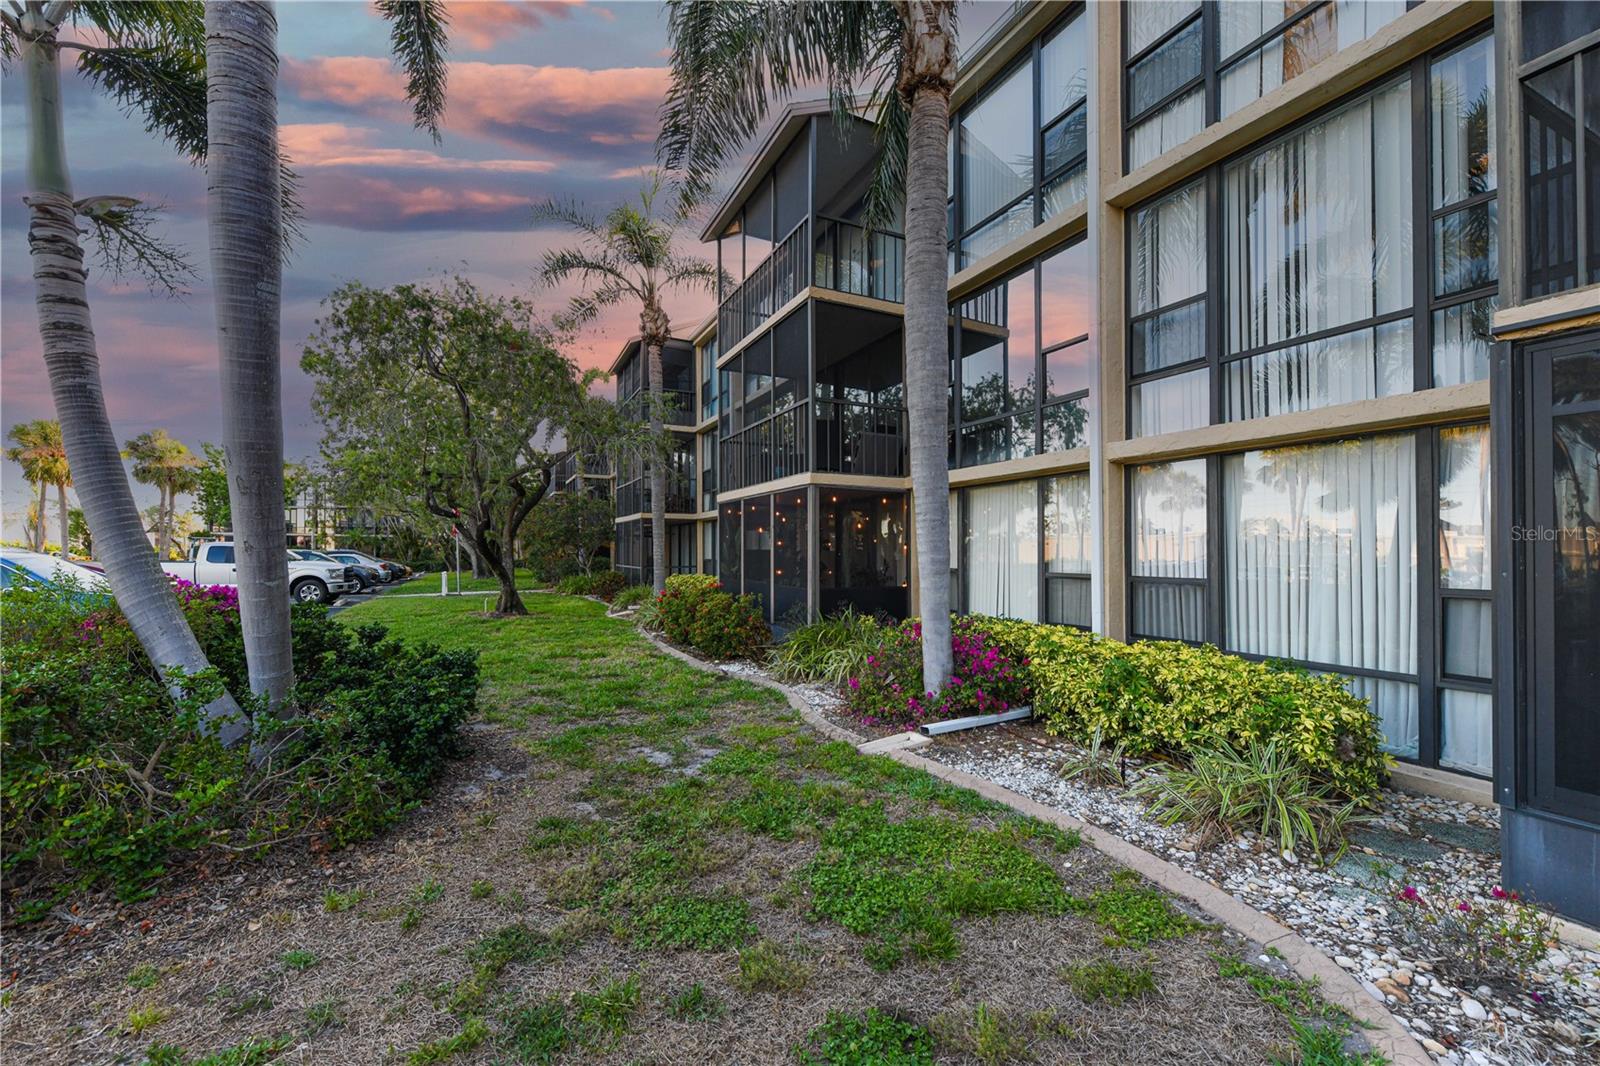
618 Bird Bay Dr S, Venice, FL 34285
$177
Cash flow
4.6%
Cash-on-Cash Return
7.2%
Cap rate
0.9%
Rent to Value Ratio
782 out of 839 properties for sale in Venice, FL
Limited Results Shown
Create a free account, or log in to reveal all property listings and enjoy the complete experience.
Active
$225,000
2
bds
|
2
ba
|
1,092
sqft
|
built
1979
1154 Bird Bay Way, Venice, FL 34285
$-608
Cash flow
-14.1%
Cash-on-Cash Return
2.9%
Cap rate
1.0%
Rent to Value Ratio
Active
$475,000
2
bds
|
2
ba
|
867
sqft
|
built
1969
1255 Tarpon Center Dr, Venice, FL 34285
$225
Cash flow
2.5%
Cash-on-Cash Return
6.7%
Cap rate
1.0%
Rent to Value Ratio
Active
$347,000
3
bds
|
2
ba
|
1,307
sqft
|
built
1980
1439 Strada D Argento, Venice, FL 34292
$-147
Cash flow
-2.2%
Cash-on-Cash Return
5.6%
Cap rate
0.7%
Rent to Value Ratio
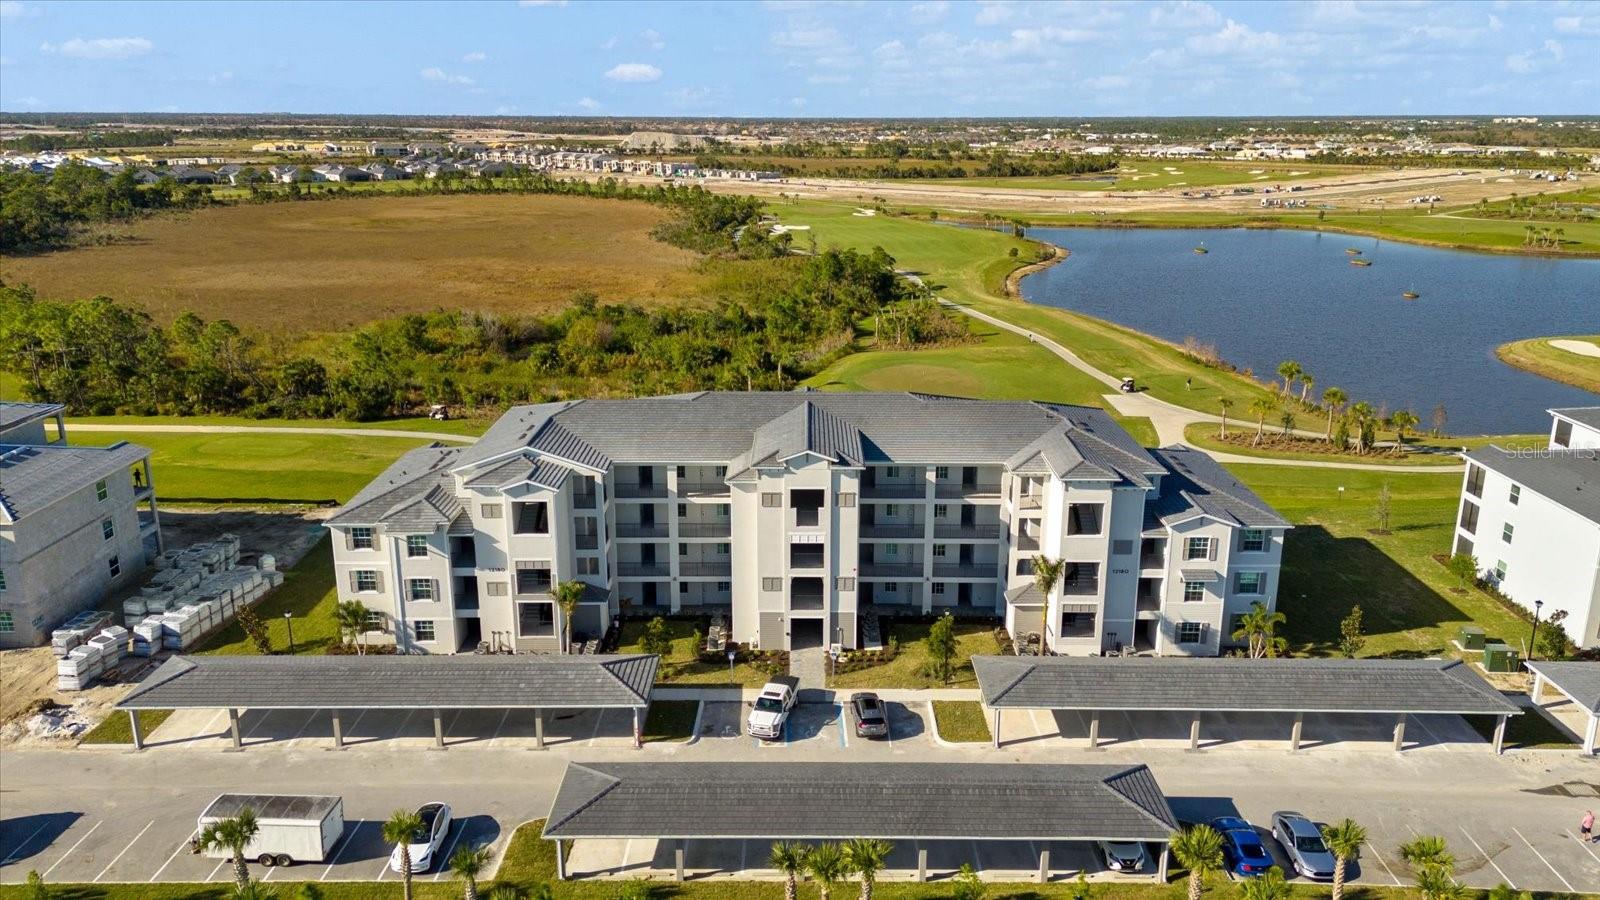
Pending
$259,900
2
bds
|
2
ba
|
1,149
sqft
|
built
2023
12180 Wellen Golf St, Venice, FL 34293
$-714
Cash flow
-14.3%
Cash-on-Cash Return
2.8%
Cap rate
0.8%
Rent to Value Ratio
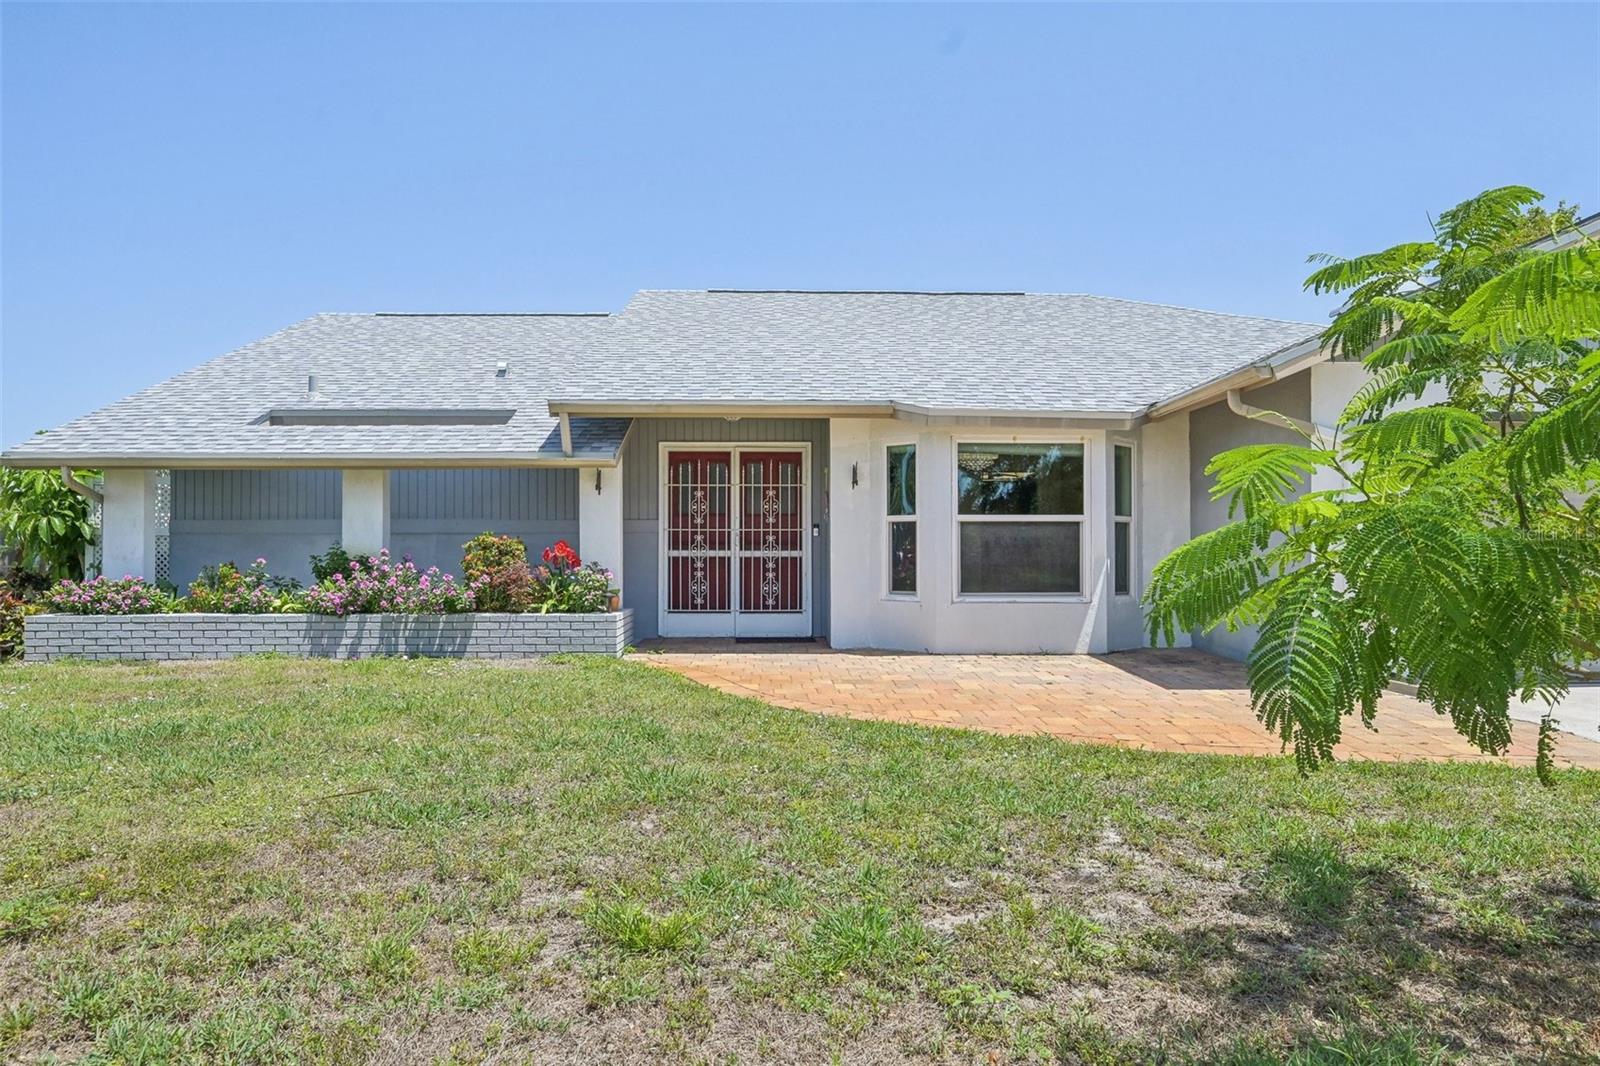
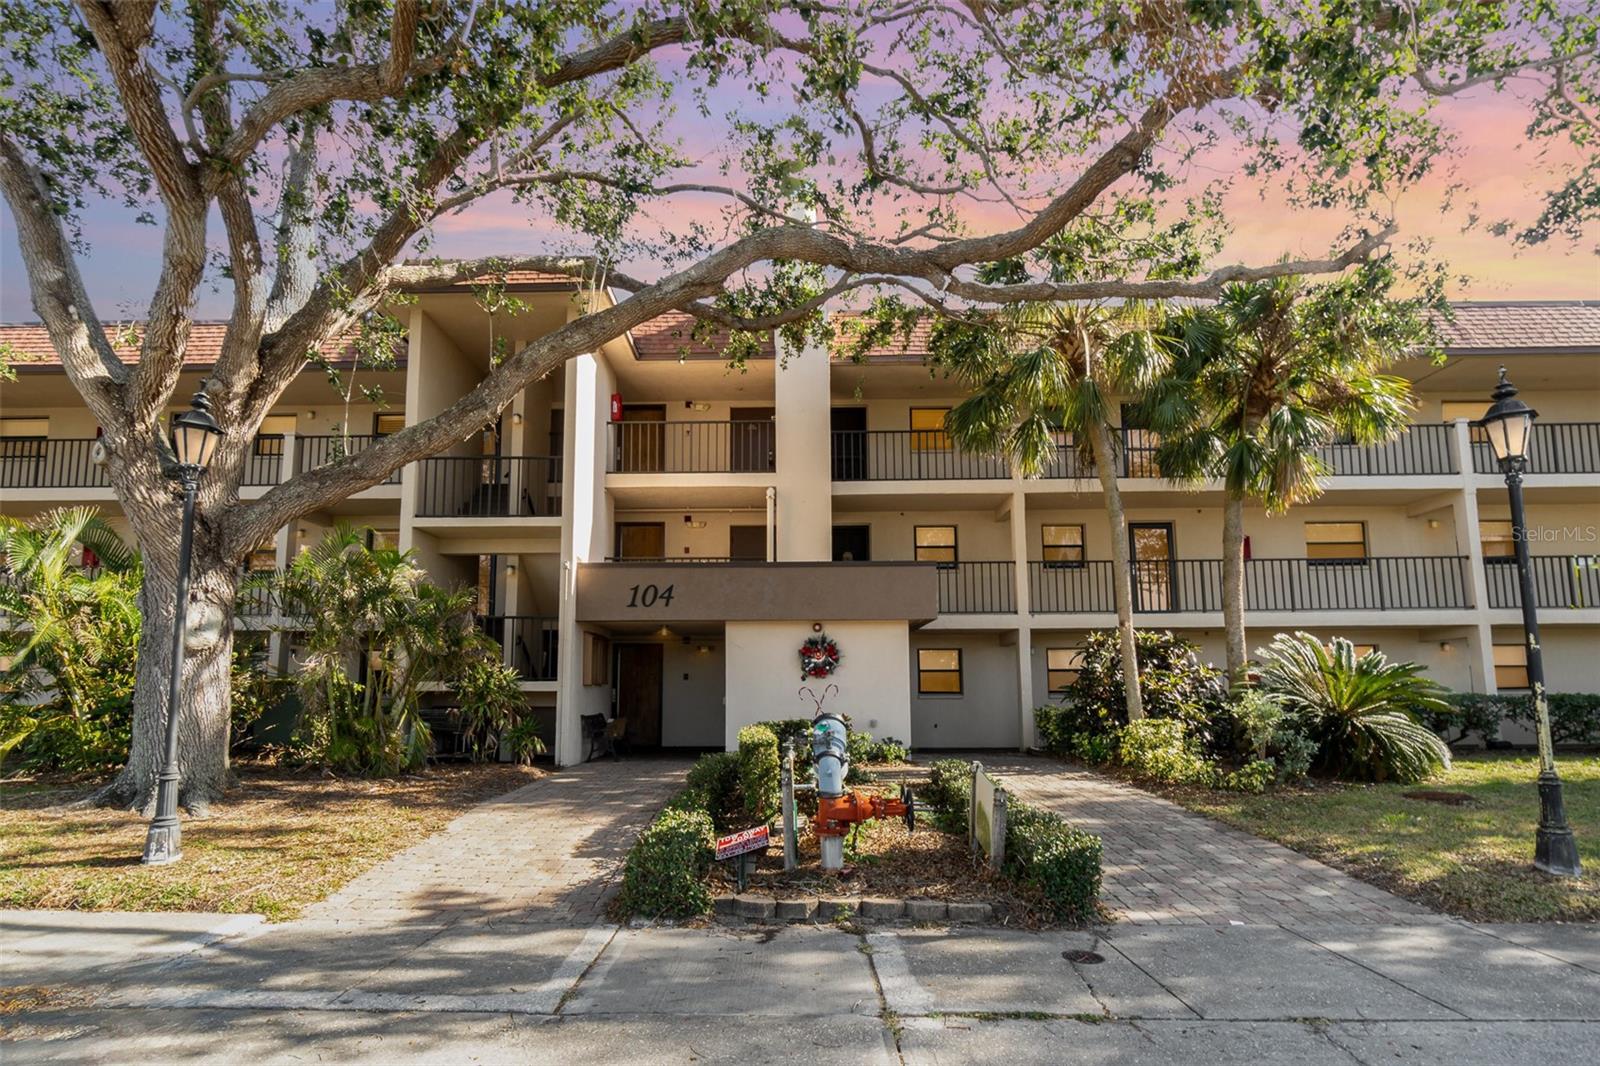
Active
$349,900
2
bds
|
2
ba
|
1,863
sqft
|
built
1986
104 Hourglass Dr, Venice, FL 34293
$-147
Cash flow
-2.2%
Cash-on-Cash Return
5.6%
Cap rate
0.8%
Rent to Value Ratio
Active
$450,000
4
bds
|
3
ba
|
2,025
sqft
|
built
2012
2150 Snapdragon Ln, Venice, FL 34292
$-824
Cash flow
-9.6%
Cash-on-Cash Return
3.9%
Cap rate
0.6%
Rent to Value Ratio

Active
$390,000
3
bds
|
2
ba
|
1,681
sqft
|
built
2022
19801 Fishhawk Trl, Venice, FL 34293
$-902
Cash flow
-12.1%
Cash-on-Cash Return
3.4%
Cap rate
0.7%
Rent to Value Ratio
Active
$280,000
2
bds
|
2
ba
|
1,025
sqft
|
built
1980
3031 Englewood Rd, Venice, FL 34293
$-160
Cash flow
-3.0%
Cash-on-Cash Return
5.5%
Cap rate
0.7%
Rent to Value Ratio
Active
$724,000
4
bds
|
3
ba
|
2,980
sqft
|
built
2005
4239 Corso Venetia Blvd, Venice, FL 34293
$-1,904
Cash flow
-13.7%
Cash-on-Cash Return
3.0%
Cap rate
0.5%
Rent to Value Ratio
Active
$400,000
3
bds
|
2
ba
|
1,864
sqft
|
built
1987
3335 Meadow Run Ter, Venice, FL 34293
$-559
Cash flow
-7.3%
Cash-on-Cash Return
4.5%
Cap rate
0.7%
Rent to Value Ratio
Active
$200,000
2
bds
|
2
ba
|
940
sqft
|
built
1976
618 Bird Bay Dr S, Venice, FL 34285
$177
Cash flow
4.6%
Cash-on-Cash Return
7.2%
Cap rate
0.9%
Rent to Value Ratio
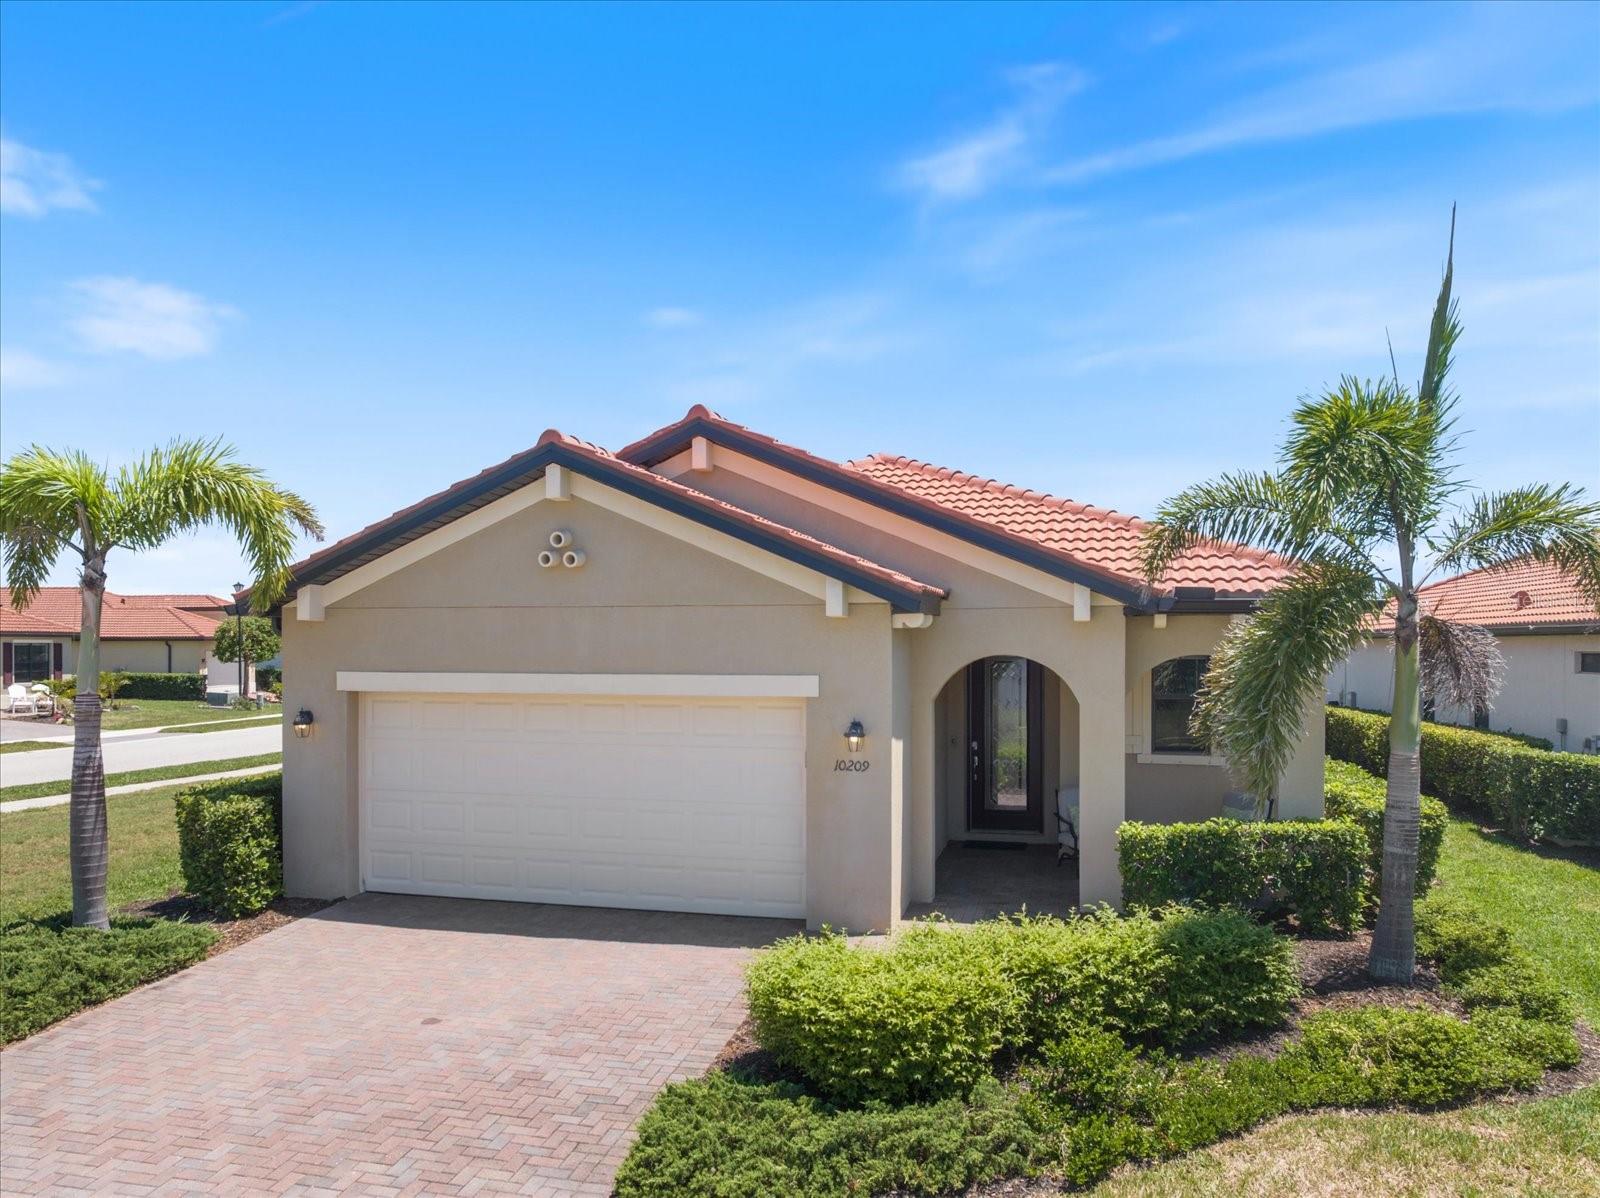
Active
$555,000
2
bds
|
2
ba
|
1,900
sqft
|
built
2020
10209 Fiddlewood Dr, Venice, FL 34293
$-1,622
Cash flow
-15.2%
Cash-on-Cash Return
2.6%
Cap rate
0.6%
Rent to Value Ratio
Active
$289,900
2
bds
|
2
ba
|
1,426
sqft
|
built
1986
3141 Heron Shores Dr, Venice, FL 34293
$-556
Cash flow
-10.0%
Cash-on-Cash Return
3.8%
Cap rate
0.8%
Rent to Value Ratio
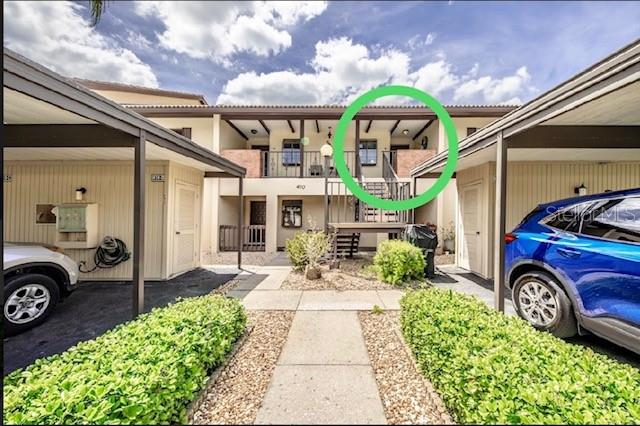
Active
$279,500
2
bds
|
2
ba
|
1,064
sqft
|
built
1982
410 Mission Trl E, Venice, FL 34285
$-553
Cash flow
-10.3%
Cash-on-Cash Return
3.8%
Cap rate
0.8%
Rent to Value Ratio
Pending
$360,000
3
bds
|
2
ba
|
1,597
sqft
|
built
2000
143 Braemar Ave, Venice, FL 34293
$-200
Cash flow
-2.9%
Cash-on-Cash Return
5.5%
Cap rate
0.9%
Rent to Value Ratio
Active
$635,900
3
bds
|
3
ba
|
2,411
sqft
|
built
1996
585 Khyber Ln, Venice, FL 34293
$-1,478
Cash flow
-12.1%
Cash-on-Cash Return
3.4%
Cap rate
0.6%
Rent to Value Ratio
Active
$480,000
2
bds
|
2
ba
|
1,438
sqft
|
built
1991
528 W Venice Ave, Venice, FL 34285
$-916
Cash flow
-10.0%
Cash-on-Cash Return
3.9%
Cap rate
0.6%
Rent to Value Ratio

Active
$625,000
4
bds
|
3
ba
|
2,565
sqft
|
built
1998
427 Autumn Chase Dr, Venice, FL 34292
$-1,621
Cash flow
-13.5%
Cash-on-Cash Return
3.0%
Cap rate
0.7%
Rent to Value Ratio

Active
$549,900
3
bds
|
2
ba
|
1,654
sqft
|
built
1987
245 Woodingham Trl, Venice, FL 34292
$-1,265
Cash flow
-12.0%
Cash-on-Cash Return
3.4%
Cap rate
0.5%
Rent to Value Ratio

Active
$599,000
3
bds
|
2
ba
|
1,363
sqft
|
built
1963
832 White Cap Cir, Venice, FL 34285
$-3,014
Cash flow
-26.3%
Cash-on-Cash Return
0.1%
Cap rate
0.5%
Rent to Value Ratio
Active
$145,000
1
bds
|
1
ba
|
680
sqft
|
built
1983
104 Capri Isles Blvd, Venice, FL 34292
$-785
Cash flow
-28.2%
Cash-on-Cash Return
-0.3%
Cap rate
1.1%
Rent to Value Ratio
Active
$325,000
3
bds
|
1
ba
|
1,098
sqft
|
built
1972
920 Myrtle Ave, Venice, FL 34285
$-372
Cash flow
-6.0%
Cash-on-Cash Return
4.8%
Cap rate
0.7%
Rent to Value Ratio
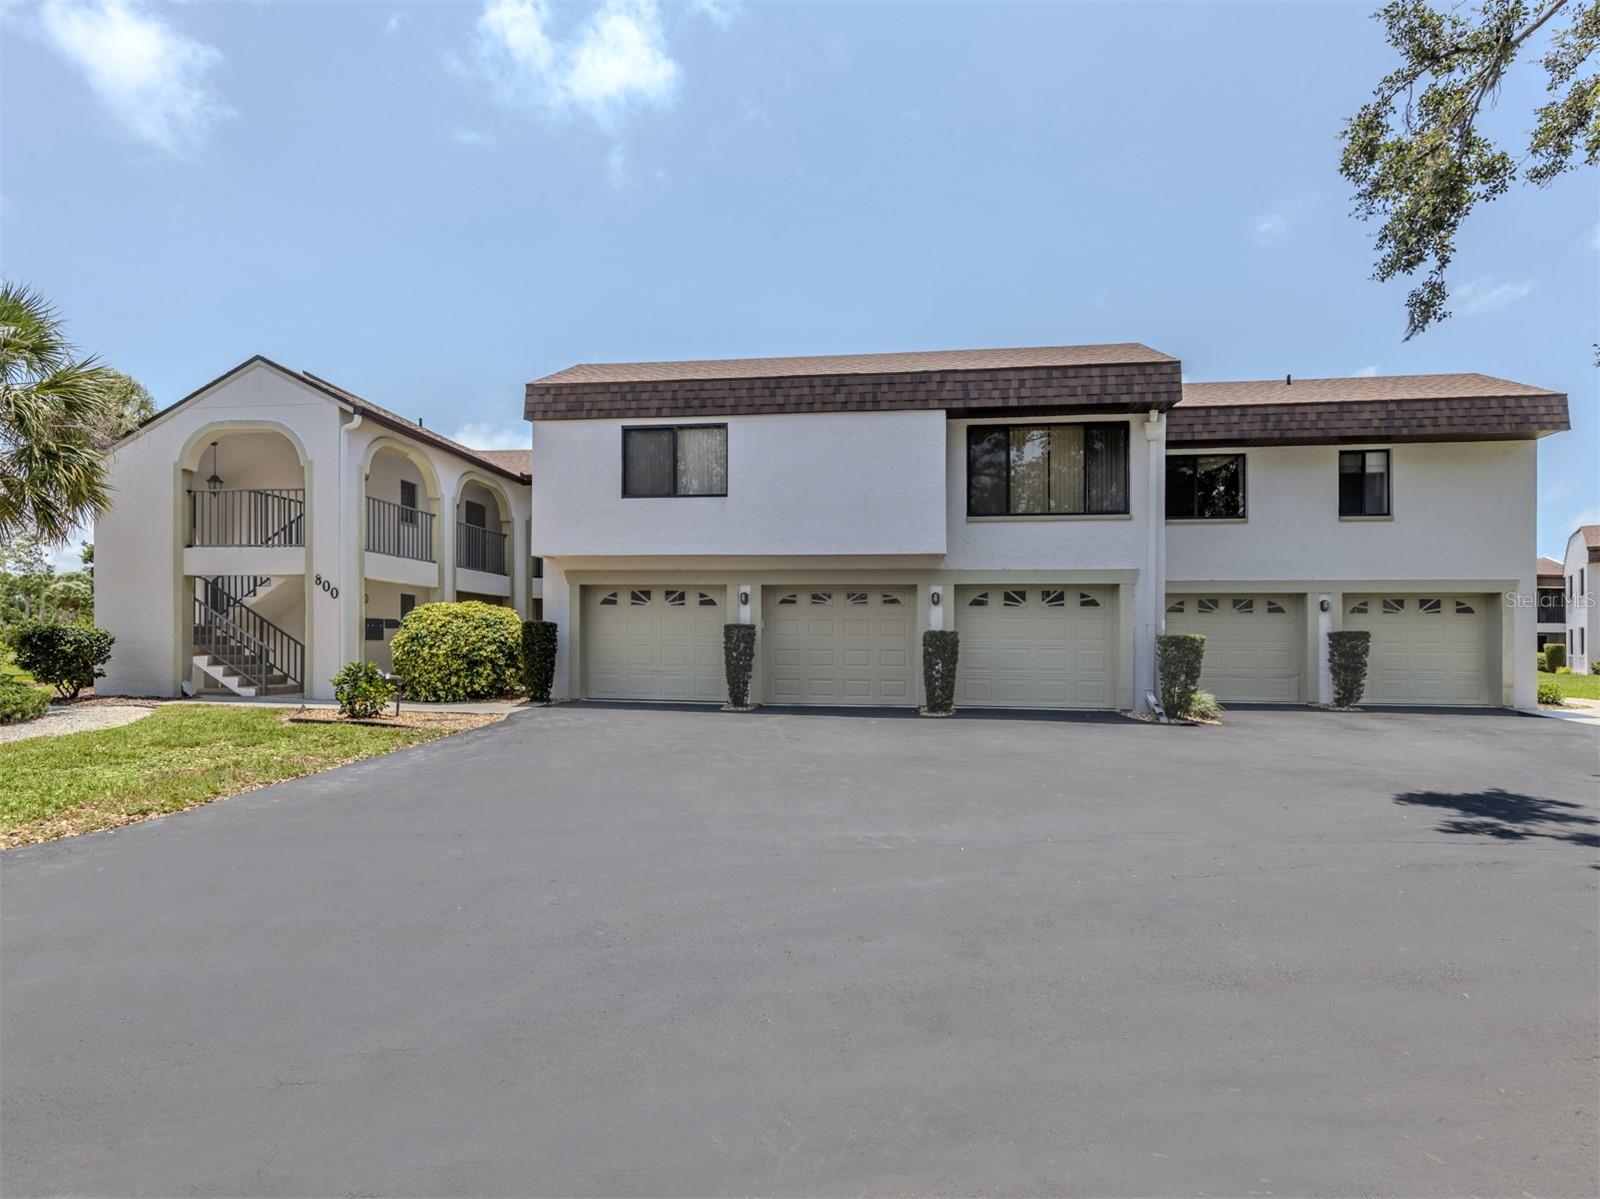
Active
$225,000
2
bds
|
2
ba
|
1,120
sqft
|
built
1988
800 Capri Isles Blvd, Venice, FL 34292
$-81
Cash flow
-1.9%
Cash-on-Cash Return
5.7%
Cap rate
0.8%
Rent to Value Ratio
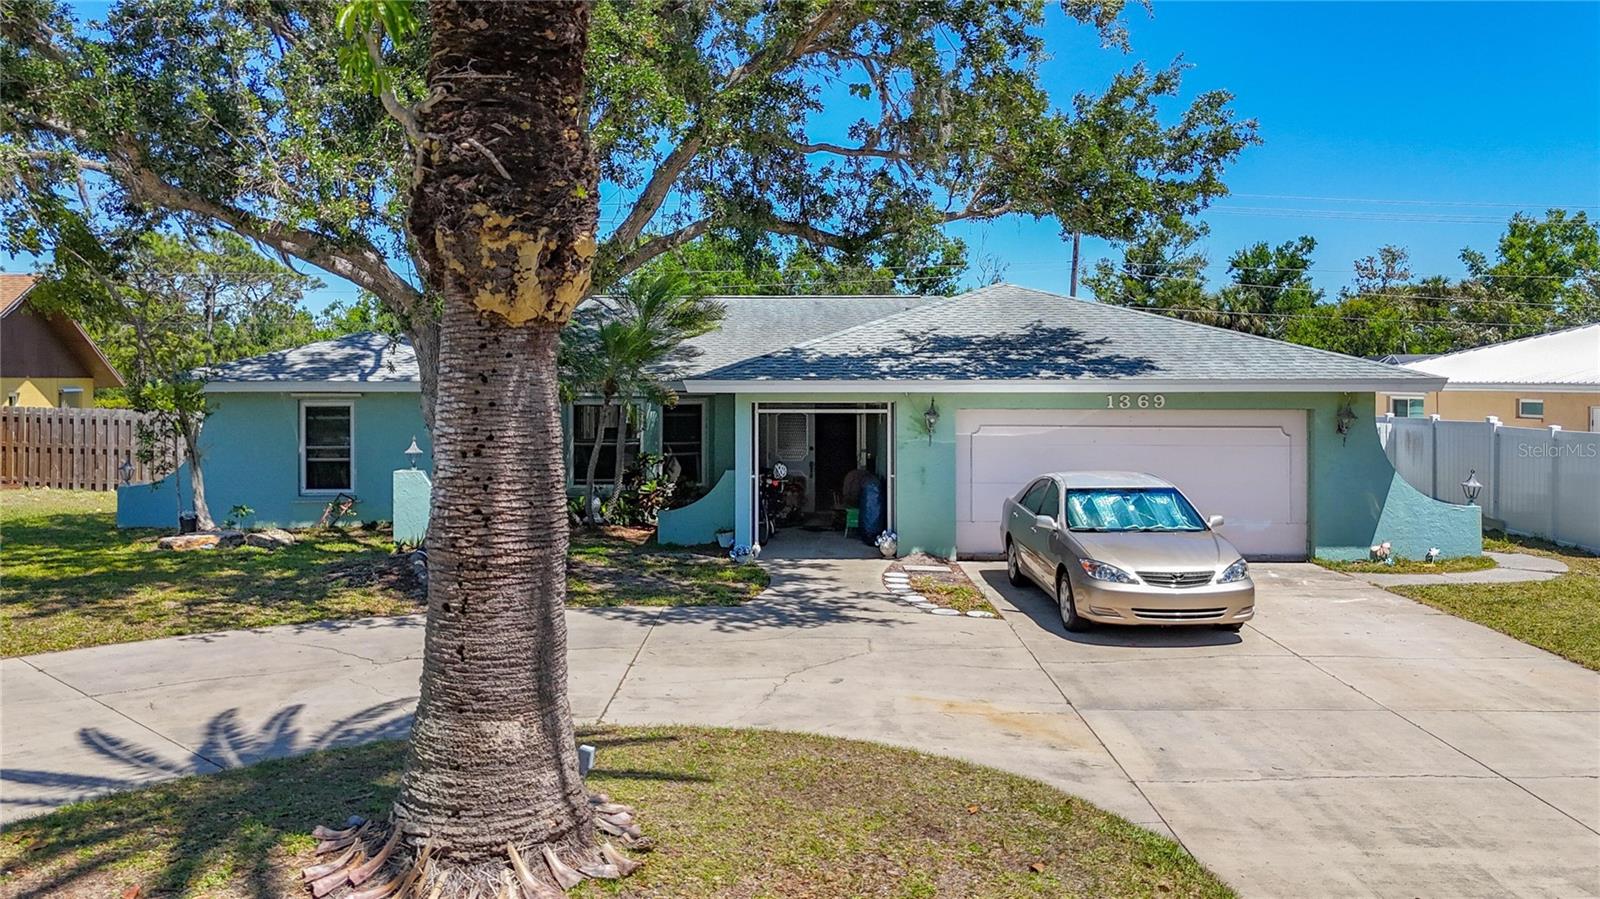
Active
$399,999
3
bds
|
2
ba
|
1,956
sqft
|
built
1982
1369 Brookside Dr, Venice, FL 34285
$-456
Cash flow
-5.9%
Cash-on-Cash Return
4.8%
Cap rate
0.7%
Rent to Value Ratio
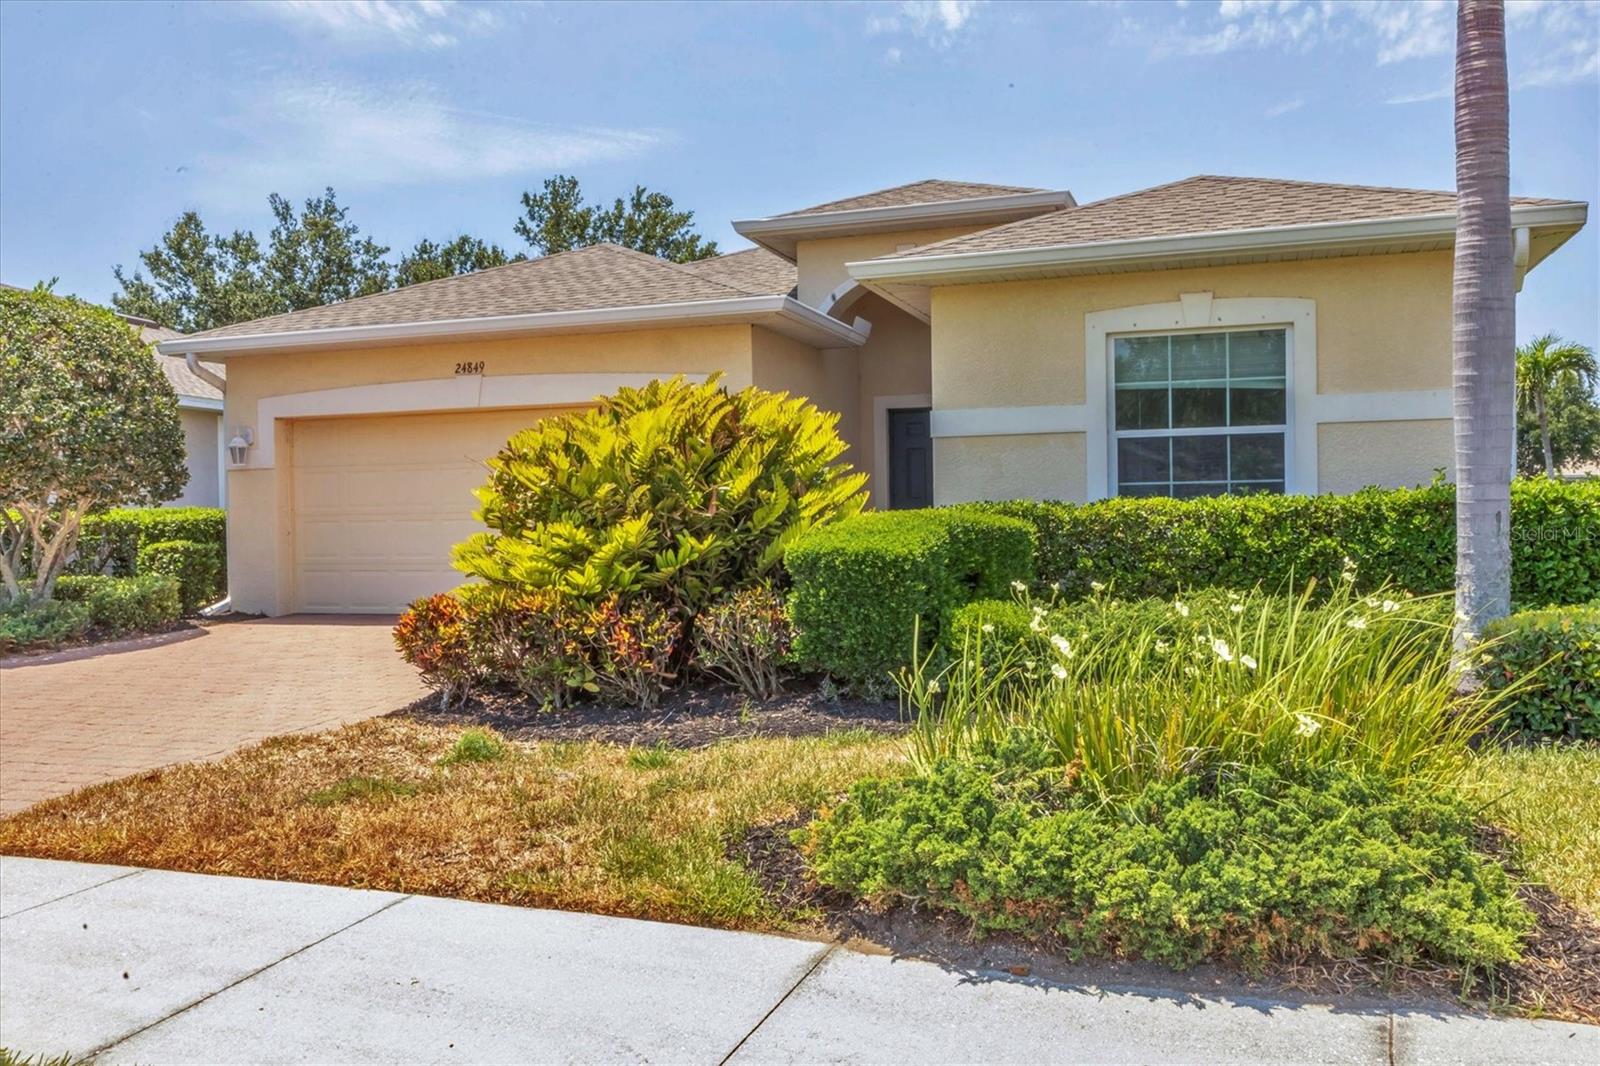
Active
$429,000
3
bds
|
2
ba
|
1,806
sqft
|
built
2010
24849 Pennington Ter, Venice, FL 34293
$-962
Cash flow
-11.7%
Cash-on-Cash Return
3.5%
Cap rate
0.7%
Rent to Value Ratio
Active
$539,900
3
bds
|
3
ba
|
2,014
sqft
|
built
2018
1600 Still River Dr, Venice, FL 34293
$-1,245
Cash flow
-12.0%
Cash-on-Cash Return
3.4%
Cap rate
0.6%
Rent to Value Ratio
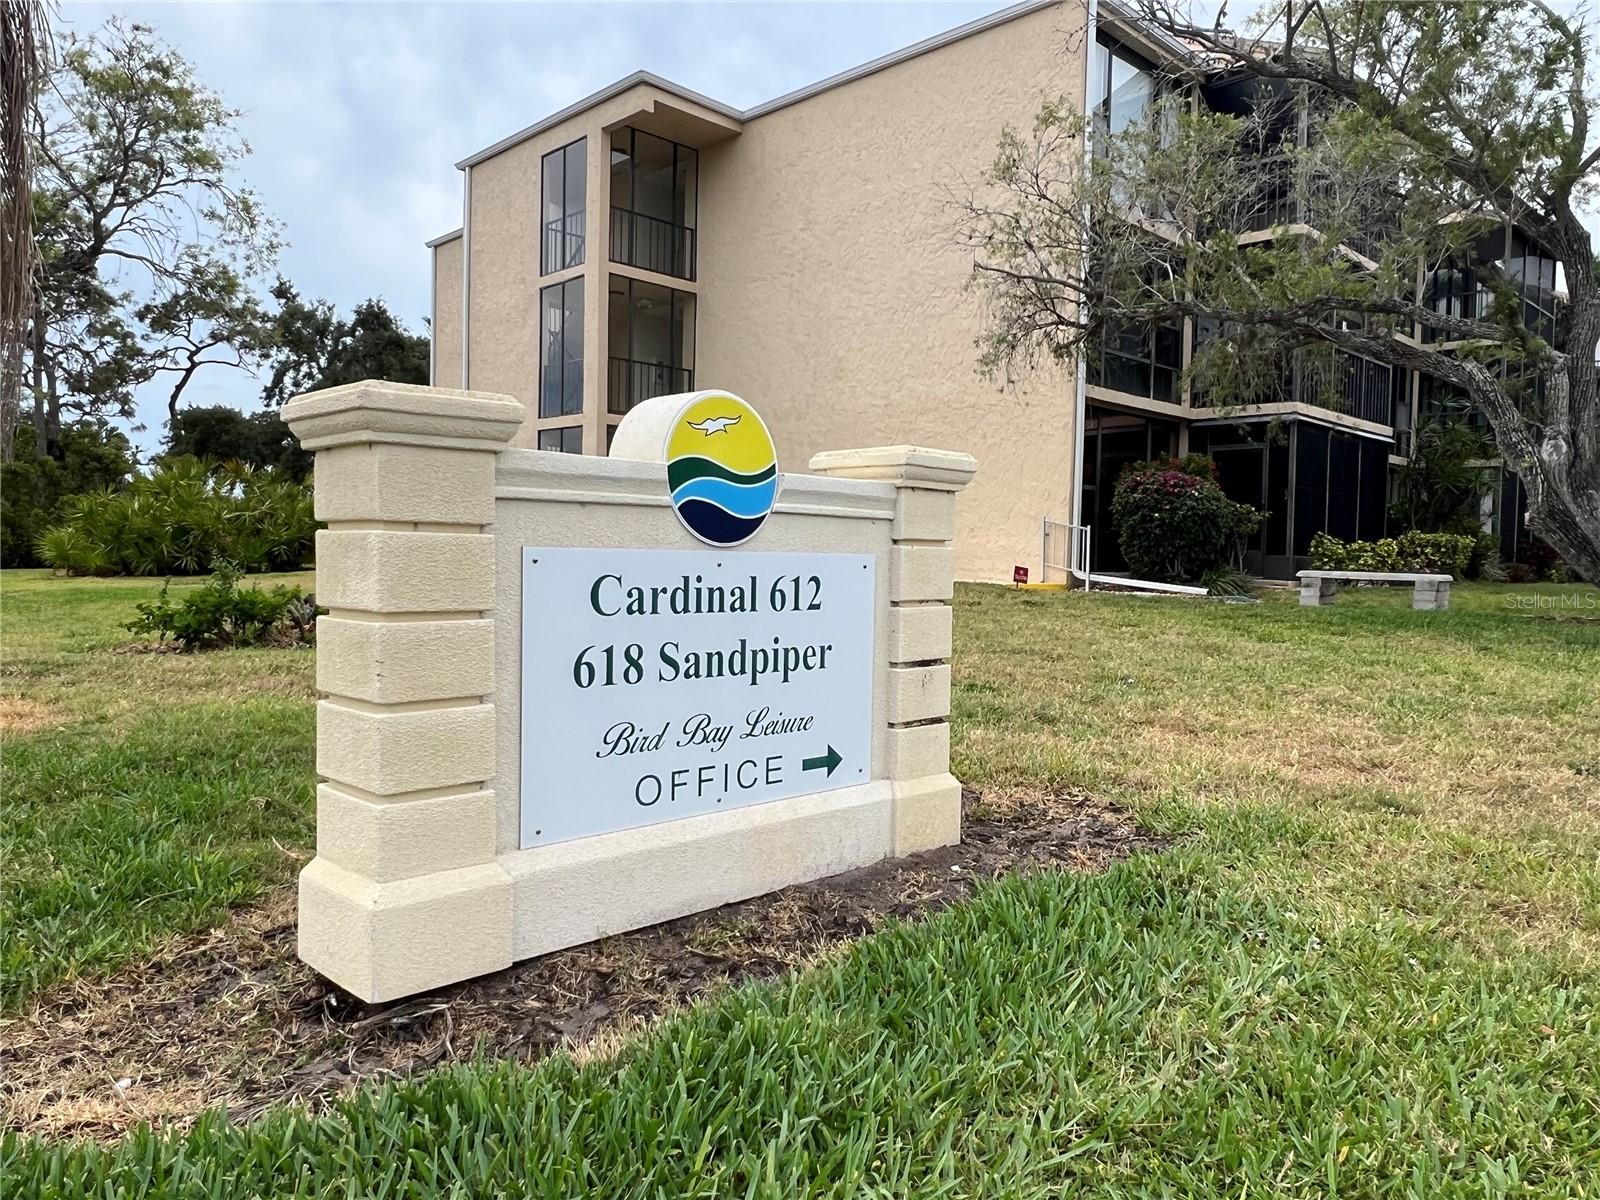
Active
$179,000
2
bds
|
2
ba
|
940
sqft
|
built
1976
612 Bird Bay Dr S, Venice, FL 34285
$137
Cash flow
4.0%
Cash-on-Cash Return
7.1%
Cap rate
1.0%
Rent to Value Ratio
Active
$309,999
2
bds
|
1
ba
|
1,458
sqft
|
built
1974
1790 Pomelo Dr, Venice, FL 34293
$-332
Cash flow
-5.6%
Cash-on-Cash Return
4.9%
Cap rate
0.7%
Rent to Value Ratio
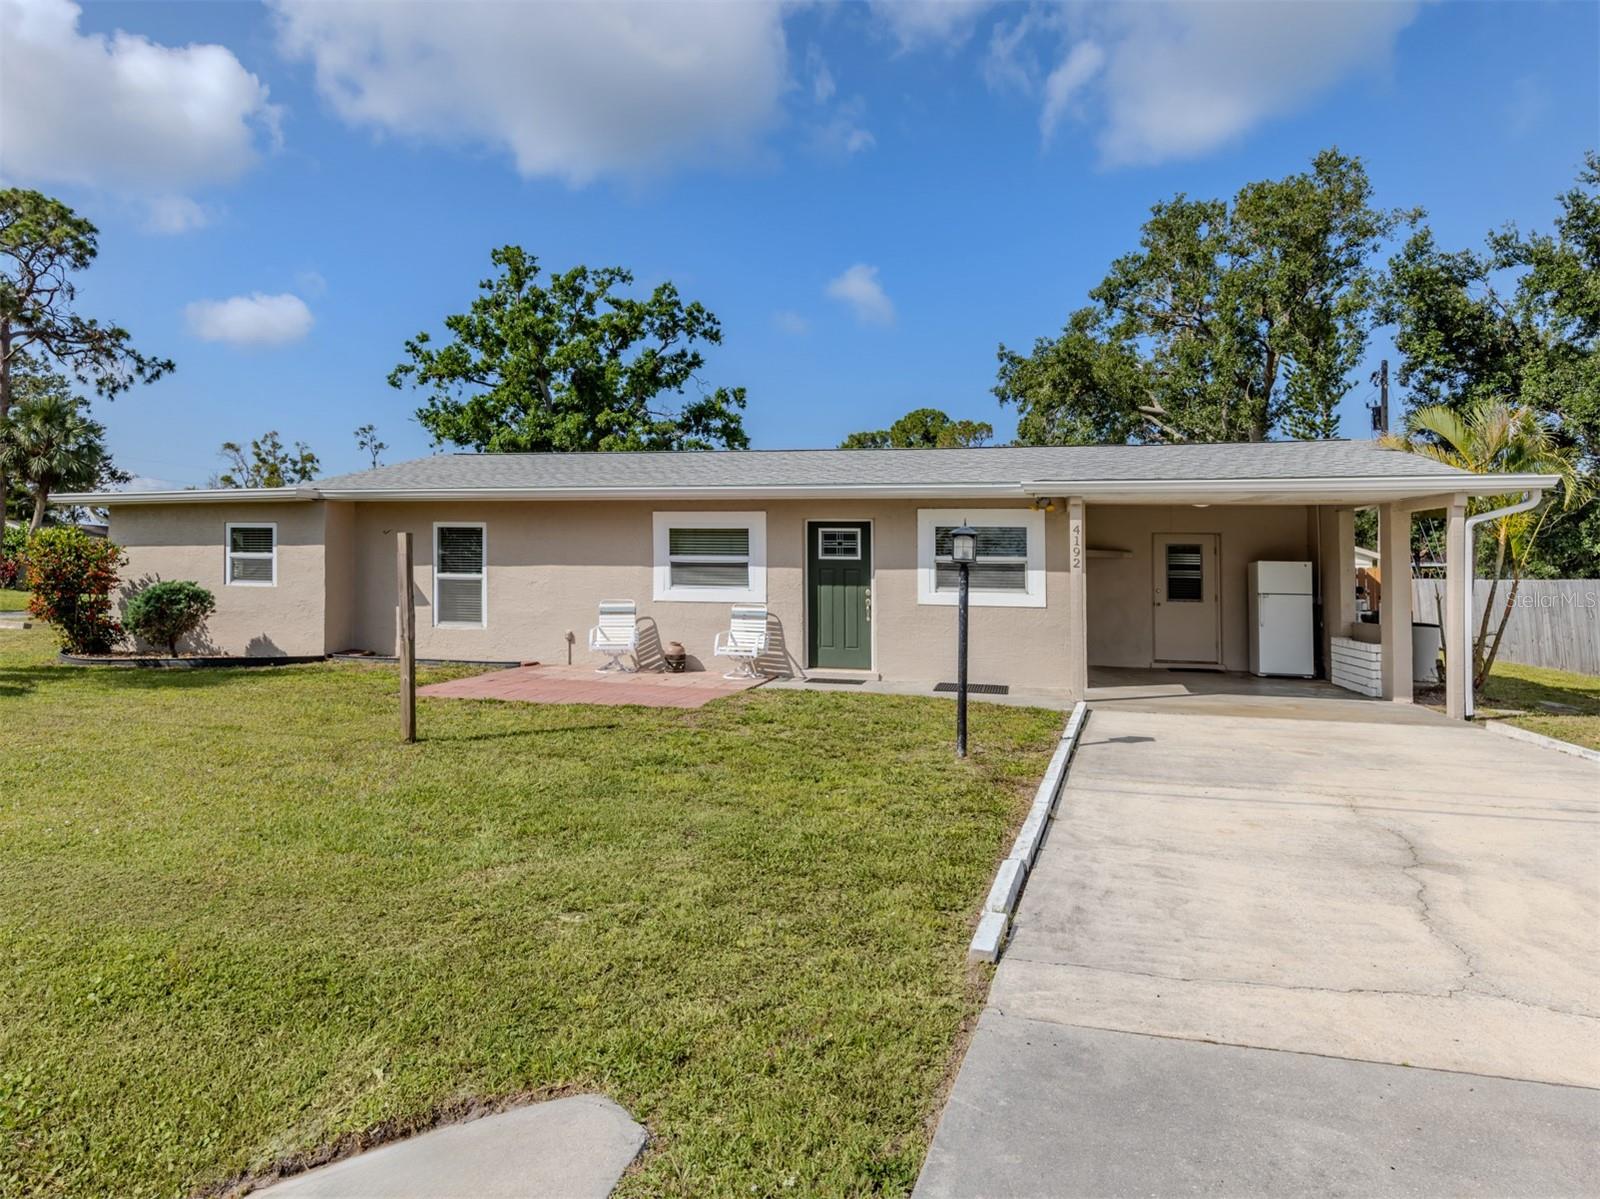
Active
$275,000
2
bds
|
2
ba
|
864
sqft
|
built
1957
4192 Tarpon Rd, Venice, FL 34293
$-109
Cash flow
-2.1%
Cash-on-Cash Return
5.7%
Cap rate
0.7%
Rent to Value Ratio
Active
$575,000
3
bds
|
2
ba
|
2,222
sqft
|
built
2004
1311 Tuscany Blvd, Venice, FL 34292
$-1,383
Cash flow
-12.5%
Cash-on-Cash Return
3.3%
Cap rate
0.6%
Rent to Value Ratio

Active
$605,000
2
bds
|
2
ba
|
1,965
sqft
|
built
2015
13873 Karina St, Venice, FL 34293
$-1,558
Cash flow
-13.4%
Cash-on-Cash Return
3.1%
Cap rate
0.6%
Rent to Value Ratio
Active
$1,450,000
4
bds
|
4
ba
|
2,370
sqft
|
built
1956
401 Sunset Dr, Venice, FL 34285
$-5,063
Cash flow
-18.2%
Cash-on-Cash Return
2.0%
Cap rate
0.3%
Rent to Value Ratio
Active
$674,900
3
bds
|
2
ba
|
2,513
sqft
|
built
1993
431 Fieldstone Dr, Venice, FL 34292
$-1,548
Cash flow
-12.0%
Cash-on-Cash Return
3.4%
Cap rate
0.5%
Rent to Value Ratio
Active
$598,000
3
bds
|
3
ba
|
3,334
sqft
|
built
1989
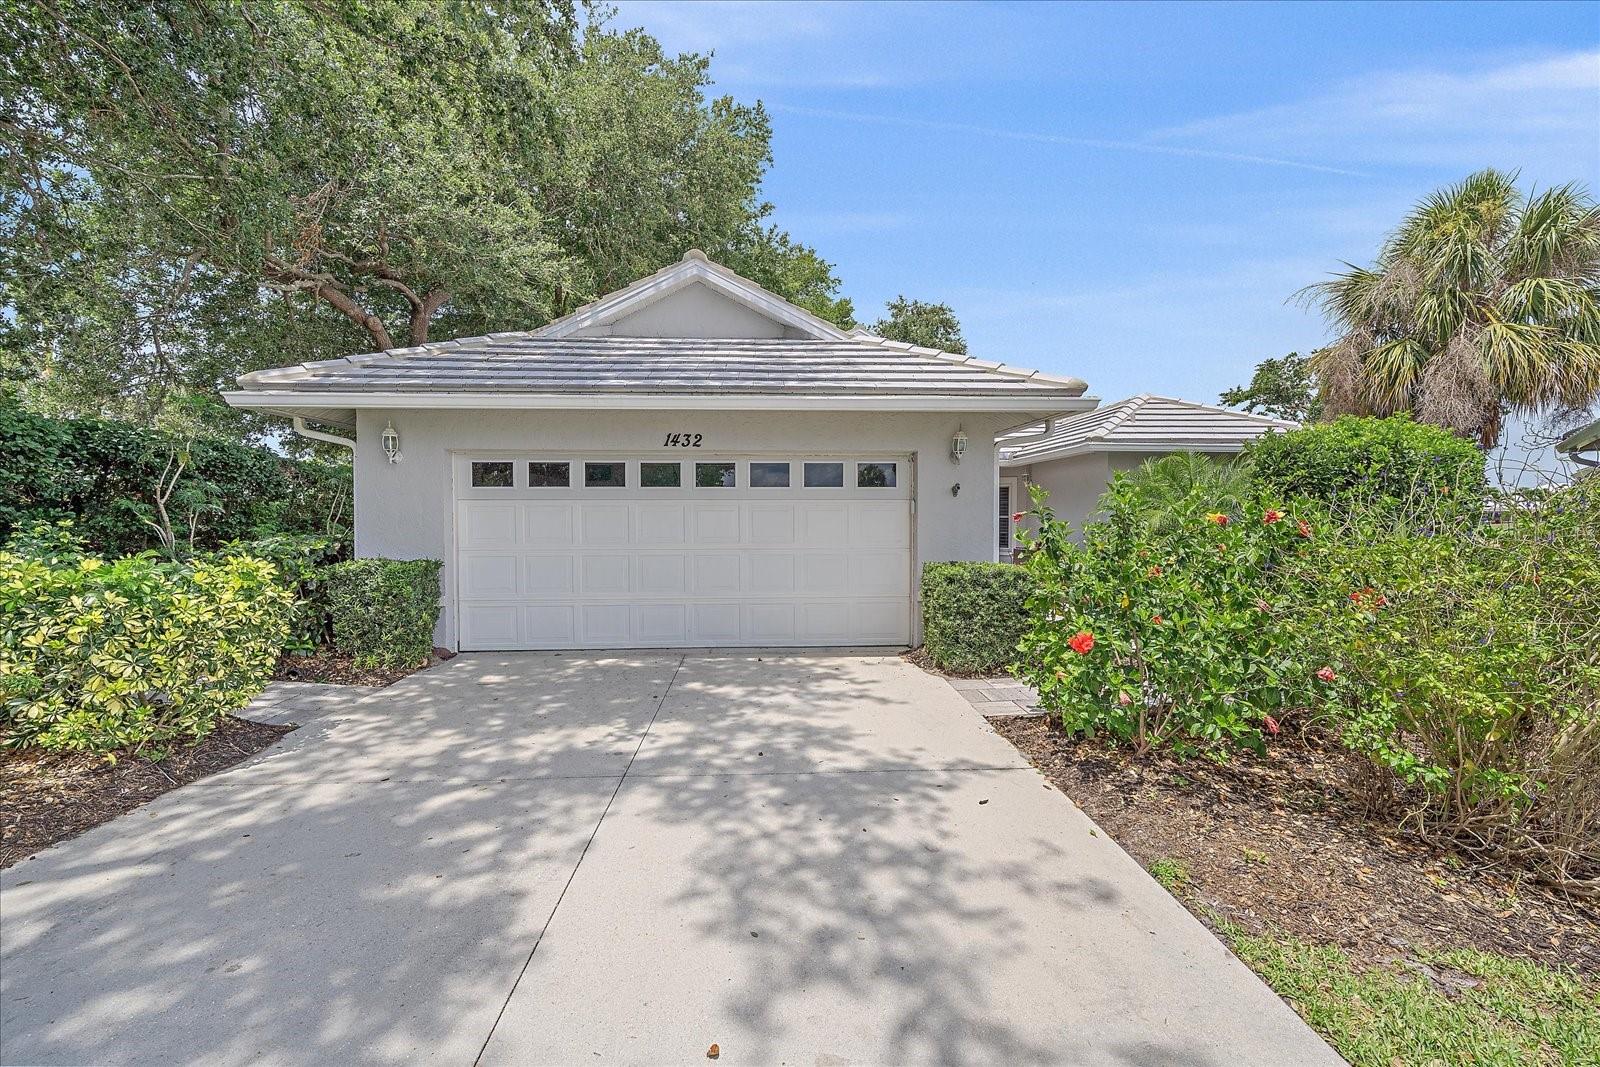
1432 Colony Pl, Venice, FL 34292
$-1,353
Cash flow
-11.8%
Cash-on-Cash Return
3.4%
Cap rate
0.7%
Rent to Value Ratio
Active
$285,000
3
bds
|
2
ba
|
1,767
sqft
|
built
1990
1271 Nantucket Rd, Venice, FL 34293
$-175
Cash flow
-3.2%
Cash-on-Cash Return
5.4%
Cap rate
0.8%
Rent to Value Ratio
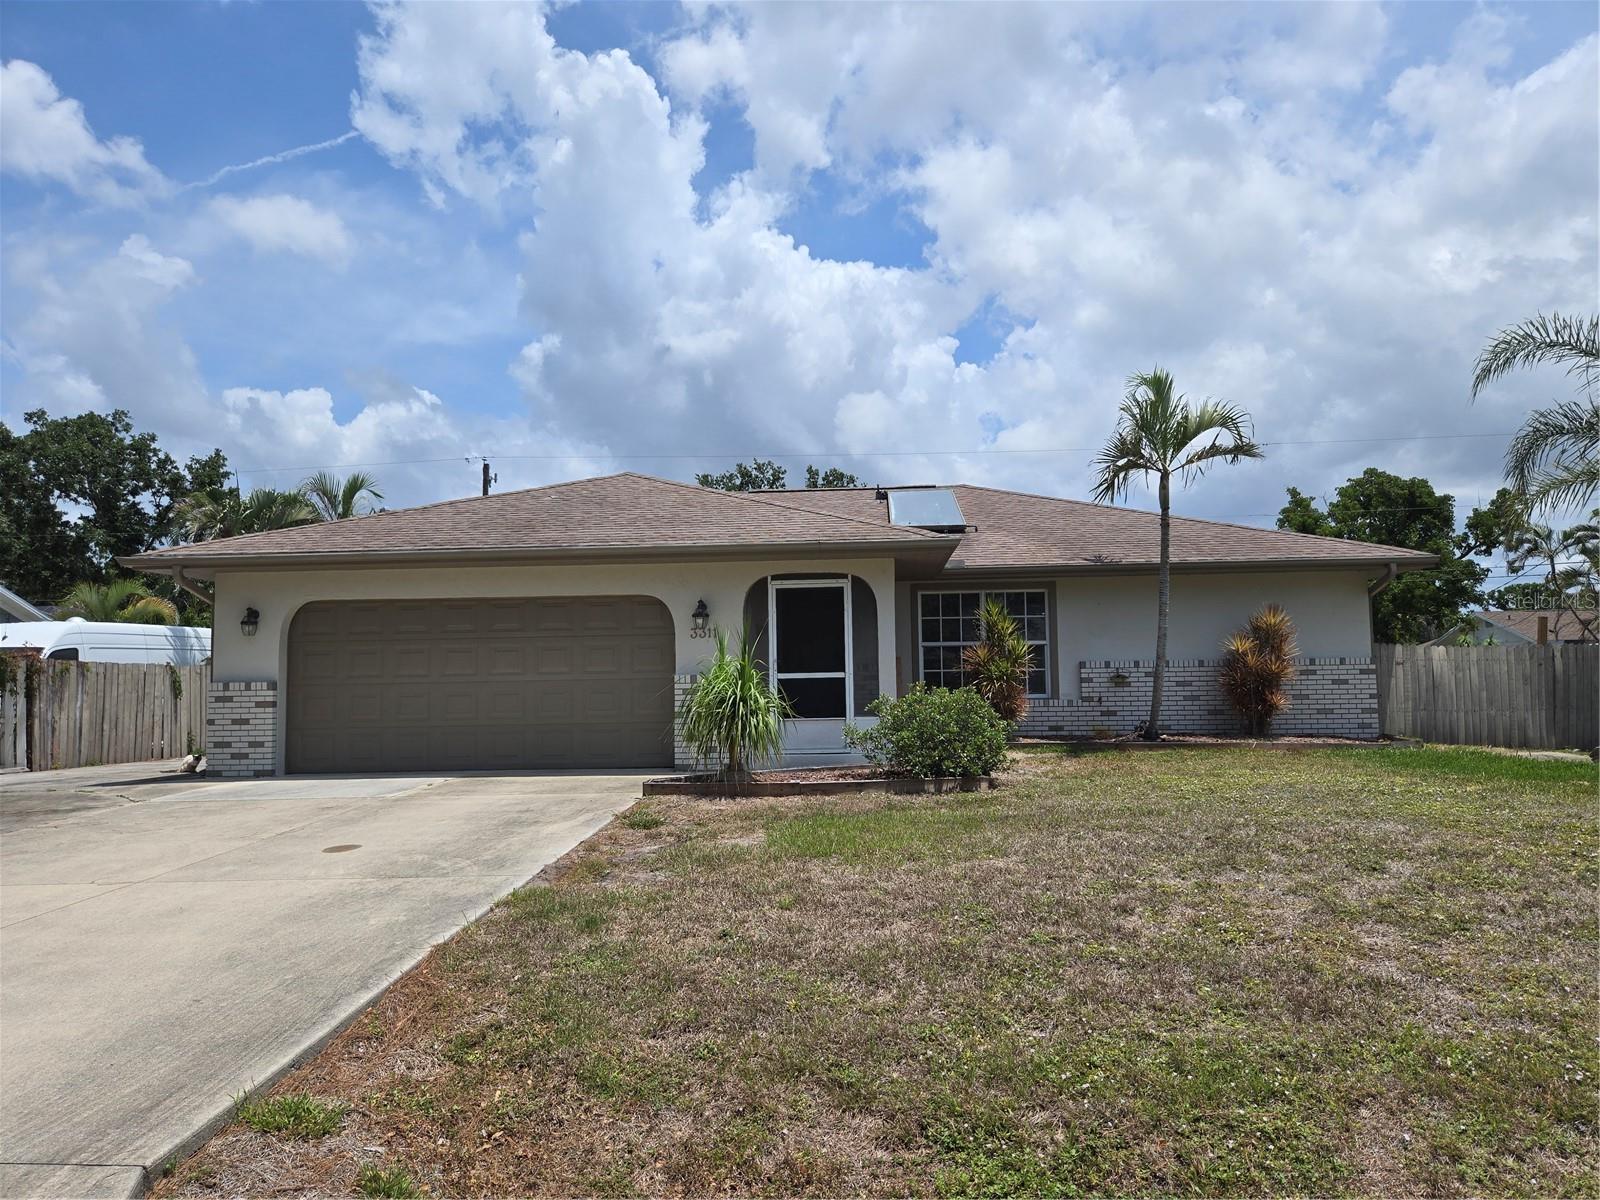
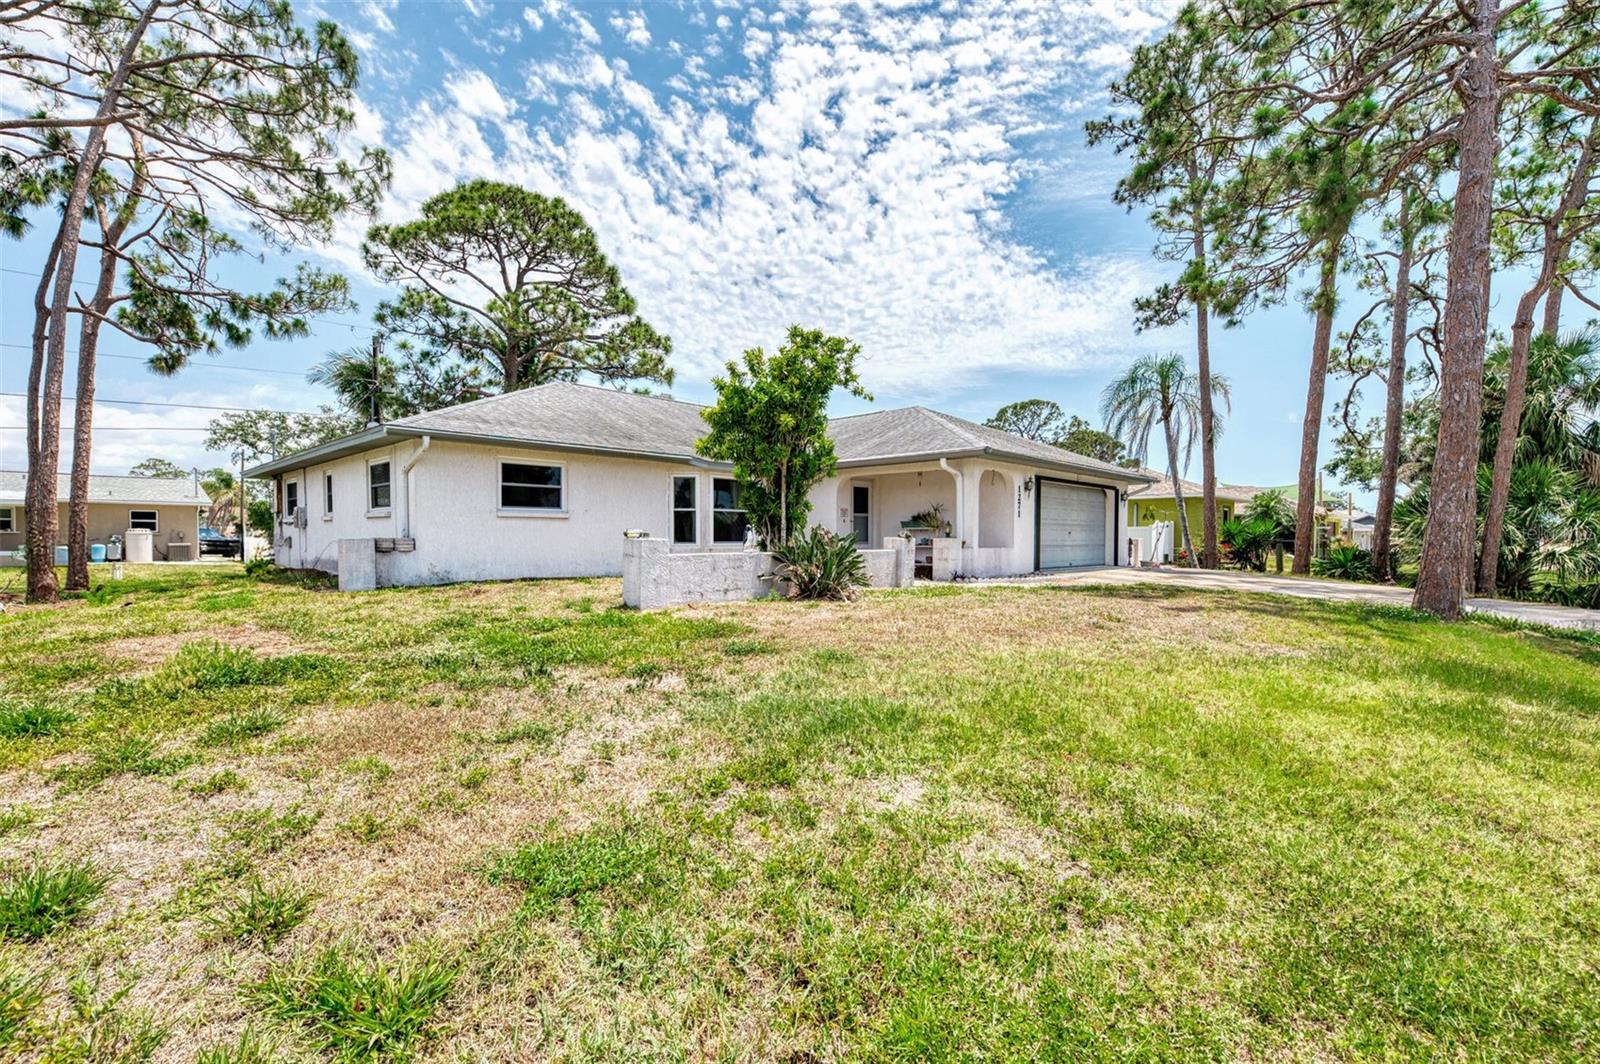
Pending
$319,000
2
bds
|
2
ba
|
1,328
sqft
|
built
1989
3311 Papaya Rd, Venice, FL 34293
$-278
Cash flow
-4.5%
Cash-on-Cash Return
5.1%
Cap rate
0.7%
Rent to Value Ratio
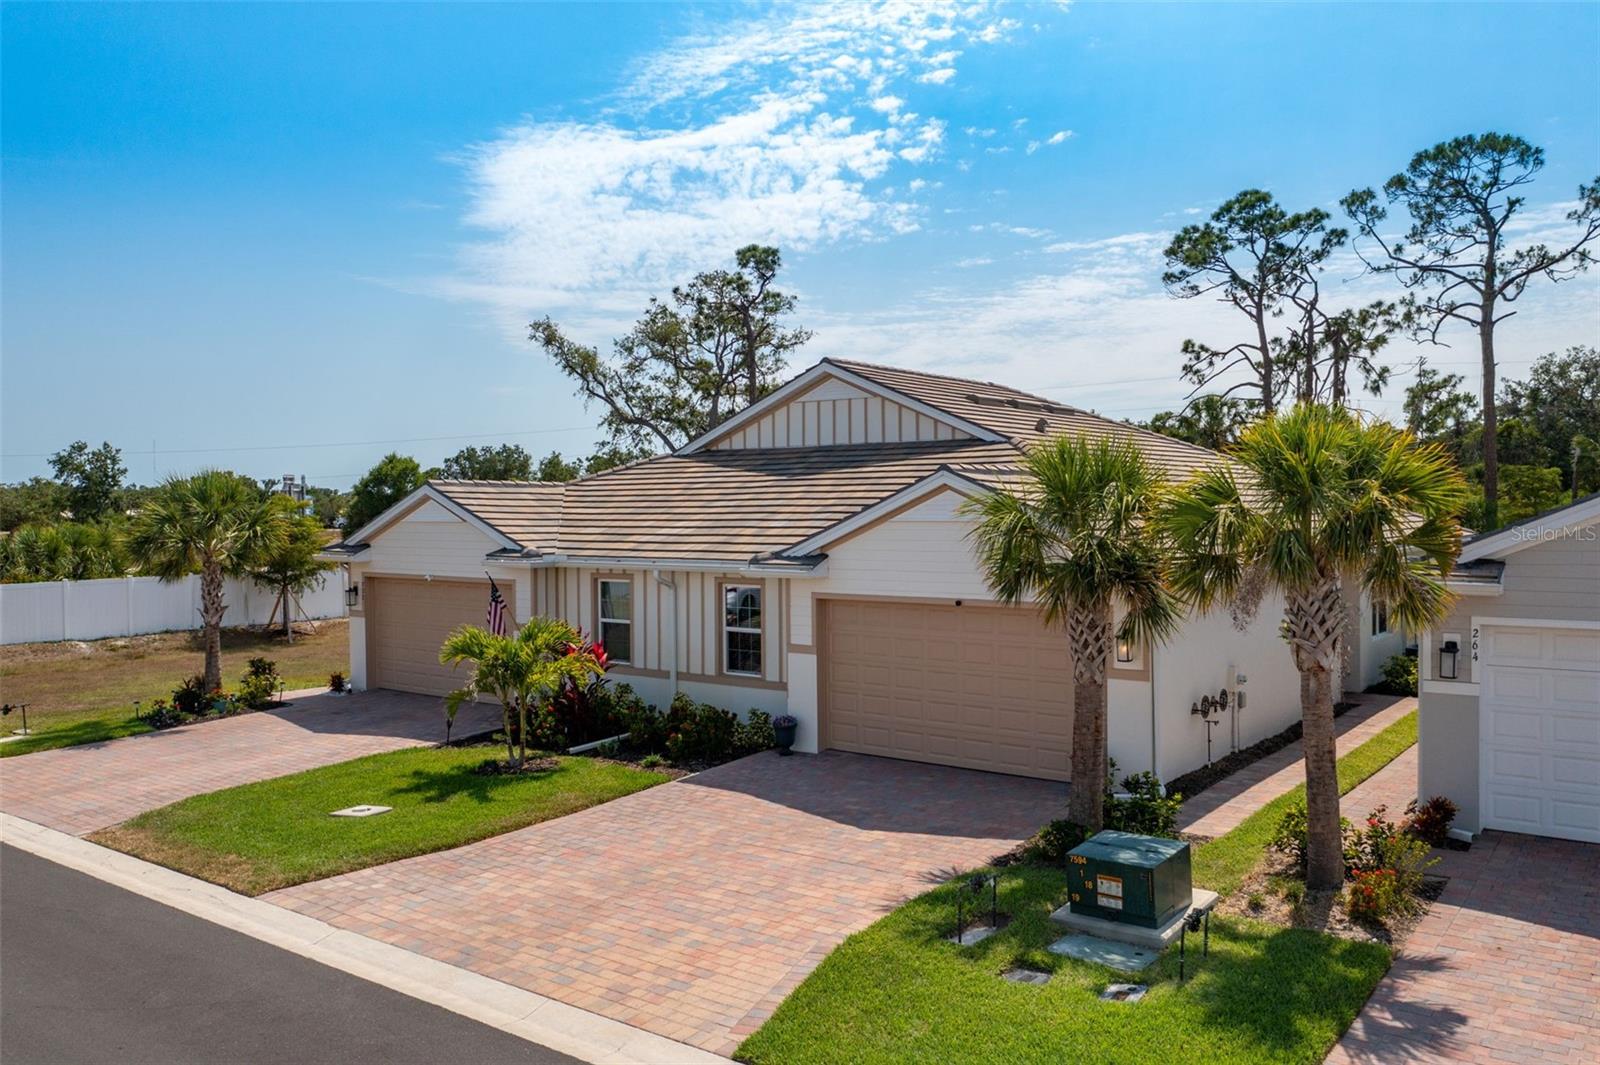
Active
$375,000
2
bds
|
2
ba
|
1,496
sqft
|
built
2023
268 Ibiza Loop, Venice, FL 34292
$-1,113
Cash flow
-15.5%
Cash-on-Cash Return
2.6%
Cap rate
0.6%
Rent to Value Ratio
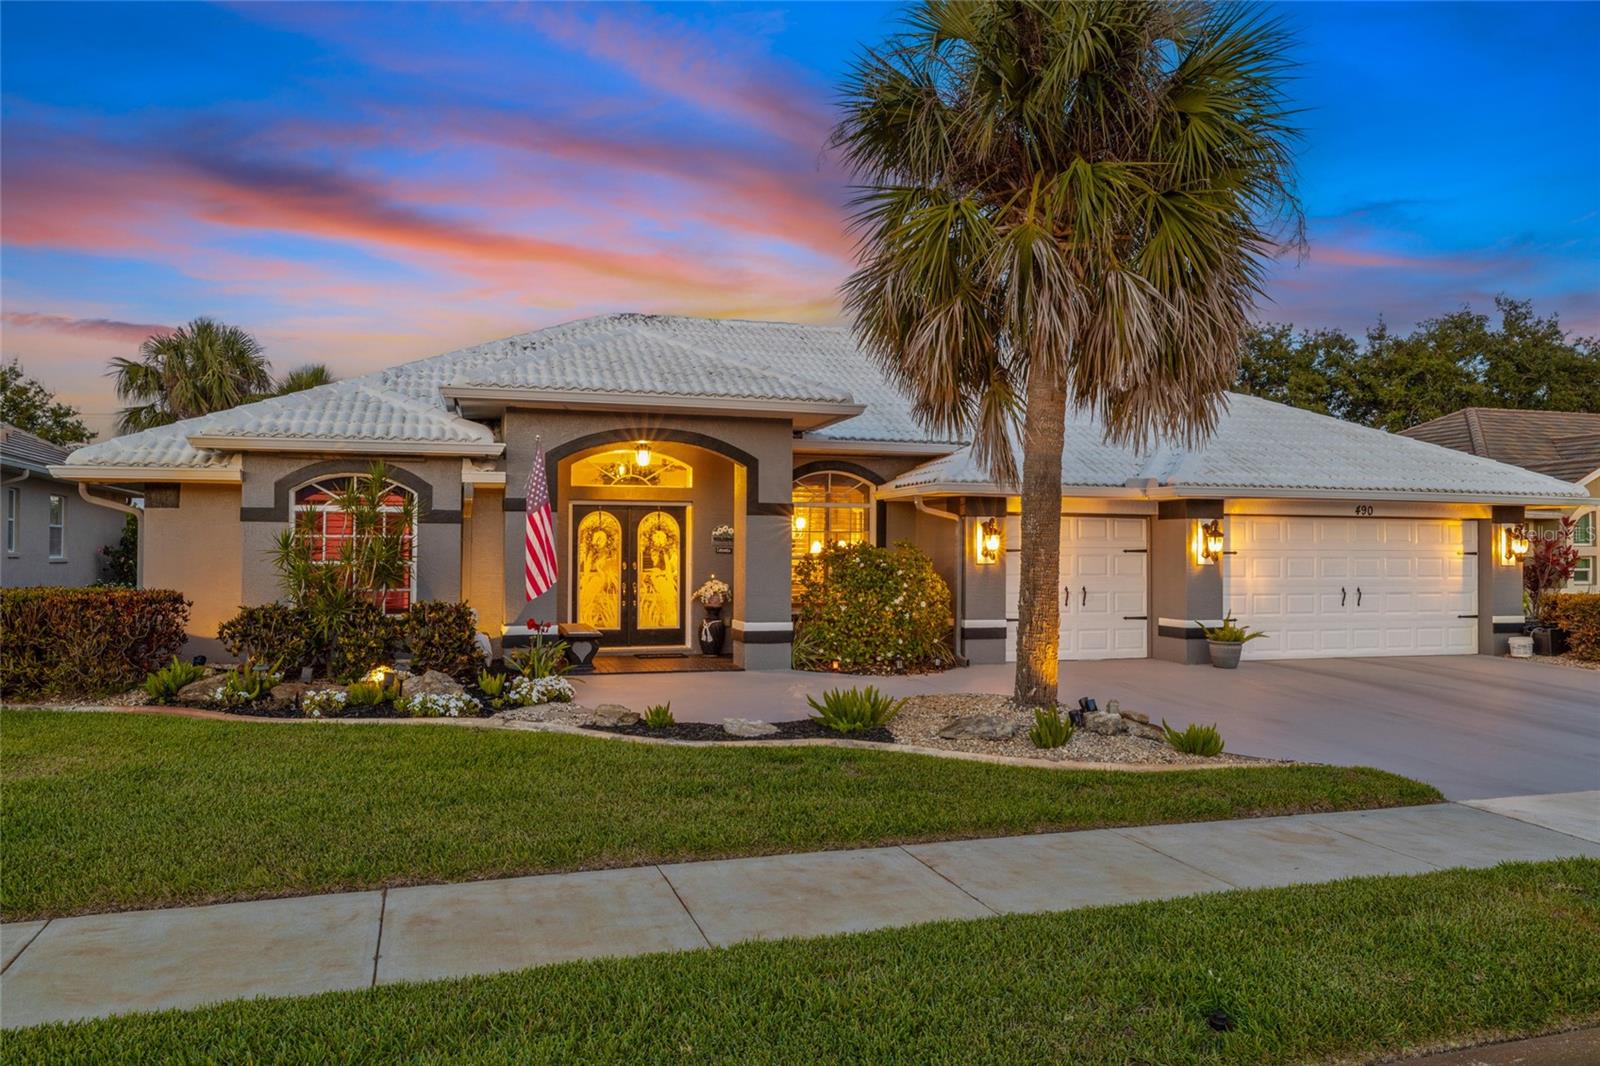
Active
$700,000
3
bds
|
2
ba
|
2,278
sqft
|
built
1995
490 Pine Lily Way, Venice, FL 34293
$-1,545
Cash flow
-11.5%
Cash-on-Cash Return
3.5%
Cap rate
0.5%
Rent to Value Ratio
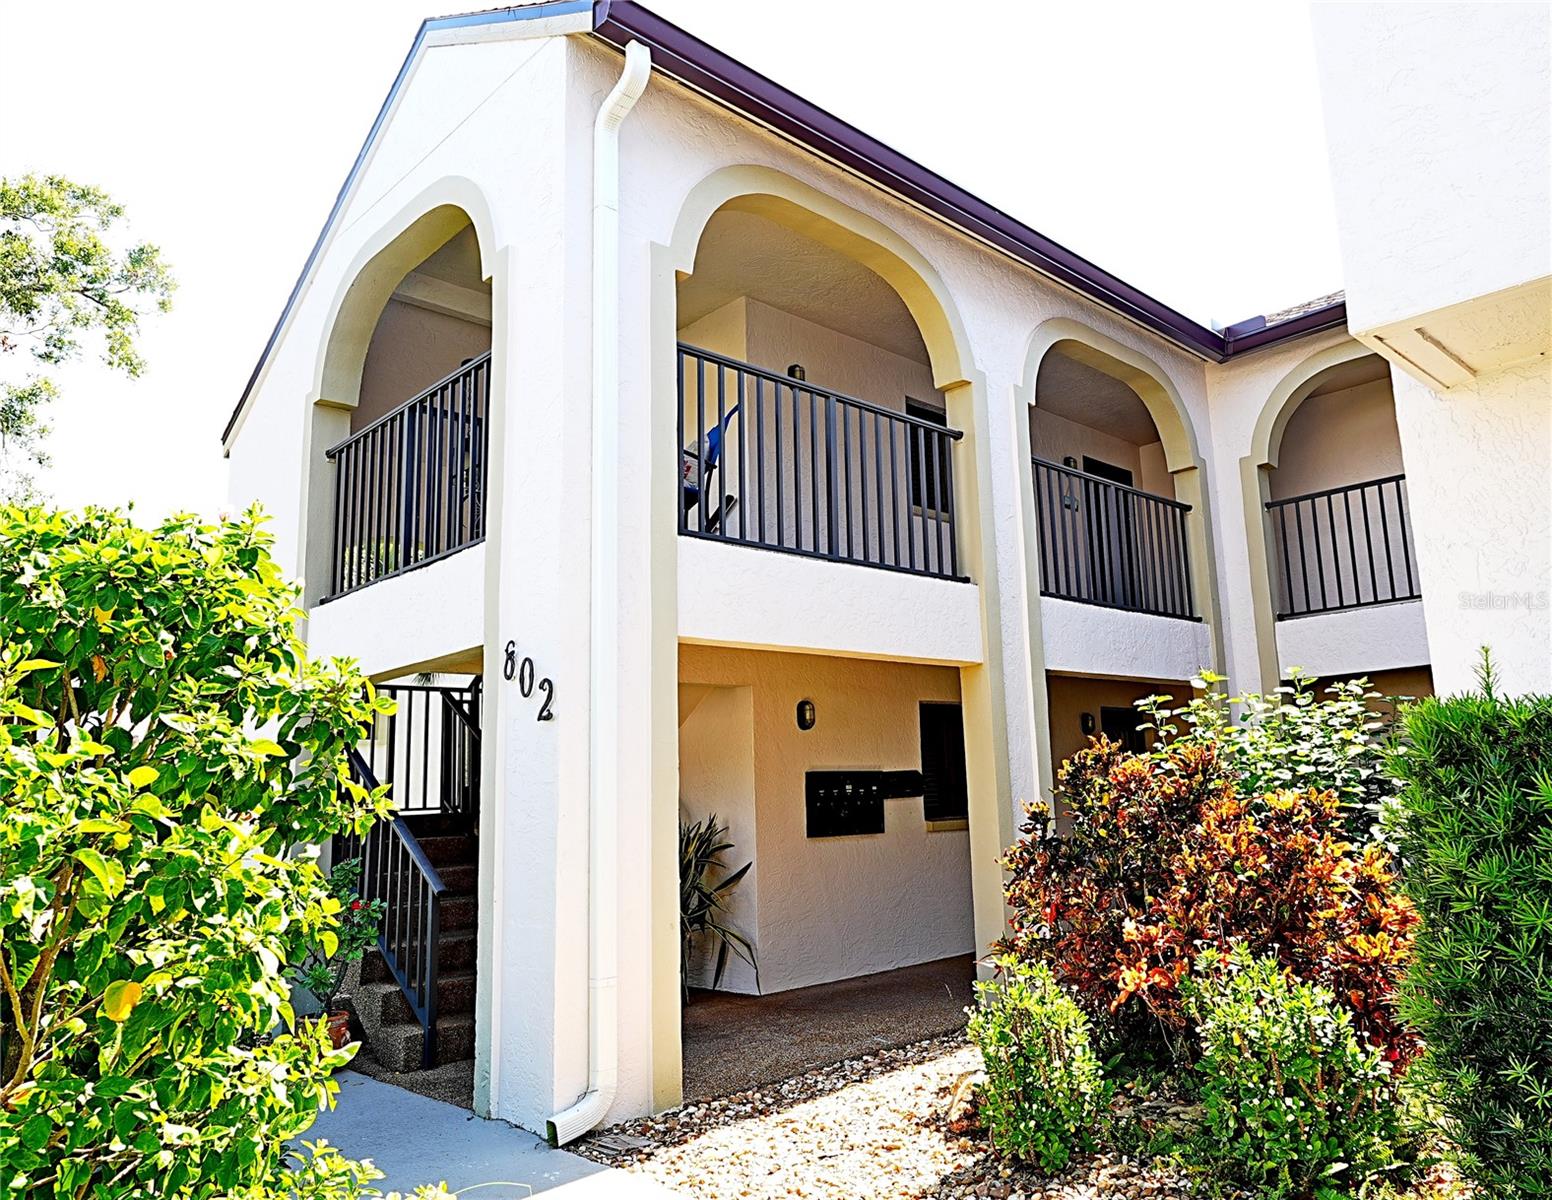
Active
$279,000
2
bds
|
2
ba
|
1,310
sqft
|
built
1988
802 Capri Isles Blvd, Venice, FL 34292
$-692
Cash flow
-12.9%
Cash-on-Cash Return
3.2%
Cap rate
0.8%
Rent to Value Ratio
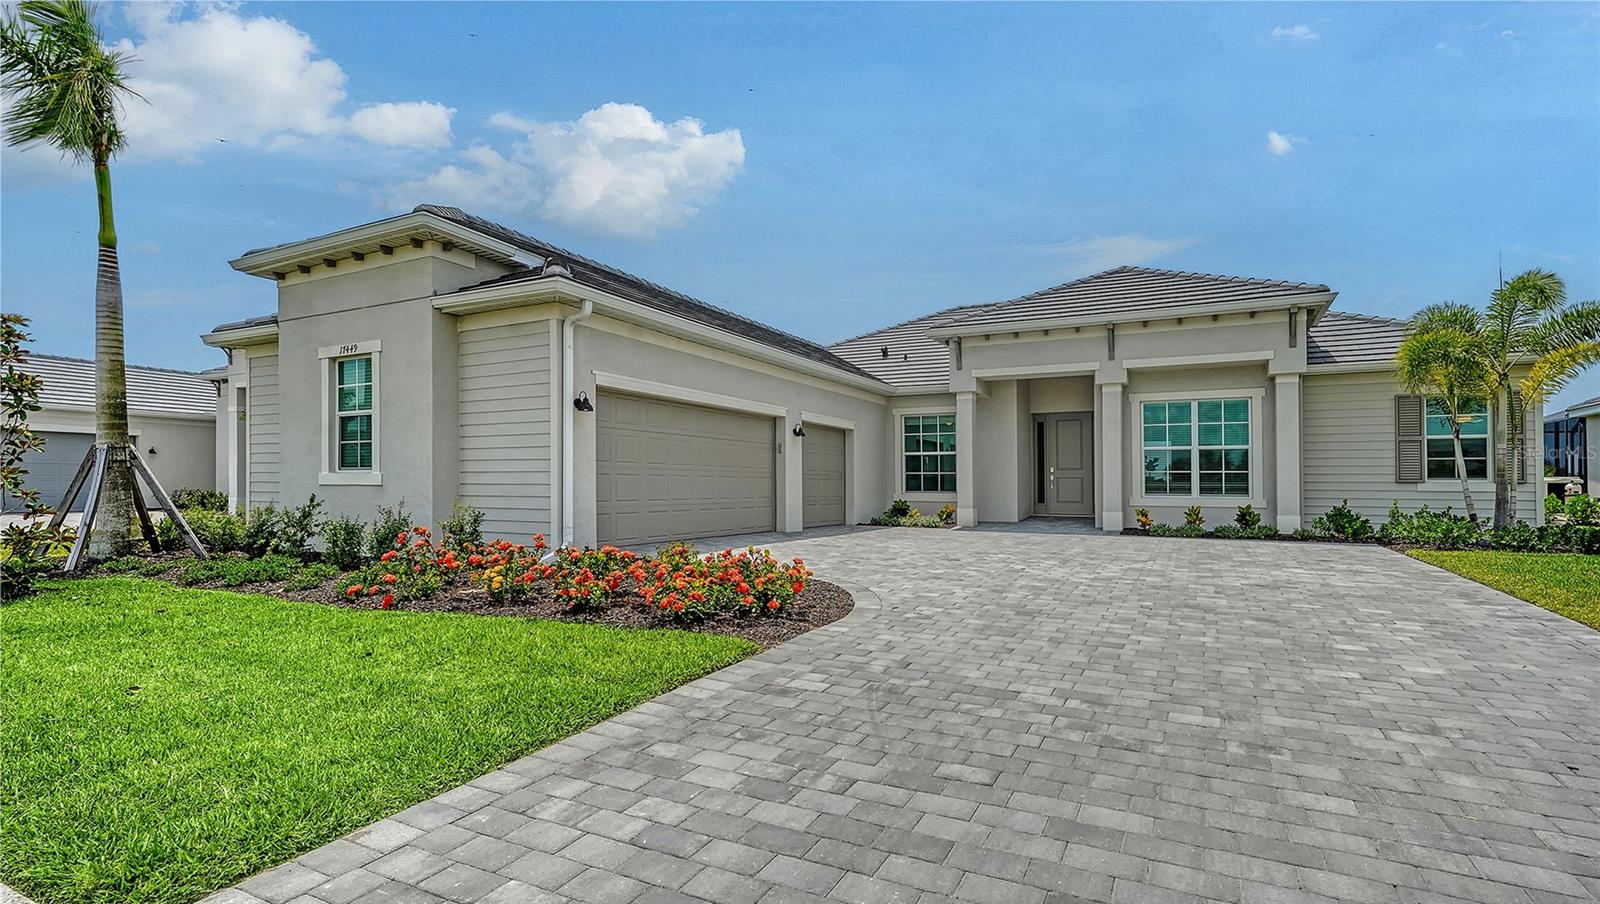
Active
$795,000
3
bds
|
3
ba
|
2,402
sqft
|
built
2024
17449 Sandpearl Rd, Venice, FL 34293
$-2,761
Cash flow
-18.1%
Cash-on-Cash Return
2.0%
Cap rate
0.5%
Rent to Value Ratio