West Palm Beach, FL Investment Properties for Sale
Browse homes for sale and investment properties in West Palm Beach, FL. Refine your search by price, property type, or more.
Best cash flowing properties in West Palm Beach, FL
Active
$185,000
2
bds
|
2
ba
|
798
sqft
|
built
1985
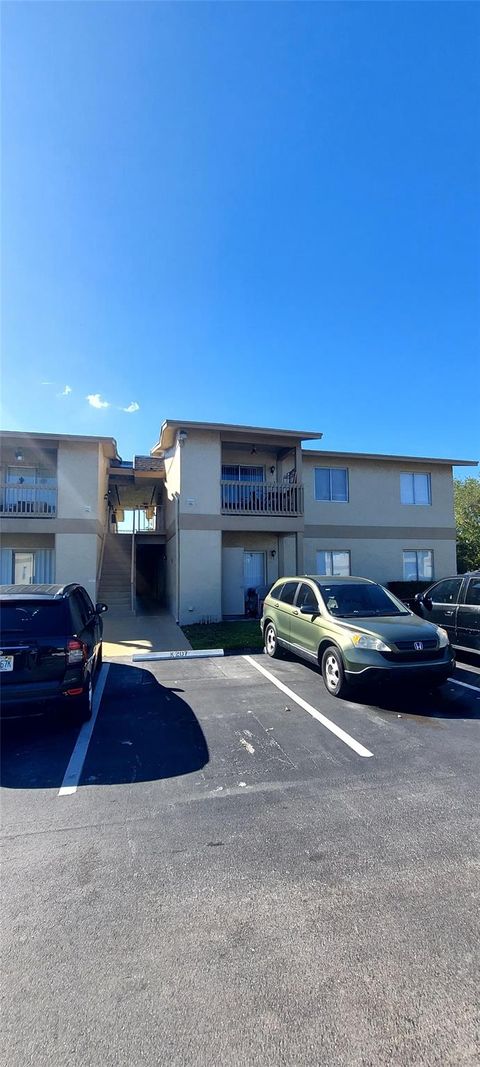
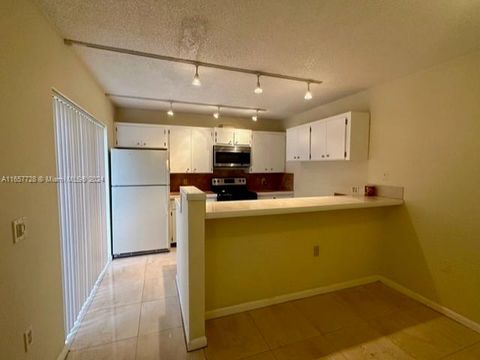
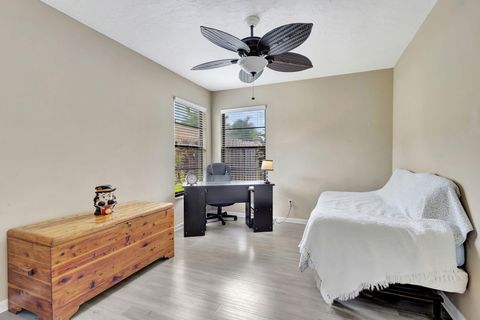
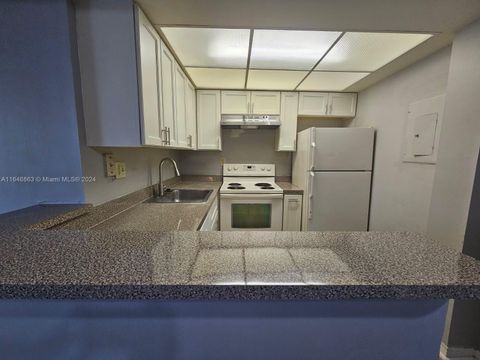
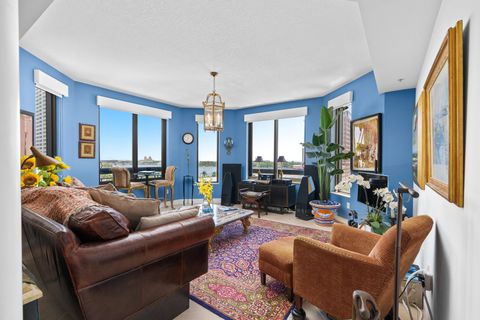
1838 Abbey Rd, West Palm Beach, FL 33415
$-275
Cash flow
-7.8%
Cash-on-Cash Return
4.4%
Cap rate
1.0%
Rent to Value Ratio
Active
$620,000
4
bds
|
2
ba
|
1,799
sqft
|
built
1968
2301 Edgewater Dr, West Palm Beach, FL 33406
$-342
Cash flow
-2.9%
Cash-on-Cash Return
5.5%
Cap rate
0.8%
Rent to Value Ratio
1,354 out of 1,463 properties for sale in West Palm Beach, FL
Limited Results Shown
Create a free account, or log in to reveal all property listings and enjoy the complete experience.
Active
$710,000
4
bds
|
3
ba
|
2,084
sqft
|
built
2005
4576 Thornwood Cir, West Palm Beach, FL 33418
$-1,349
Cash flow
-9.9%
Cash-on-Cash Return
3.9%
Cap rate
0.6%
Rent to Value Ratio
Active
$349,000
2
bds
|
2
ba
|
1,170
sqft
|
built
1978
5600 N Flagler Dr, West Palm Beach, FL 33407
$-1,621
Cash flow
-24.2%
Cash-on-Cash Return
0.6%
Cap rate
0.8%
Rent to Value Ratio

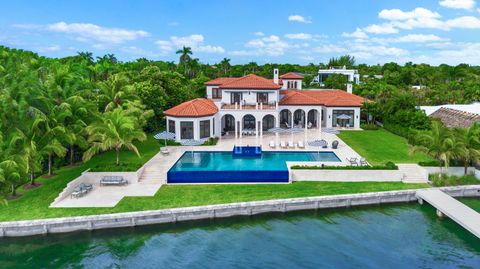
Active
$9,800,000
6
bds
|
7
ba
|
5,282
sqft
|
built
1925
221 Monroe Dr, West Palm Beach, FL 33405
$-47,561
Cash flow
-25.3%
Cash-on-Cash Return
0.3%
Cap rate
0.1%
Rent to Value Ratio

Active
$299,000
3
bds
|
3
ba
|
1,510
sqft
|
built
1989
3204 Glenmoor Dr, West Palm Beach, FL 33409
$-862
Cash flow
-15.0%
Cash-on-Cash Return
2.7%
Cap rate
0.8%
Rent to Value Ratio
Active
$349,000
1
bds
|
1
ba
|
762
sqft
|
built
2006
600 S Dixie Hwy, West Palm Beach, FL 33401
$-1,499
Cash flow
-22.4%
Cash-on-Cash Return
1.0%
Cap rate
0.6%
Rent to Value Ratio
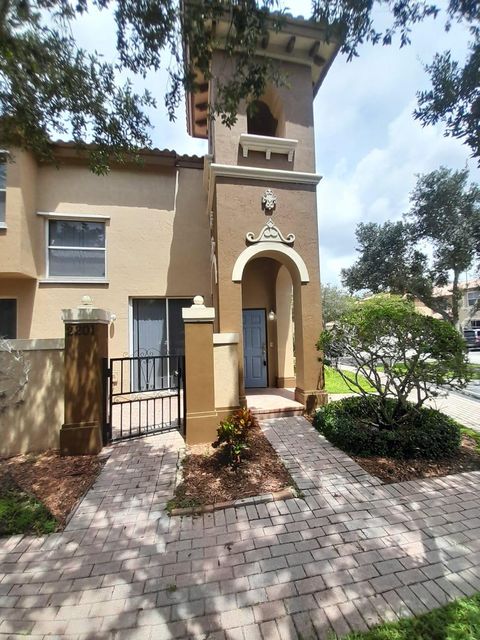
Active under contract
$749,000
2
bds
|
2
ba
|
1,208
sqft
|
built
2008
701 S Olive Ave, West Palm Beach, FL 33401
$-2,584
Cash flow
-18.0%
Cash-on-Cash Return
2.0%
Cap rate
0.7%
Rent to Value Ratio
Active
$847,000
2
bds
|
2
ba
|
1,170
sqft
|
built
2008
701 S Olive Ave, West Palm Beach, FL 33401
$-2,836
Cash flow
-17.5%
Cash-on-Cash Return
2.1%
Cap rate
0.6%
Rent to Value Ratio
Active
$435,000
2
bds
|
2
ba
|
1,171
sqft
|
built
2006
403 S Sapodilla Ave, West Palm Beach, FL 33401
$-2,167
Cash flow
-26.0%
Cash-on-Cash Return
0.2%
Cap rate
0.7%
Rent to Value Ratio
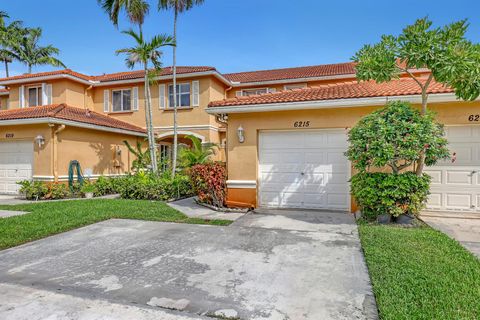
Active
$365,000
2
bds
|
3
ba
|
1,322
sqft
|
built
2002
6215 Eaton St, West Palm Beach, FL 33411
$-598
Cash flow
-8.5%
Cash-on-Cash Return
4.2%
Cap rate
0.8%
Rent to Value Ratio

Active
$420,000
4
bds
|
4
ba
|
2,285
sqft
|
built
2006
430 Amador Ln, West Palm Beach, FL 33401
$-733
Cash flow
-9.1%
Cash-on-Cash Return
4.1%
Cap rate
1.0%
Rent to Value Ratio

Active
$575,000
3
bds
|
2
ba
|
2,124
sqft
|
built
1954
2322 S Haverhill Rd, West Palm Beach, FL 33415
$-1,289
Cash flow
-11.7%
Cash-on-Cash Return
3.5%
Cap rate
0.5%
Rent to Value Ratio
Active
$620,000
4
bds
|
2
ba
|
1,799
sqft
|
built
1968
2301 Edgewater Dr, West Palm Beach, FL 33406
$-342
Cash flow
-2.9%
Cash-on-Cash Return
5.5%
Cap rate
0.8%
Rent to Value Ratio

Active
$255,000
2
bds
|
1
ba
|
991
sqft
|
built
1984
4709 Sable Pine Cir, West Palm Beach, FL 33417
$-481
Cash flow
-9.8%
Cash-on-Cash Return
3.9%
Cap rate
0.8%
Rent to Value Ratio
Active
$440,000
1
bds
|
1
ba
|
794
sqft
|
built
2008
550 Okeechobee Blvd, West Palm Beach, FL 33401
$-1,342
Cash flow
-15.9%
Cash-on-Cash Return
2.5%
Cap rate
0.6%
Rent to Value Ratio
Active
$185,000
2
bds
|
2
ba
|
798
sqft
|
built
1985
1838 Abbey Rd, West Palm Beach, FL 33415
$-275
Cash flow
-7.8%
Cash-on-Cash Return
4.4%
Cap rate
1.0%
Rent to Value Ratio
Active
$290,000
2
bds
|
3
ba
|
1,236
sqft
|
built
1985
5040 50th Way, West Palm Beach, FL 33409
$-630
Cash flow
-11.3%
Cash-on-Cash Return
3.5%
Cap rate
0.8%
Rent to Value Ratio
Active
$669,000
3
bds
|
2
ba
|
2,014
sqft
|
built
1987
1120 Sand Drift Way, West Palm Beach, FL 33411
$-2,235
Cash flow
-17.4%
Cash-on-Cash Return
2.1%
Cap rate
0.6%
Rent to Value Ratio
Active
$213,000
2
bds
|
2
ba
|
1,104
sqft
|
built
1985
1111 Green Pine Blvd, West Palm Beach, FL 33409
$-475
Cash flow
-11.6%
Cash-on-Cash Return
3.5%
Cap rate
0.9%
Rent to Value Ratio

Active
$899,000
2
bds
|
2
ba
|
1,086
sqft
|
built
1973
1801 S Flagler Dr, West Palm Beach, FL 33401
$-2,982
Cash flow
-17.3%
Cash-on-Cash Return
2.2%
Cap rate
0.6%
Rent to Value Ratio

Active
$1,595,000
3
bds
|
4
ba
|
1,826
sqft
|
built
2004
307 Flamingo Dr, West Palm Beach, FL 33401
$-3,626
Cash flow
-11.9%
Cash-on-Cash Return
3.4%
Cap rate
0.6%
Rent to Value Ratio
Active
$499,900
2
bds
|
1
ba
|
1,320
sqft
|
built
1950
504 51st St, West Palm Beach, FL 33407
$-1,154
Cash flow
-12.0%
Cash-on-Cash Return
3.4%
Cap rate
0.6%
Rent to Value Ratio

Active
$440,000
4
bds
|
2
ba
|
1,404
sqft
|
built
1959
1315 7th St, West Palm Beach, FL 33401
$-354
Cash flow
-4.2%
Cash-on-Cash Return
5.2%
Cap rate
0.8%
Rent to Value Ratio
Active
$990,000
2
bds
|
2
ba
|
1,350
sqft
|
built
1973
1701 S Flagler Dr, West Palm Beach, FL 33401
$-2,802
Cash flow
-14.8%
Cash-on-Cash Return
2.8%
Cap rate
0.7%
Rent to Value Ratio
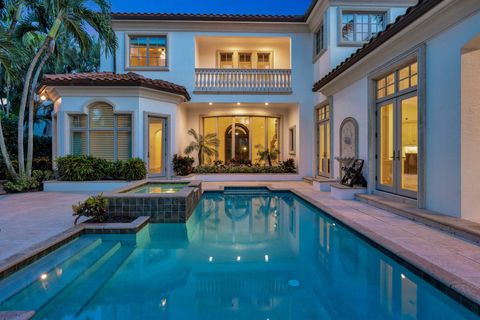
Pending
$8,750,000
4
bds
|
6
ba
|
5,190
sqft
|
built
2007
13058 Flamingo Ter, West Palm Beach, FL 33410
$-42,630
Cash flow
-25.4%
Cash-on-Cash Return
0.3%
Cap rate
0.1%
Rent to Value Ratio
Active
$272,000
2
bds
|
3
ba
|
1,236
sqft
|
built
1984
2610 26th Way, West Palm Beach, FL 33407
$-1,091
Cash flow
-20.9%
Cash-on-Cash Return
1.3%
Cap rate
0.7%
Rent to Value Ratio
Active
$37,500,000
7
bds
|
9
ba
|
13,063
sqft
|
built
2010
3400 N Flagler Dr, West Palm Beach, FL 33407
$-202,554
Cash flow
-28.2%
Cash-on-Cash Return
-0.3%
Cap rate
0.0%
Rent to Value Ratio
Active
$305,900
3
bds
|
3
ba
|
1,396
sqft
|
built
2006
2905 Hidden Hills Rd, West Palm Beach, FL 33411
$-813
Cash flow
-13.9%
Cash-on-Cash Return
3.0%
Cap rate
0.8%
Rent to Value Ratio

Active
$2,600,000
4
bds
|
4
ba
|
2,783
sqft
|
built
1926
5801 S Olive Ave, West Palm Beach, FL 33405
$-8,726
Cash flow
-17.5%
Cash-on-Cash Return
2.1%
Cap rate
0.4%
Rent to Value Ratio

Active
$269,000
1
bds
|
1
ba
|
725
sqft
|
built
1974
1830 Embassy Dr, West Palm Beach, FL 33401
$-688
Cash flow
-13.3%
Cash-on-Cash Return
3.1%
Cap rate
0.8%
Rent to Value Ratio
Active
$5,950,000
5
bds
|
6
ba
|
5,421
sqft
|
built
2002
753 Harbour Isle Pl, West Palm Beach, FL 33410
$-30,931
Cash flow
-27.1%
Cash-on-Cash Return
-0.1%
Cap rate
0.2%
Rent to Value Ratio
Active
$287,500
2
bds
|
2
ba
|
1,153
sqft
|
built
1984
4289 Willow Pond Cir, West Palm Beach, FL 33417
$-447
Cash flow
-8.1%
Cash-on-Cash Return
4.3%
Cap rate
0.9%
Rent to Value Ratio
Active
$299,000
2
bds
|
3
ba
|
1,236
sqft
|
built
1984
5643 56th Way, West Palm Beach, FL 33409
$-812
Cash flow
-14.2%
Cash-on-Cash Return
2.9%
Cap rate
0.7%
Rent to Value Ratio
Active
$580,000
1
bds
|
2
ba
|
965
sqft
|
built
1973
1801 S Flagler Dr, West Palm Beach, FL 33401
$-1,684
Cash flow
-15.1%
Cash-on-Cash Return
2.7%
Cap rate
0.7%
Rent to Value Ratio
Active
$475,000
2
bds
|
2
ba
|
1,175
sqft
|
built
2005
1551 N Flagler Dr, West Palm Beach, FL 33401
$-1,712
Cash flow
-18.8%
Cash-on-Cash Return
1.8%
Cap rate
0.7%
Rent to Value Ratio
Active
$185,000
2
bds
|
2
ba
|
728
sqft
|
built
1986
734 Executive Center Dr, West Palm Beach, FL 33401
$-671
Cash flow
-18.9%
Cash-on-Cash Return
1.8%
Cap rate
1.0%
Rent to Value Ratio

Active
$875,000
3
bds
|
3
ba
|
2,406
sqft
|
built
1981
6785 Escondida Dr, West Palm Beach, FL 33406
$-1,162
Cash flow
-6.9%
Cash-on-Cash Return
4.6%
Cap rate
0.7%
Rent to Value Ratio

Active
$479,900
2
bds
|
2
ba
|
1,250
sqft
|
built
1974
5200 N Flagler Dr, West Palm Beach, FL 33407
$-1,967
Cash flow
-21.4%
Cash-on-Cash Return
1.2%
Cap rate
0.8%
Rent to Value Ratio

Active
$539,000
3
bds
|
2
ba
|
2,020
sqft
|
built
1991
10414 Osprey Trce, West Palm Beach, FL 33412
$-937
Cash flow
-9.1%
Cash-on-Cash Return
4.1%
Cap rate
0.8%
Rent to Value Ratio
Active
$2,500,000
3
bds
|
3
ba
|
2,062
sqft
|
built
2006
801 S Olive Ave, West Palm Beach, FL 33401
$-10,456
Cash flow
-21.8%
Cash-on-Cash Return
1.1%
Cap rate
0.3%
Rent to Value Ratio

Active
$459,000
2
bds
|
1
ba
|
741
sqft
|
built
1947
5271 Wallis Rd, West Palm Beach, FL 33415
$-712
Cash flow
-8.1%
Cash-on-Cash Return
4.3%
Cap rate
0.6%
Rent to Value Ratio