Weston, FL Investment Properties for Sale
Browse homes for sale and investment properties in Weston, FL. Refine your search by price, property type, or more.
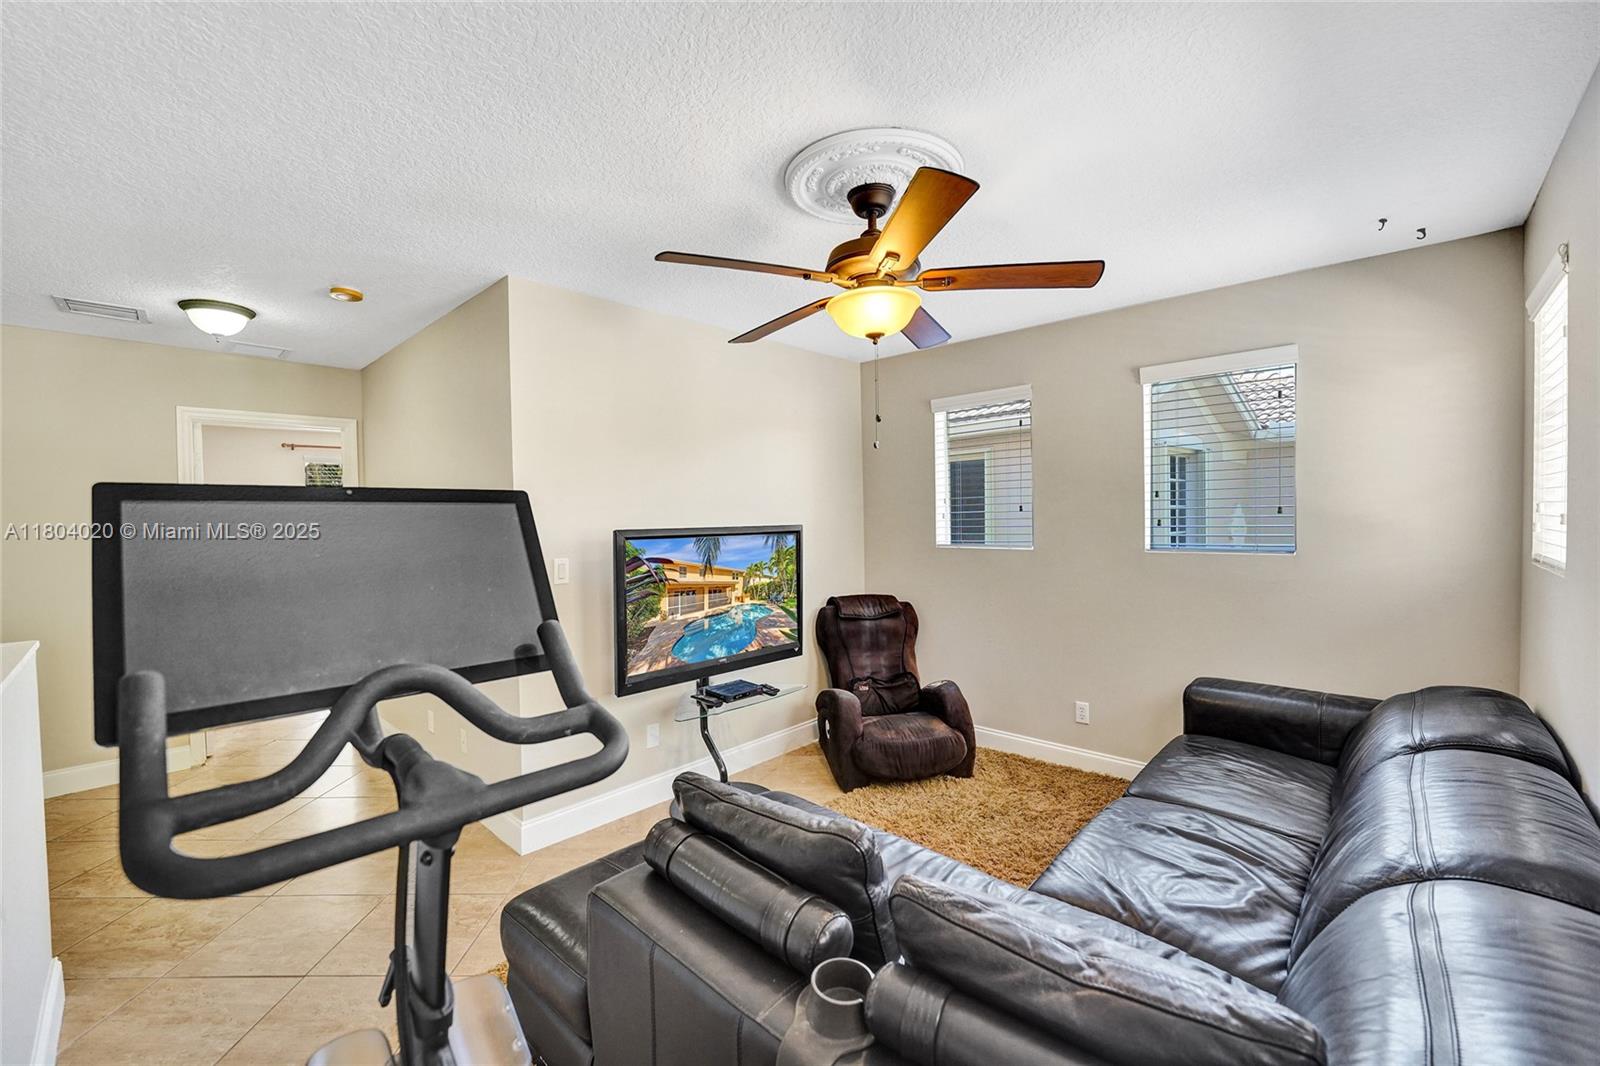
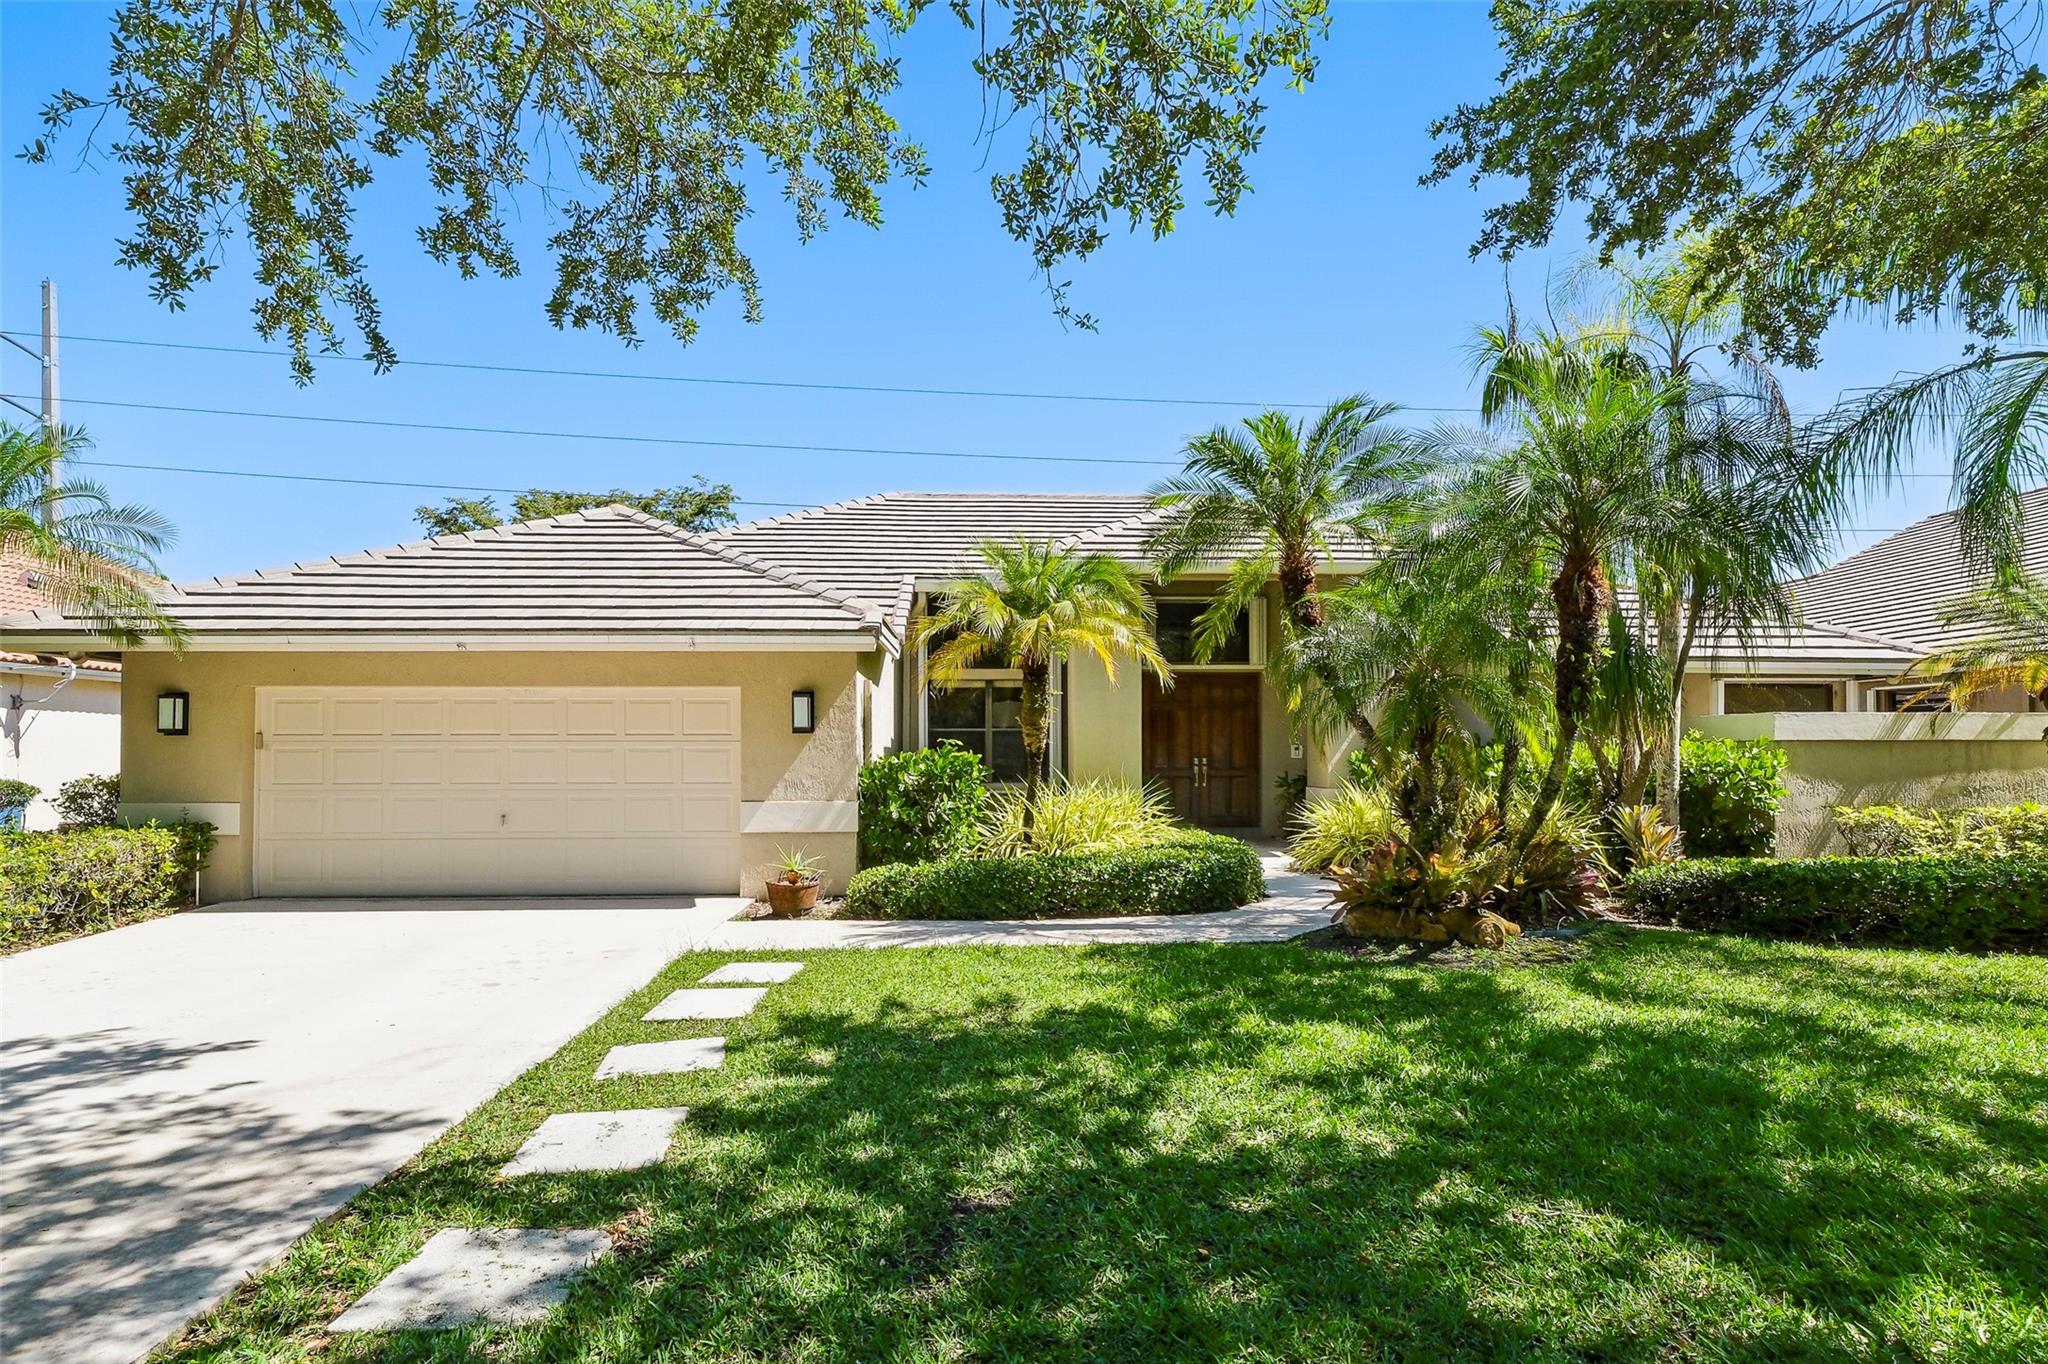
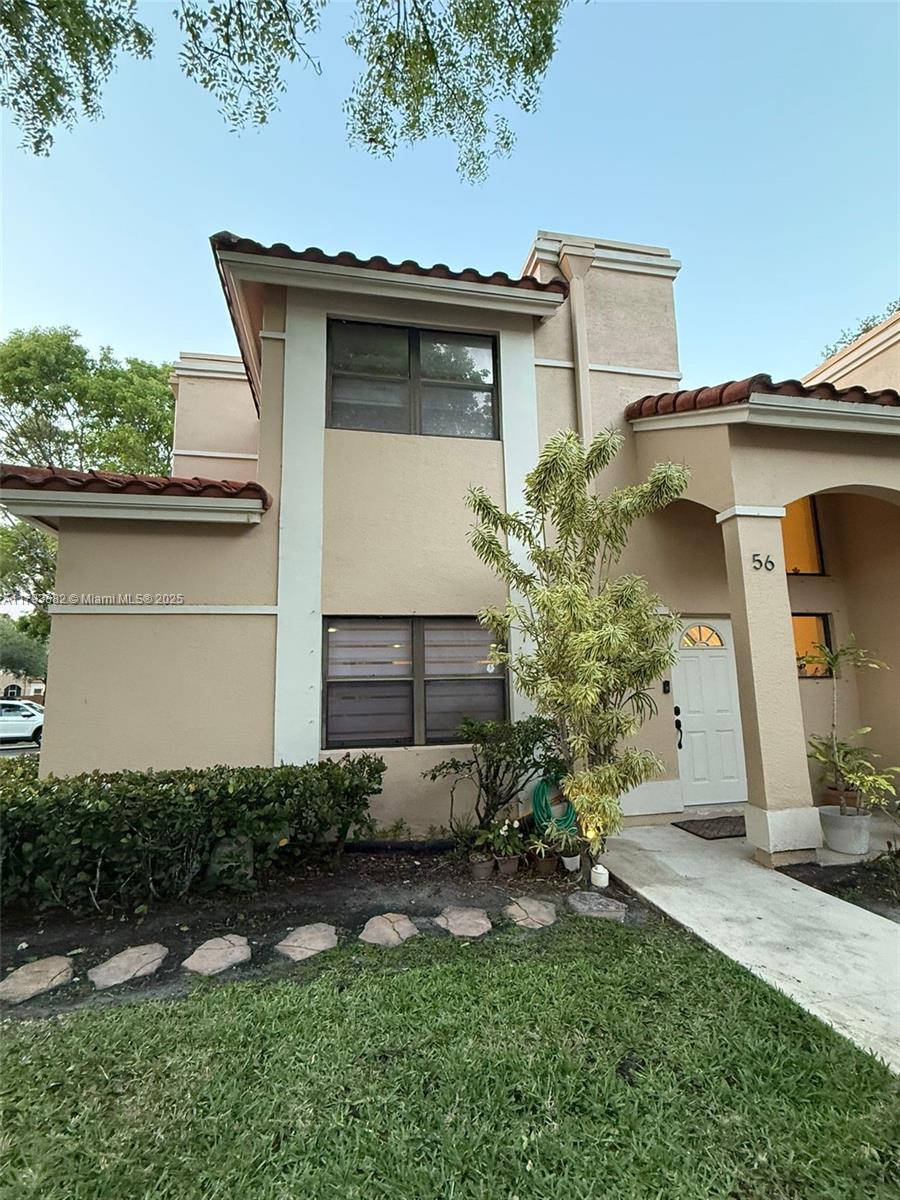
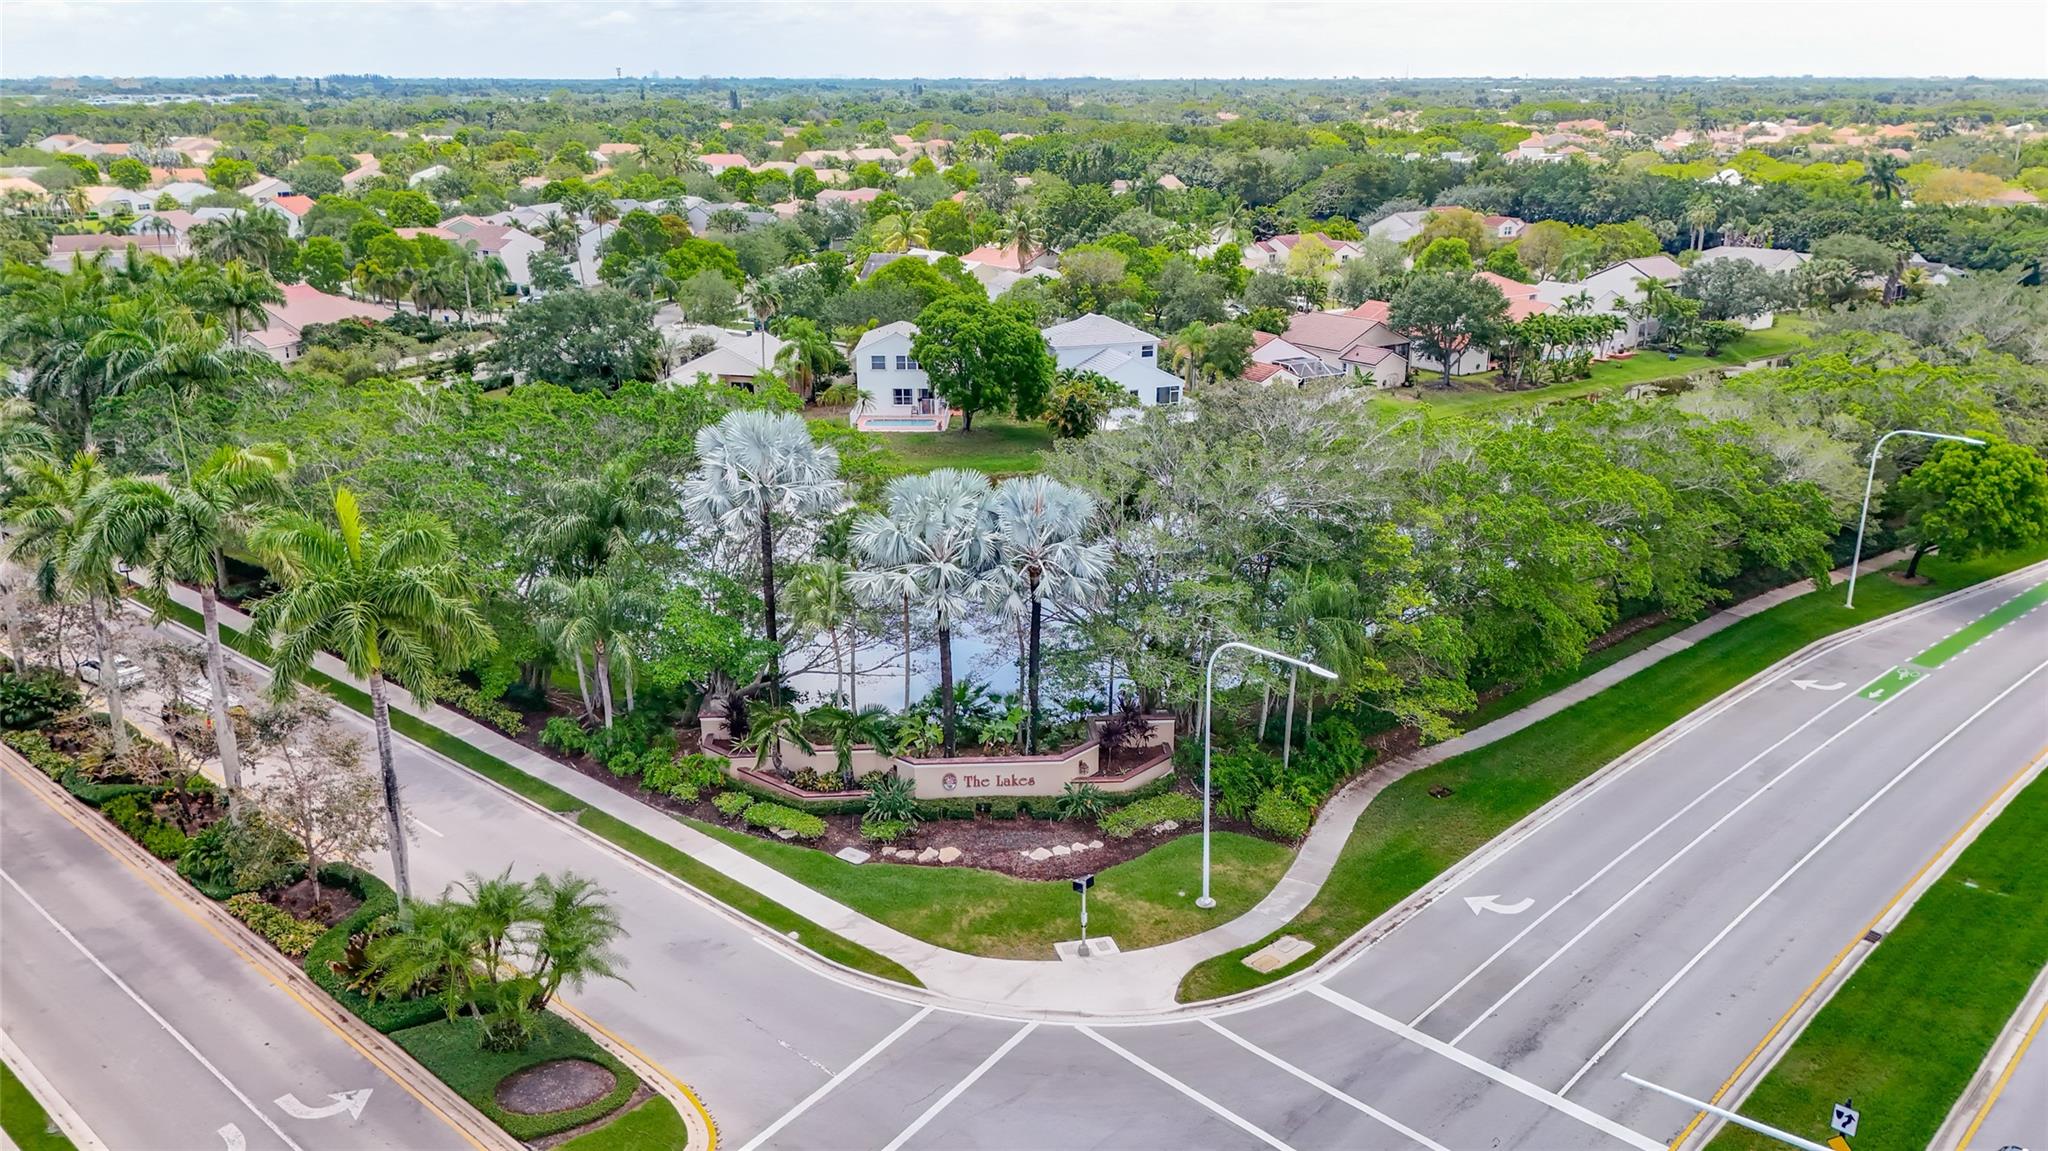
Best cash flowing properties in Weston, FL
Active
$349,900
2
bds
|
2
ba
|
1,090
sqft
|
built
1978
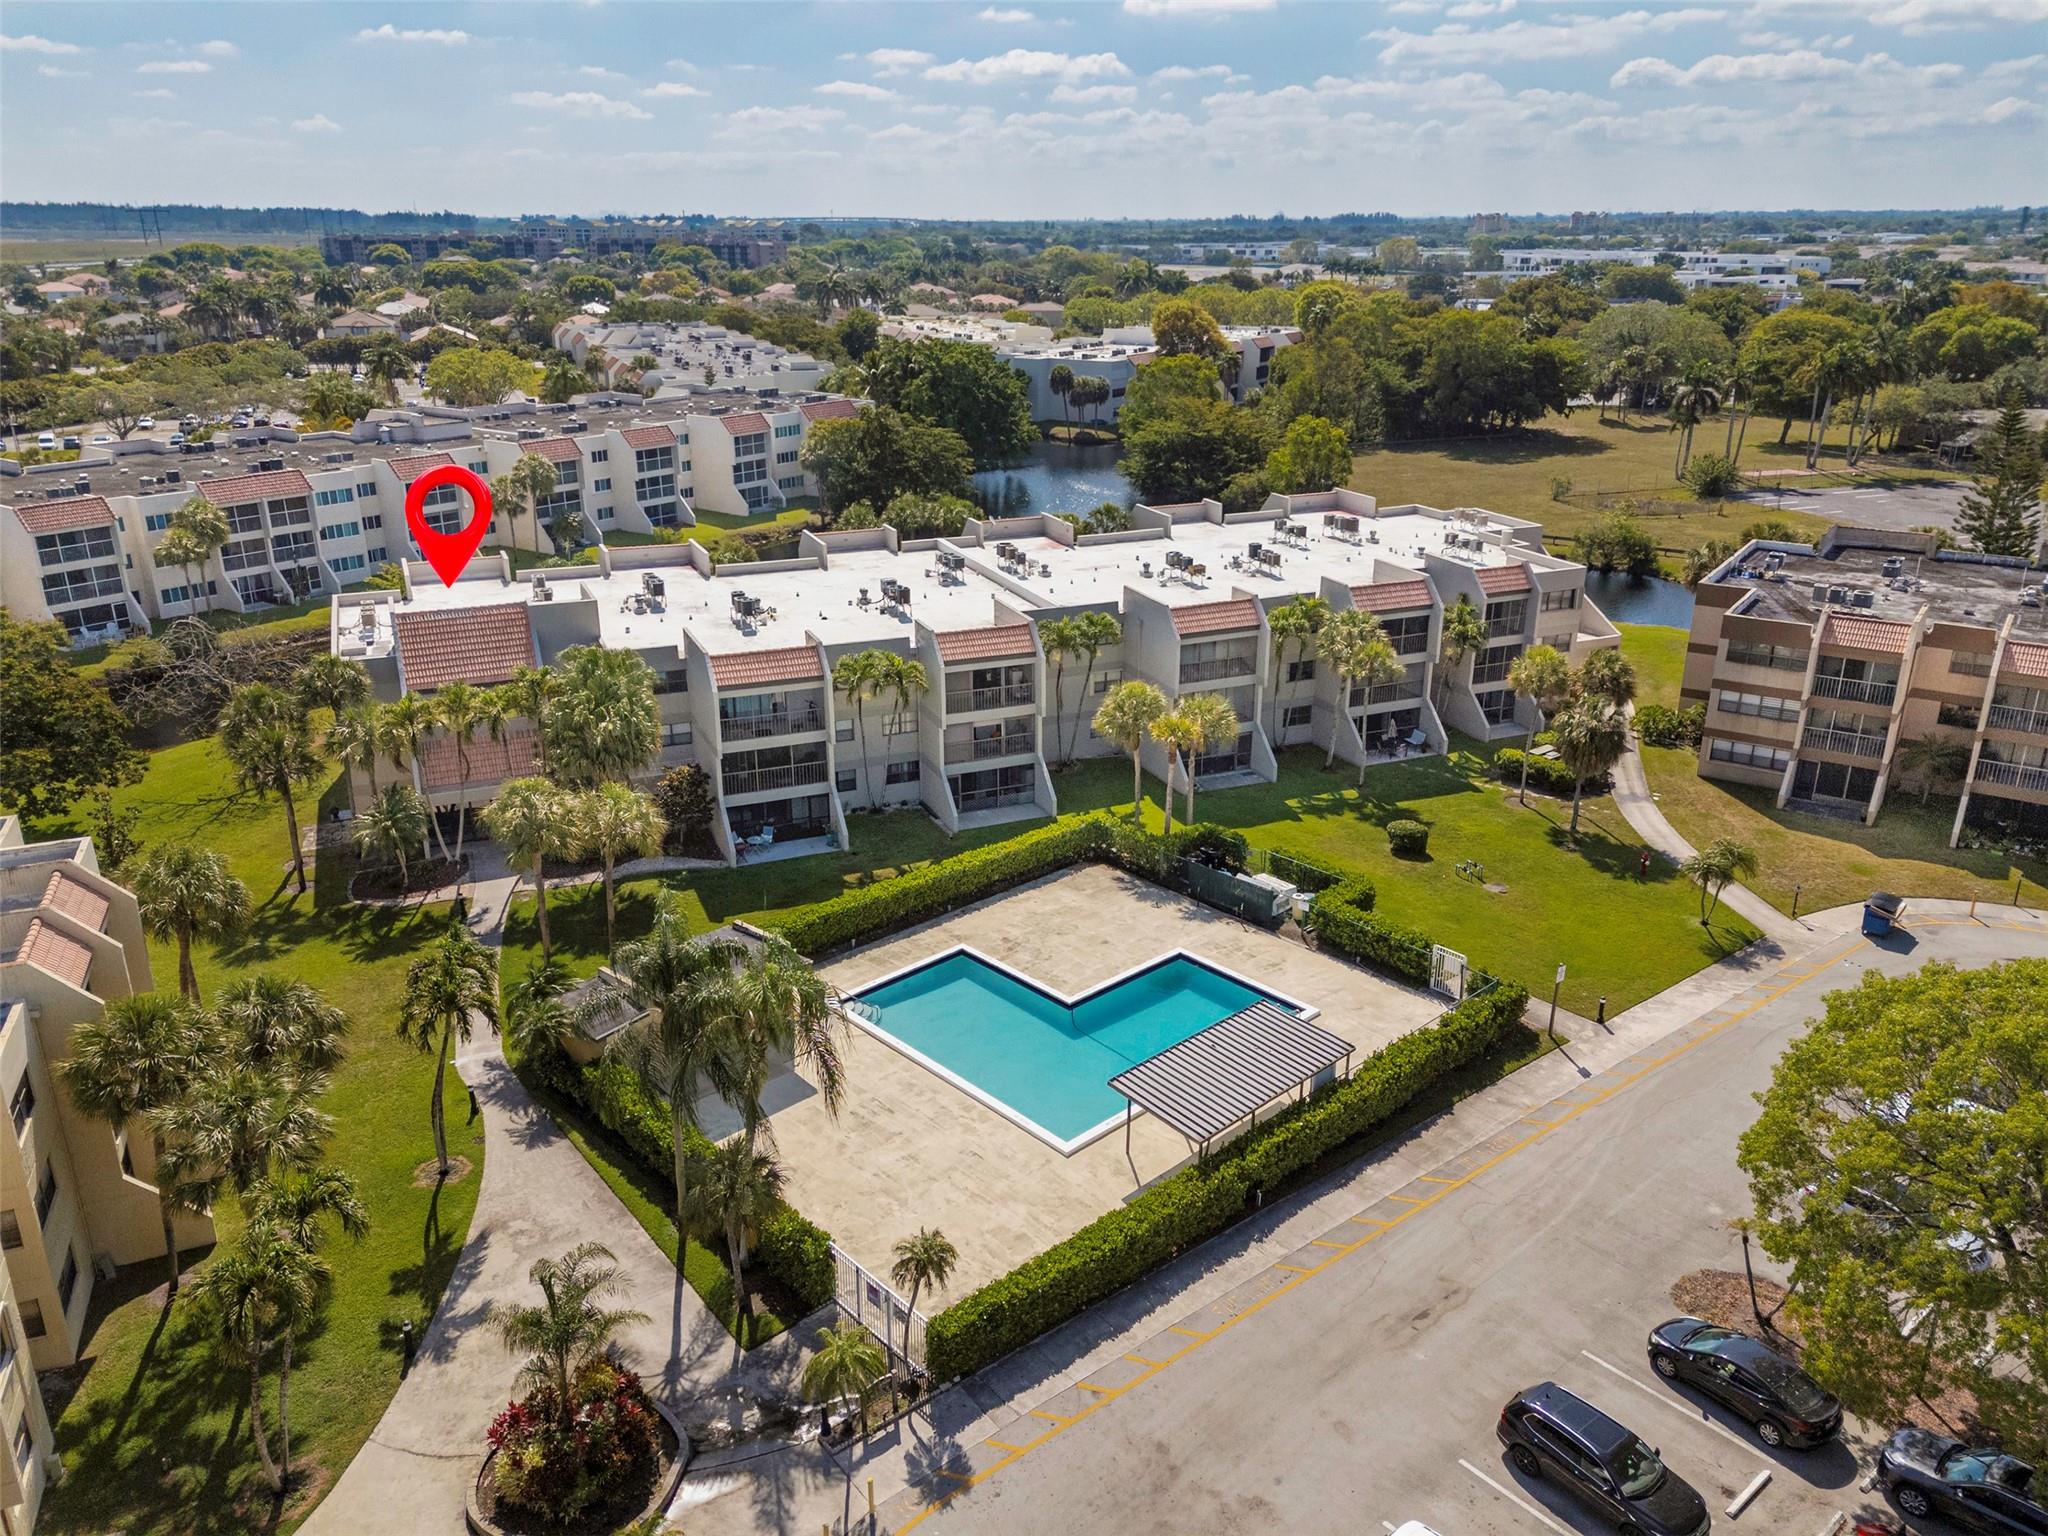
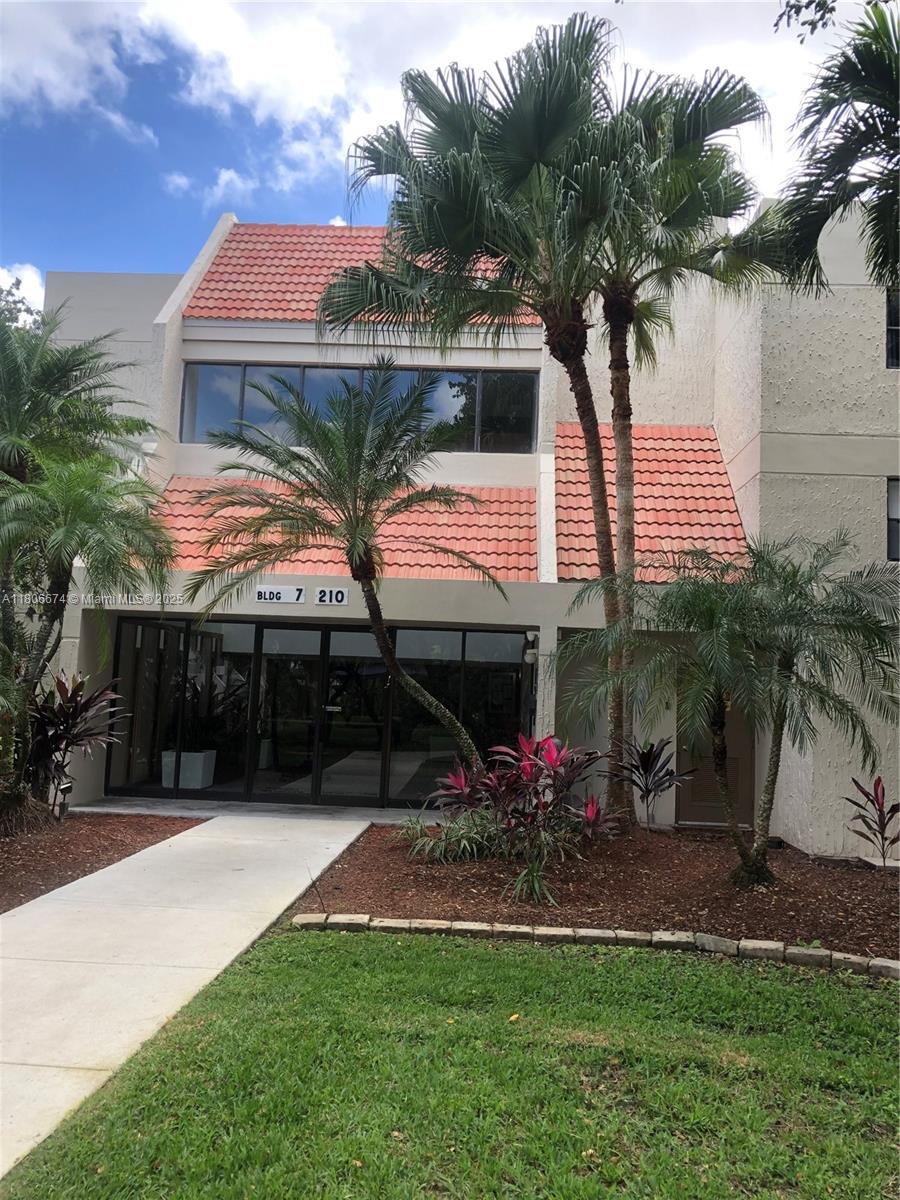
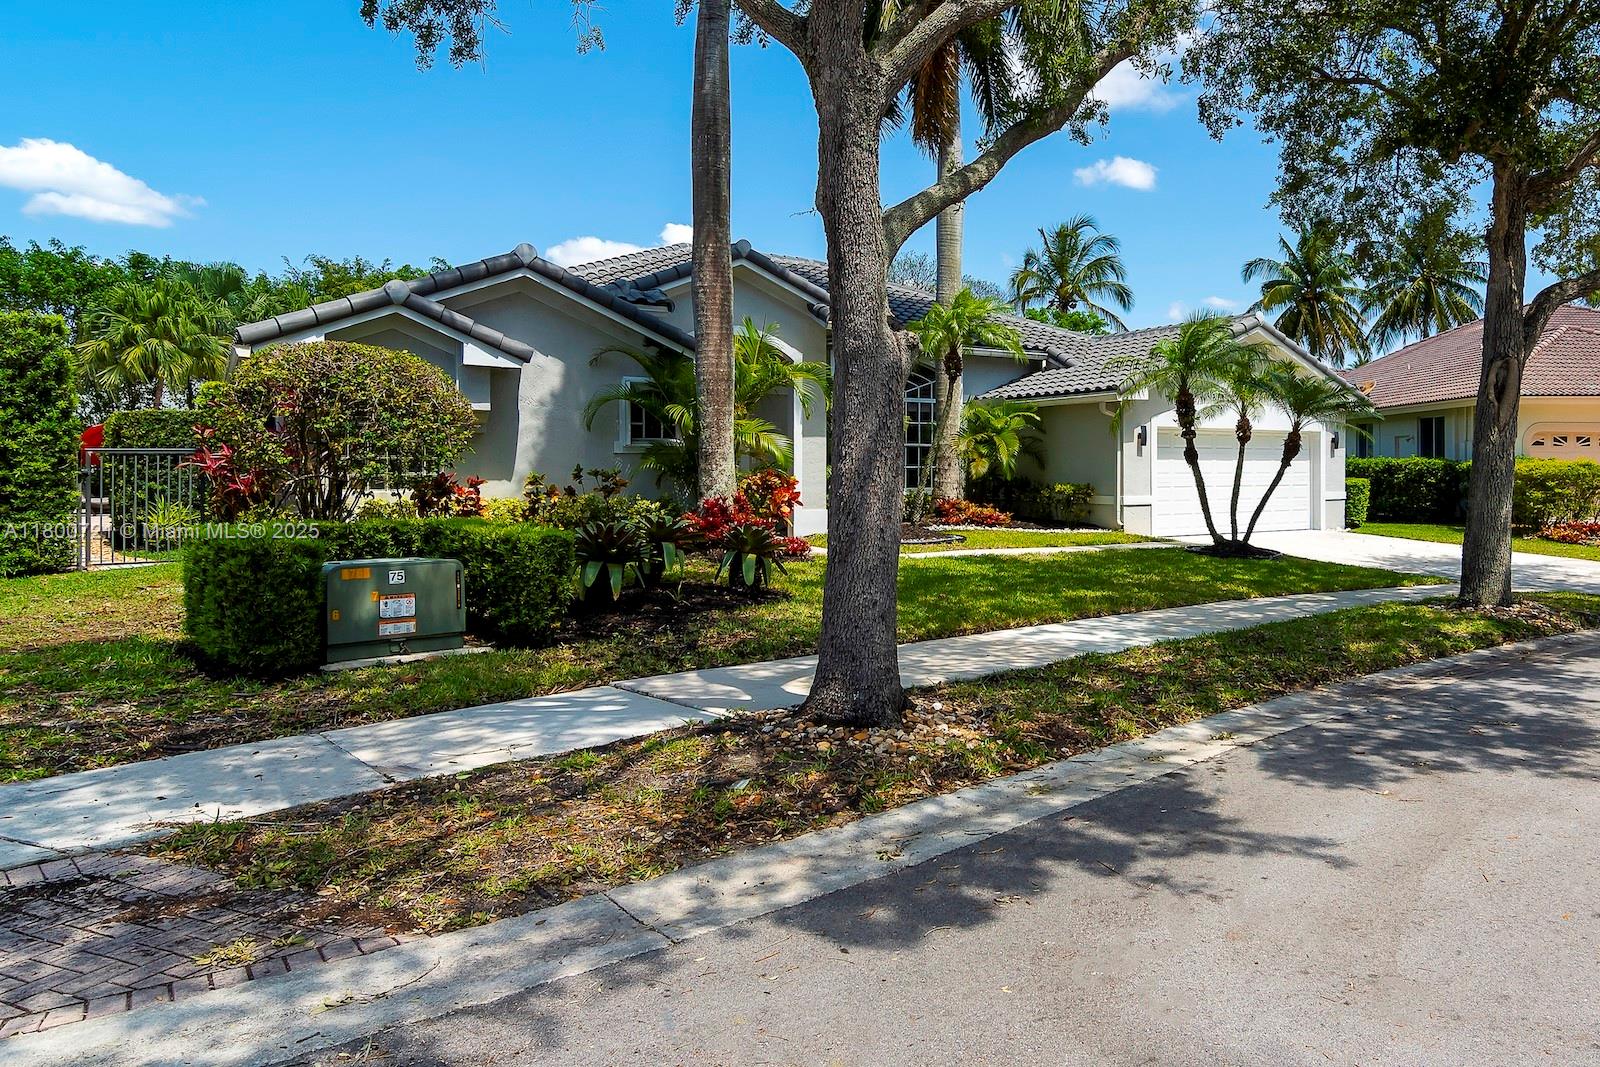
230 Lakeview Dr, Weston, FL 33326
$-296
Cash flow
-4.4%
Cash-on-Cash Return
5.3%
Cap rate
0.7%
Rent to Value Ratio

Active under contract
$240,000
1
bds
|
1
ba
|
812
sqft
|
built
1978
230 Lakeview Dr, Weston, FL 33326
$-499
Cash flow
-10.8%
Cash-on-Cash Return
3.8%
Cap rate
0.8%
Rent to Value Ratio
315 out of 333 properties for sale in Weston, FL
Limited Results Shown
Create a free account, or log in to reveal all property listings and enjoy the complete experience.
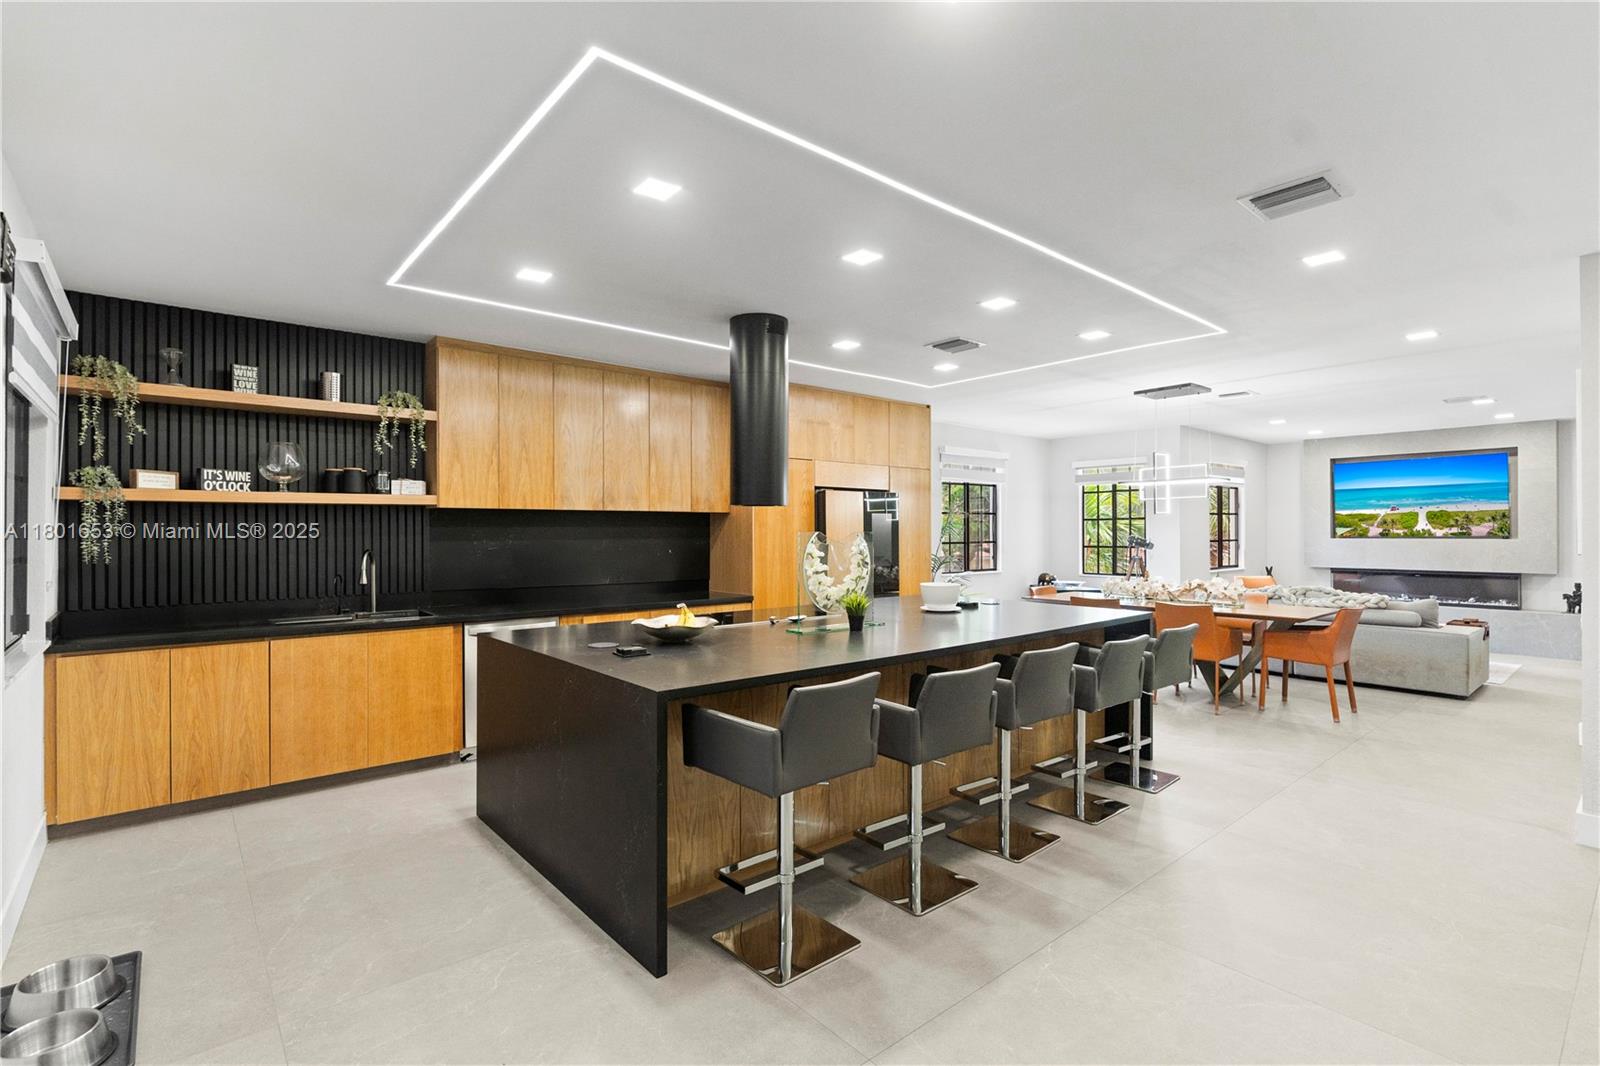
Active
$1,950,000
5
bds
|
4
ba
|
4,264
sqft
|
built
1999
15546 SW 17th St, Weston, FL 33326
$-7,087
Cash flow
-19.0%
Cash-on-Cash Return
1.9%
Cap rate
0.3%
Rent to Value Ratio
Active
$350,000
2
bds
|
2
ba
|
1,106
sqft
|
built
1978
210 Lakeview Dr, Weston, FL 33326
$-1,271
Cash flow
-18.9%
Cash-on-Cash Return
1.9%
Cap rate
0.7%
Rent to Value Ratio
Active
$475,000
2
bds
|
3
ba
|
1,386
sqft
|
built
2002
4136 Forest Dr, Weston, FL 33332
$-1,414
Cash flow
-15.5%
Cash-on-Cash Return
2.7%
Cap rate
0.6%
Rent to Value Ratio
Active
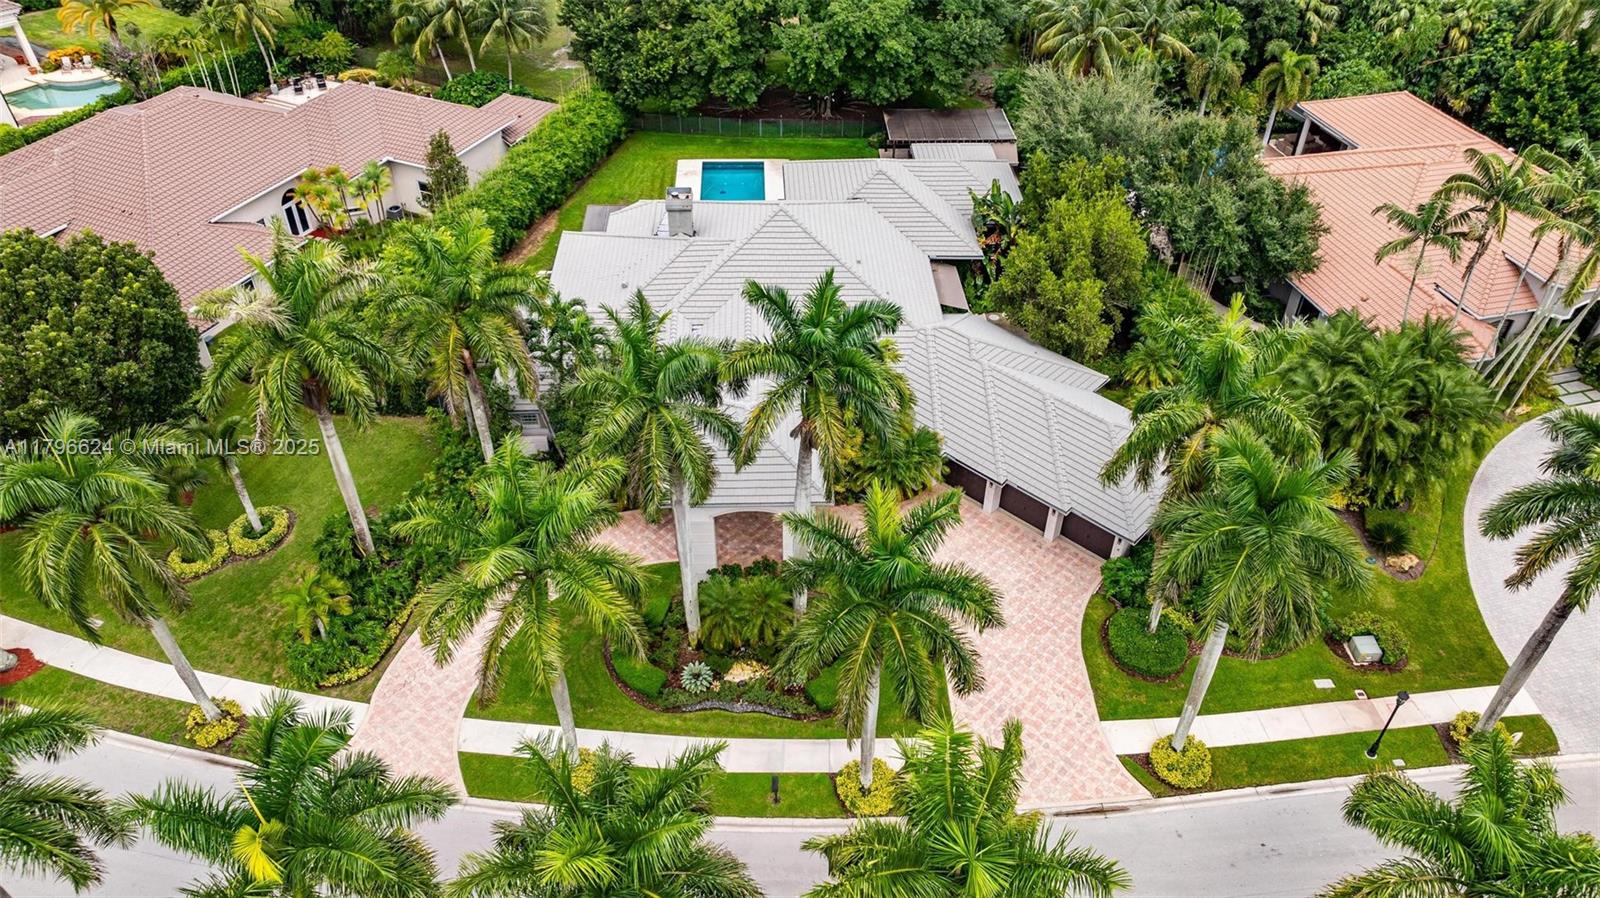
$1,000,000
5
bds
|
4
ba
|
3,041
sqft
|
built
2003
4470 E Seneca Ave, Weston, FL 33332
$-2,281
Cash flow
-11.9%
Cash-on-Cash Return
3.5%
Cap rate
0.6%
Rent to Value Ratio
Active
$1,200,000
4
bds
|
3
ba
|
2,626
sqft
|
built
1991
1119 Creekford Dr, Weston, FL 33326
$-3,429
Cash flow
-14.9%
Cash-on-Cash Return
2.9%
Cap rate
0.5%
Rent to Value Ratio
Active under contract
$240,000
1
bds
|
1
ba
|
812
sqft
|
built
1978
230 Lakeview Dr, Weston, FL 33326
$-499
Cash flow
-10.8%
Cash-on-Cash Return
3.8%
Cap rate
0.8%
Rent to Value Ratio
Active
$510,000
3
bds
|
3
ba
|
1,588
sqft
|
built
1988
513 Racquet Club Rd, Weston, FL 33326
$-1,622
Cash flow
-16.6%
Cash-on-Cash Return
2.5%
Cap rate
0.6%
Rent to Value Ratio
Active
$1,270,000
5
bds
|
4
ba
|
3,106
sqft
|
built
1994
515 Montclaire Dr, Weston, FL 33326
$-3,983
Cash flow
-16.4%
Cash-on-Cash Return
2.5%
Cap rate
0.4%
Rent to Value Ratio
Active
$1,199,000
5
bds
|
4
ba
|
3,141
sqft
|
built
2004
4450 Laurel Pl, Weston, FL 33332
$-3,763
Cash flow
-16.4%
Cash-on-Cash Return
2.5%
Cap rate
0.5%
Rent to Value Ratio
Active
$1,749,000
5
bds
|
4
ba
|
3,453
sqft
|
built
1996
2495 Eagle Watch Ln, Weston, FL 33327
$-5,399
Cash flow
-16.1%
Cash-on-Cash Return
2.6%
Cap rate
0.4%
Rent to Value Ratio
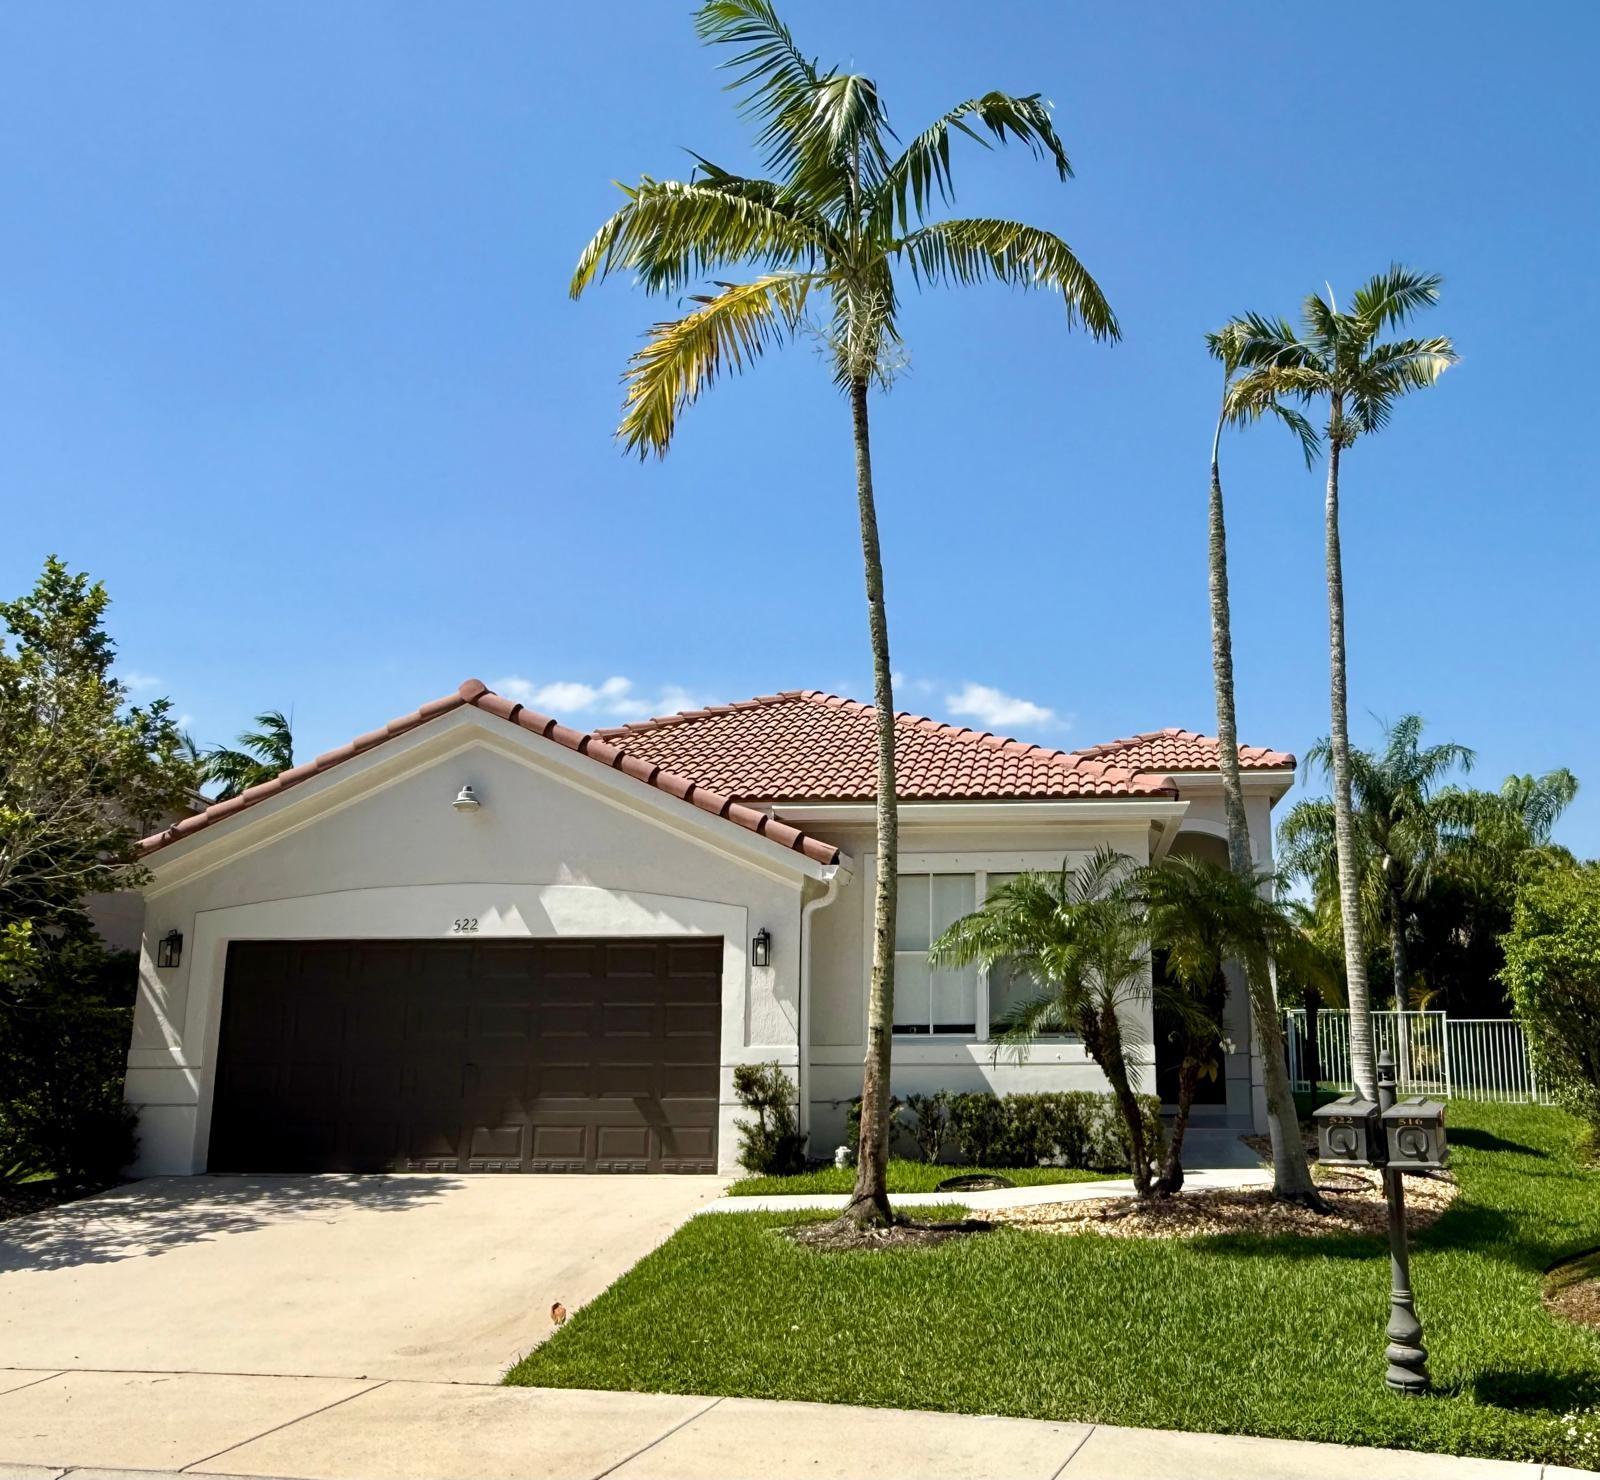
Active
$730,000
3
bds
|
2
ba
|
1,662
sqft
|
built
2001
522 Live Oak Ln, Weston, FL 33327
$-1,976
Cash flow
-14.1%
Cash-on-Cash Return
3.0%
Cap rate
0.6%
Rent to Value Ratio

Active
$320,000
2
bds
|
2
ba
|
1,292
sqft
|
built
1981
16141 Blatt Blvd, Weston, FL 33326
$-564
Cash flow
-9.2%
Cash-on-Cash Return
4.2%
Cap rate
0.7%
Rent to Value Ratio
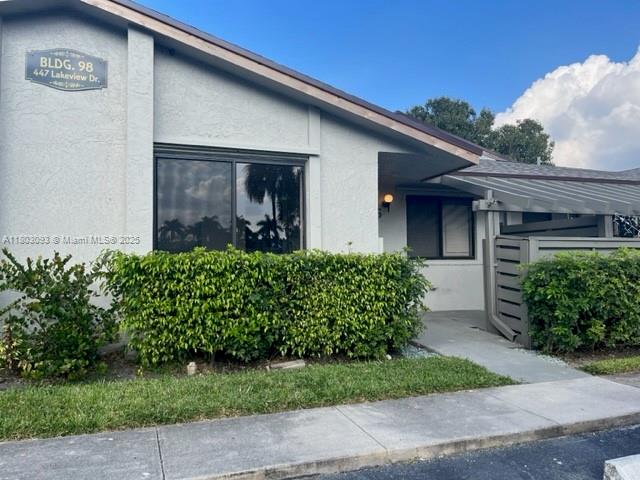
Active
$419,000
2
bds
|
2
ba
|
1,048
sqft
|
built
1985
447 Lakeview Dr, Weston, FL 33326
$-1,218
Cash flow
-15.2%
Cash-on-Cash Return
2.8%
Cap rate
0.7%
Rent to Value Ratio
Active
$865,000
3
bds
|
2
ba
|
1,822
sqft
|
built
1996
16417 Sapphire Pl, Weston, FL 33331
$-2,907
Cash flow
-17.5%
Cash-on-Cash Return
2.3%
Cap rate
0.5%
Rent to Value Ratio
Active
$675,000
3
bds
|
2
ba
|
1,416
sqft
|
built
1997
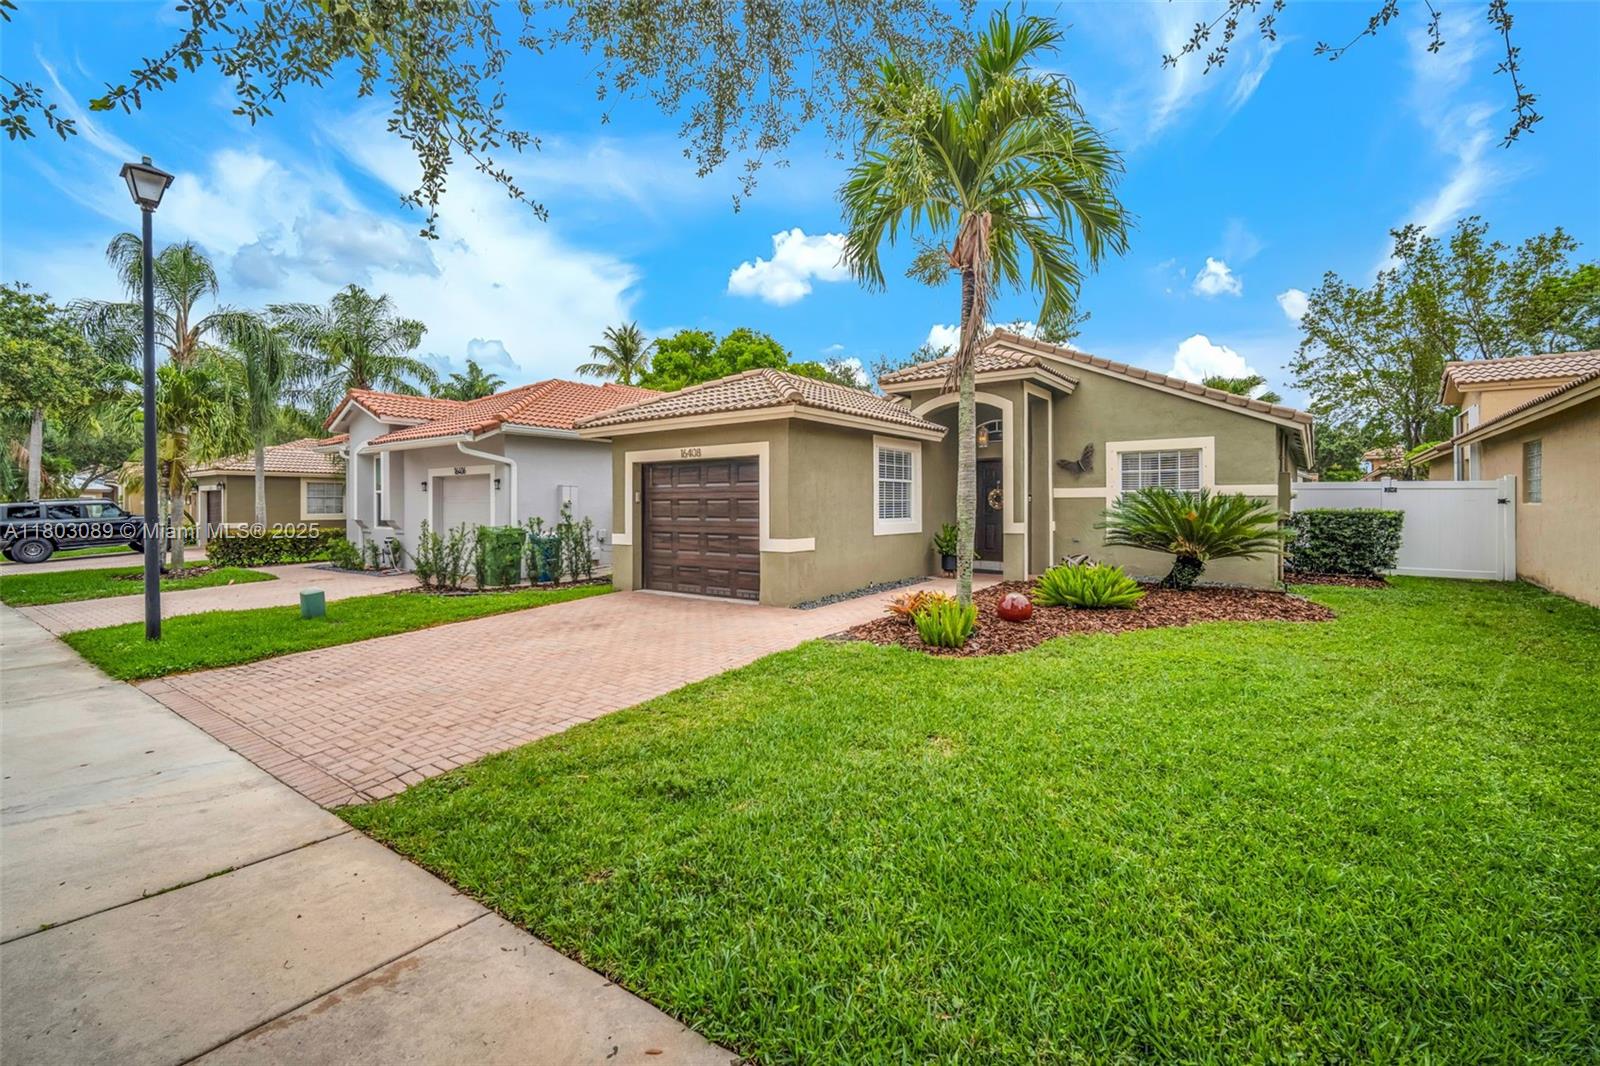
16408 Sapphire Bnd, Weston, FL 33331
$-1,669
Cash flow
-12.9%
Cash-on-Cash Return
3.3%
Cap rate
0.6%
Rent to Value Ratio
Active under contract
$450,000
2
bds
|
2
ba
|
1,580
sqft
|
built
1979
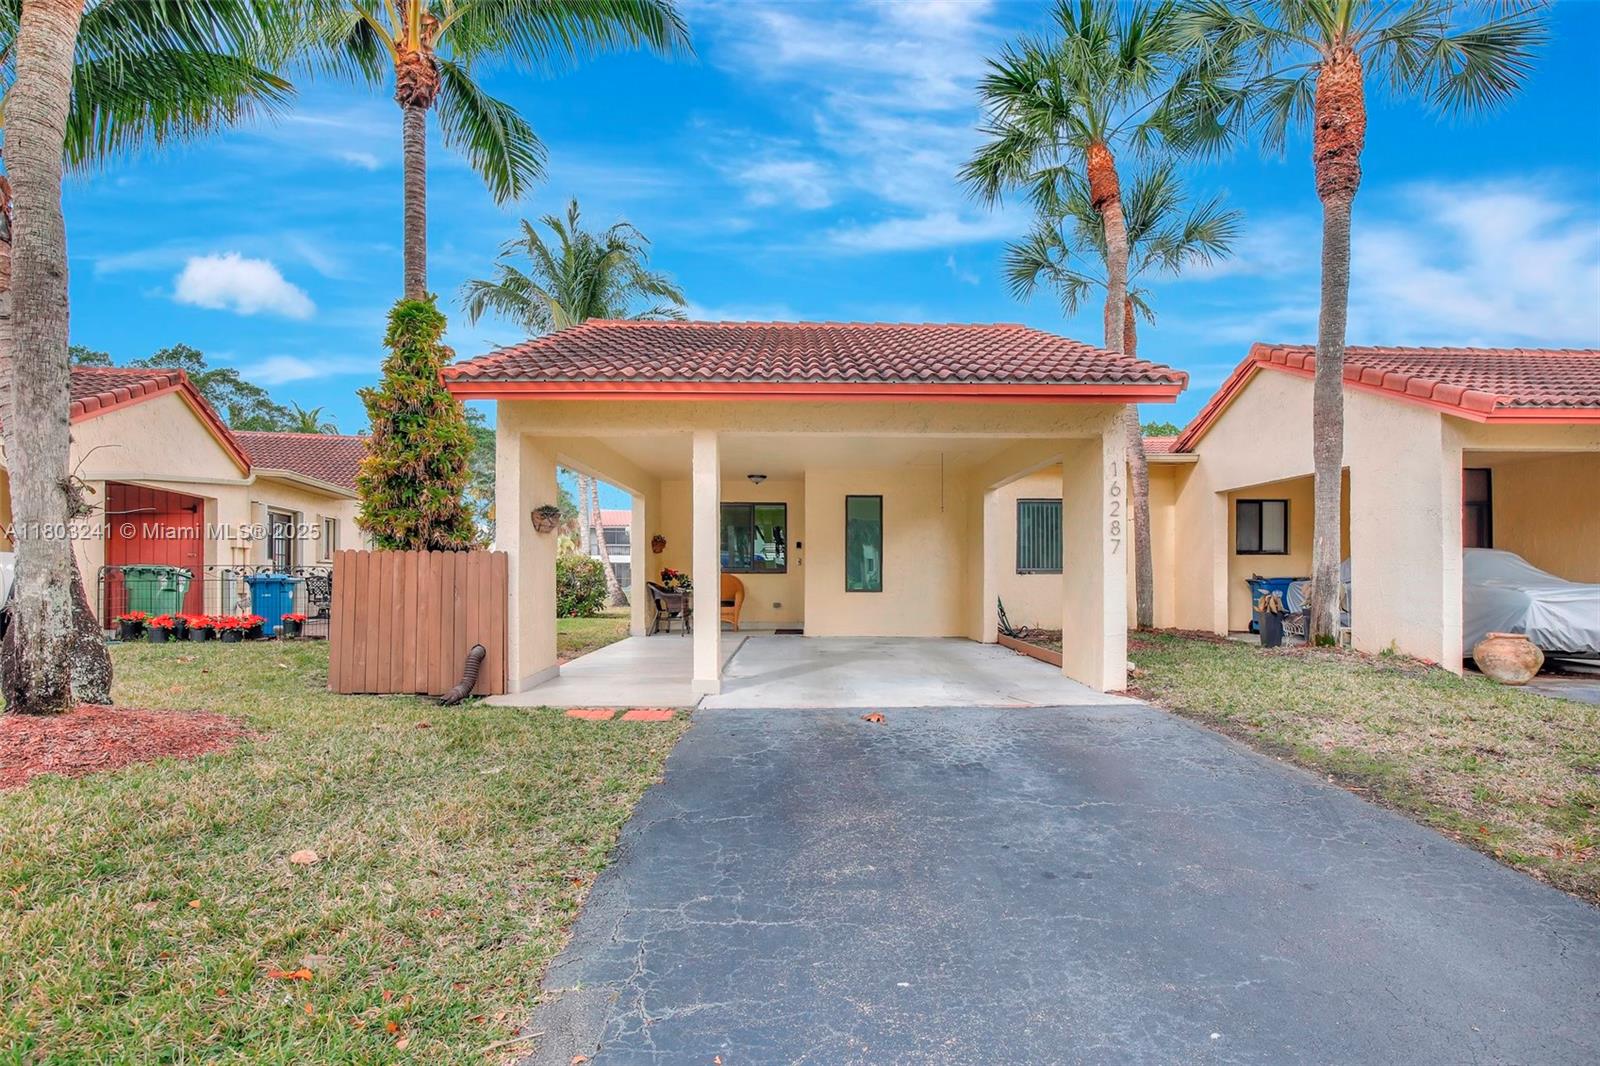
16287 Laurel Dr, Weston, FL 33326
$-1,260
Cash flow
-14.6%
Cash-on-Cash Return
2.9%
Cap rate
0.8%
Rent to Value Ratio

Active
$659,000
3
bds
|
2
ba
|
1,390
sqft
|
built
1997
4454 Mahogany Ridge Dr, Weston, FL 33331
$-1,948
Cash flow
-15.4%
Cash-on-Cash Return
2.7%
Cap rate
0.5%
Rent to Value Ratio
Active
$799,990
4
bds
|
2
ba
|
1,876
sqft
|
built
2001
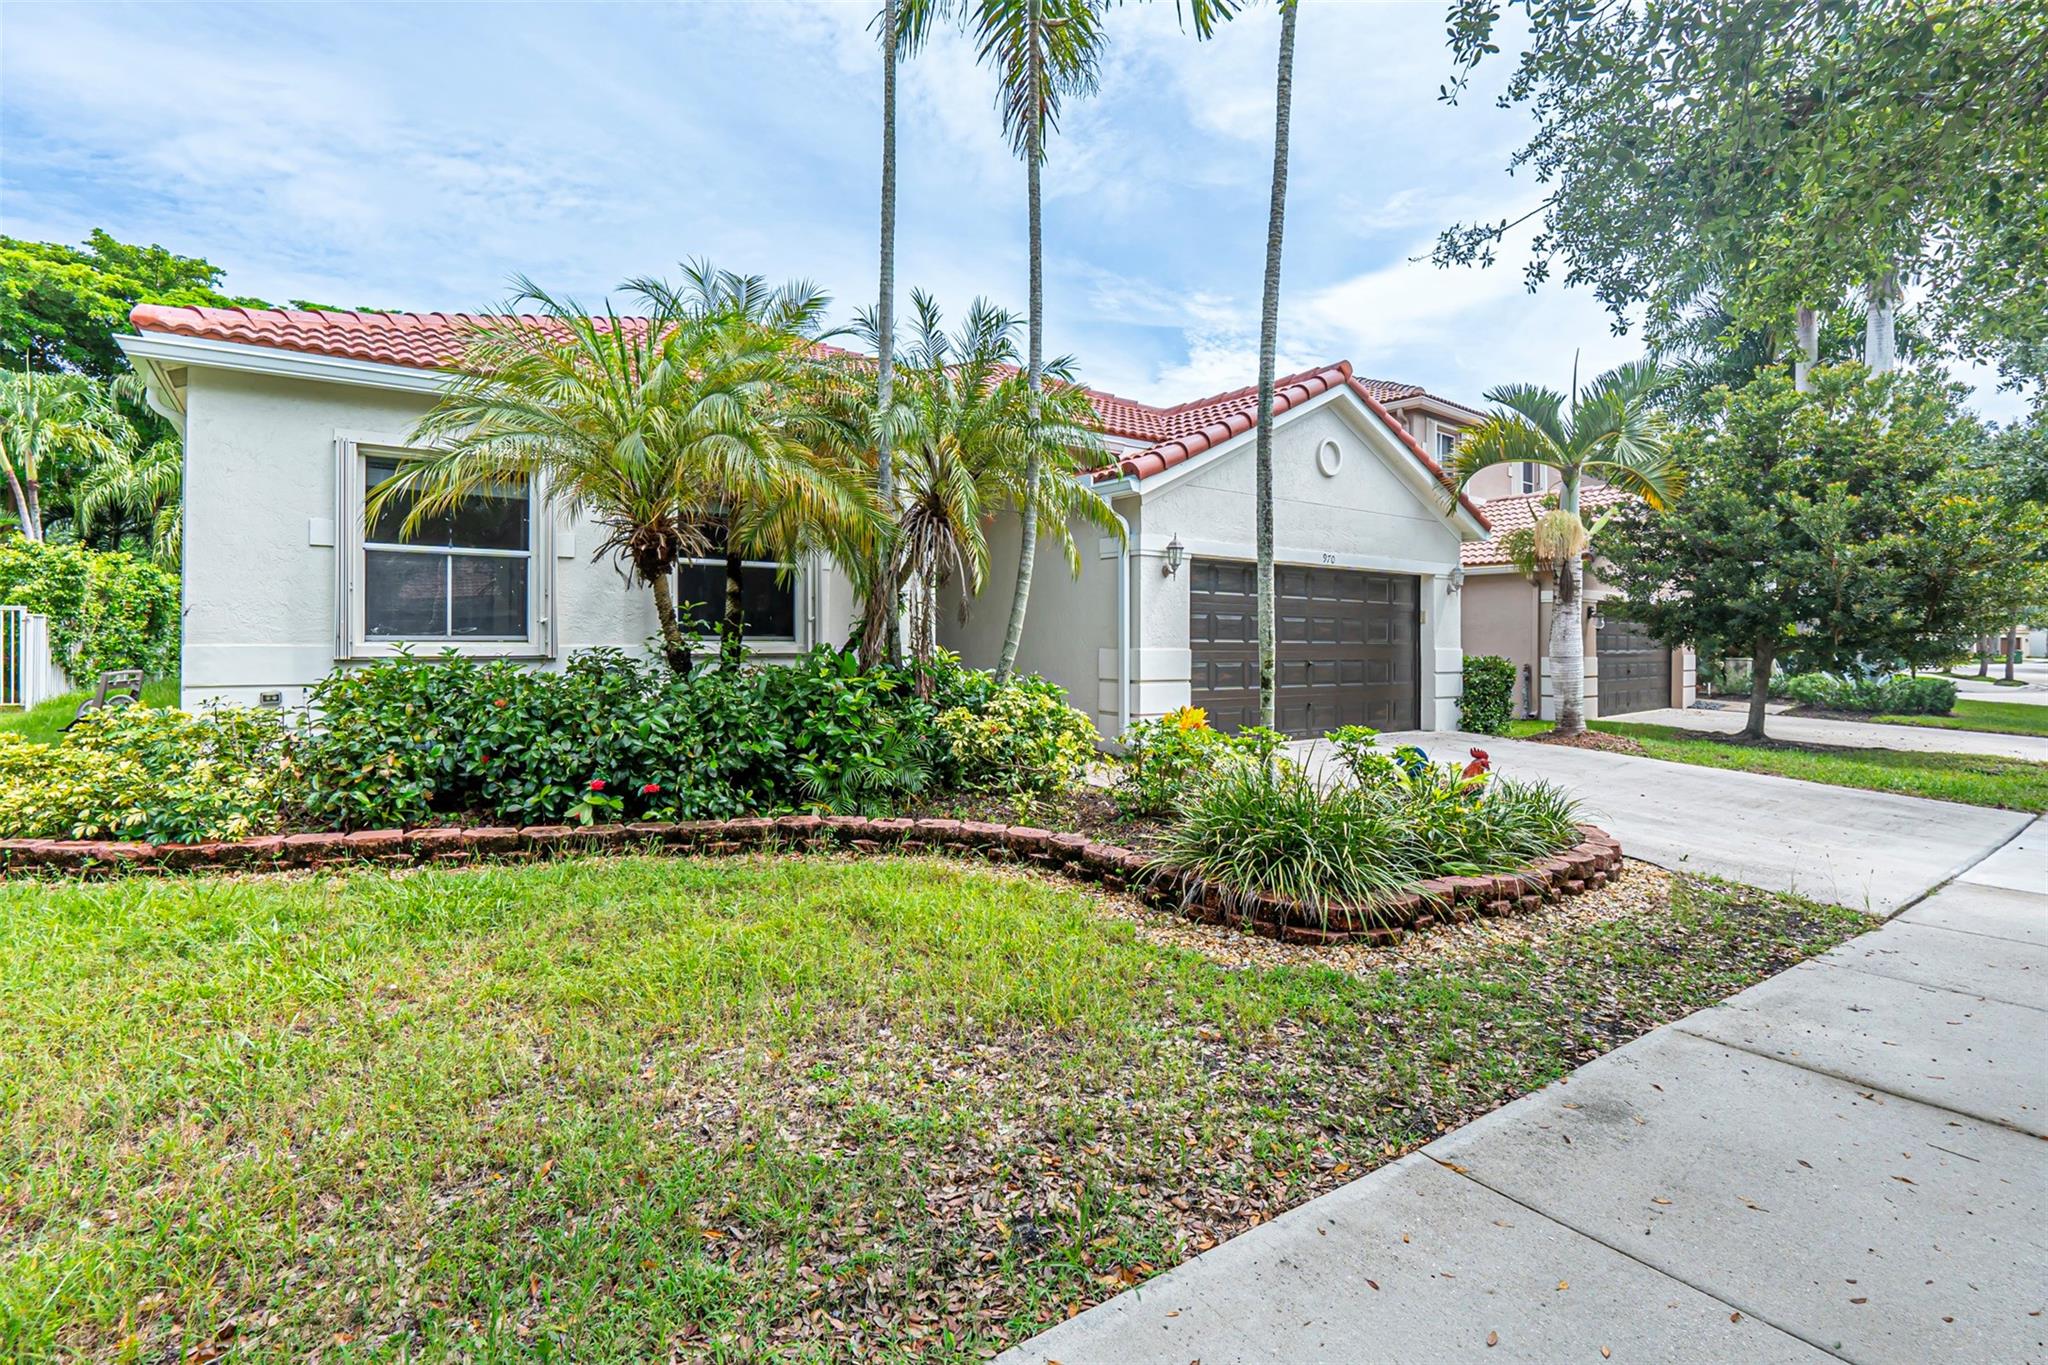
970 Tulip Cir, Weston, FL 33327
$-1,897
Cash flow
-12.4%
Cash-on-Cash Return
3.4%
Cap rate
0.6%
Rent to Value Ratio

Active
$2,295,000
6
bds
|
5
ba
|
4,171
sqft
|
built
1999
2474 Provence Cir, Weston, FL 33327
$-6,642
Cash flow
-15.1%
Cash-on-Cash Return
2.8%
Cap rate
0.5%
Rent to Value Ratio
Active
$860,000
4
bds
|
3
ba
|
2,340
sqft
|
built
2002
1504 Passion Vine Cir, Weston, FL 33326
$-3,425
Cash flow
-20.8%
Cash-on-Cash Return
1.5%
Cap rate
0.5%
Rent to Value Ratio
Active
$1,595,000
5
bds
|
3
ba
|
0
sqft
|
built
1995
218 Egret Ct, Weston, FL 33327
$-4,052
Cash flow
-13.3%
Cash-on-Cash Return
3.2%
Cap rate
0.5%
Rent to Value Ratio
Active
$349,900
2
bds
|
2
ba
|
1,090
sqft
|
built
1978
230 Lakeview Dr, Weston, FL 33326
$-296
Cash flow
-4.4%
Cash-on-Cash Return
5.3%
Cap rate
0.7%
Rent to Value Ratio
Active
$658,000
3
bds
|
3
ba
|
1,502
sqft
|
built
1988
1388 Garden Rd, Weston, FL 33326
$-1,714
Cash flow
-13.6%
Cash-on-Cash Return
3.2%
Cap rate
0.6%
Rent to Value Ratio
Active
$1,098,000
4
bds
|
3
ba
|
2,674
sqft
|
built
2001
1366 Crossbill Ct, Weston, FL 33327
$-3,667
Cash flow
-17.4%
Cash-on-Cash Return
2.3%
Cap rate
0.5%
Rent to Value Ratio
Active
$1,980,000
5
bds
|
4
ba
|
3,979
sqft
|
built
2001
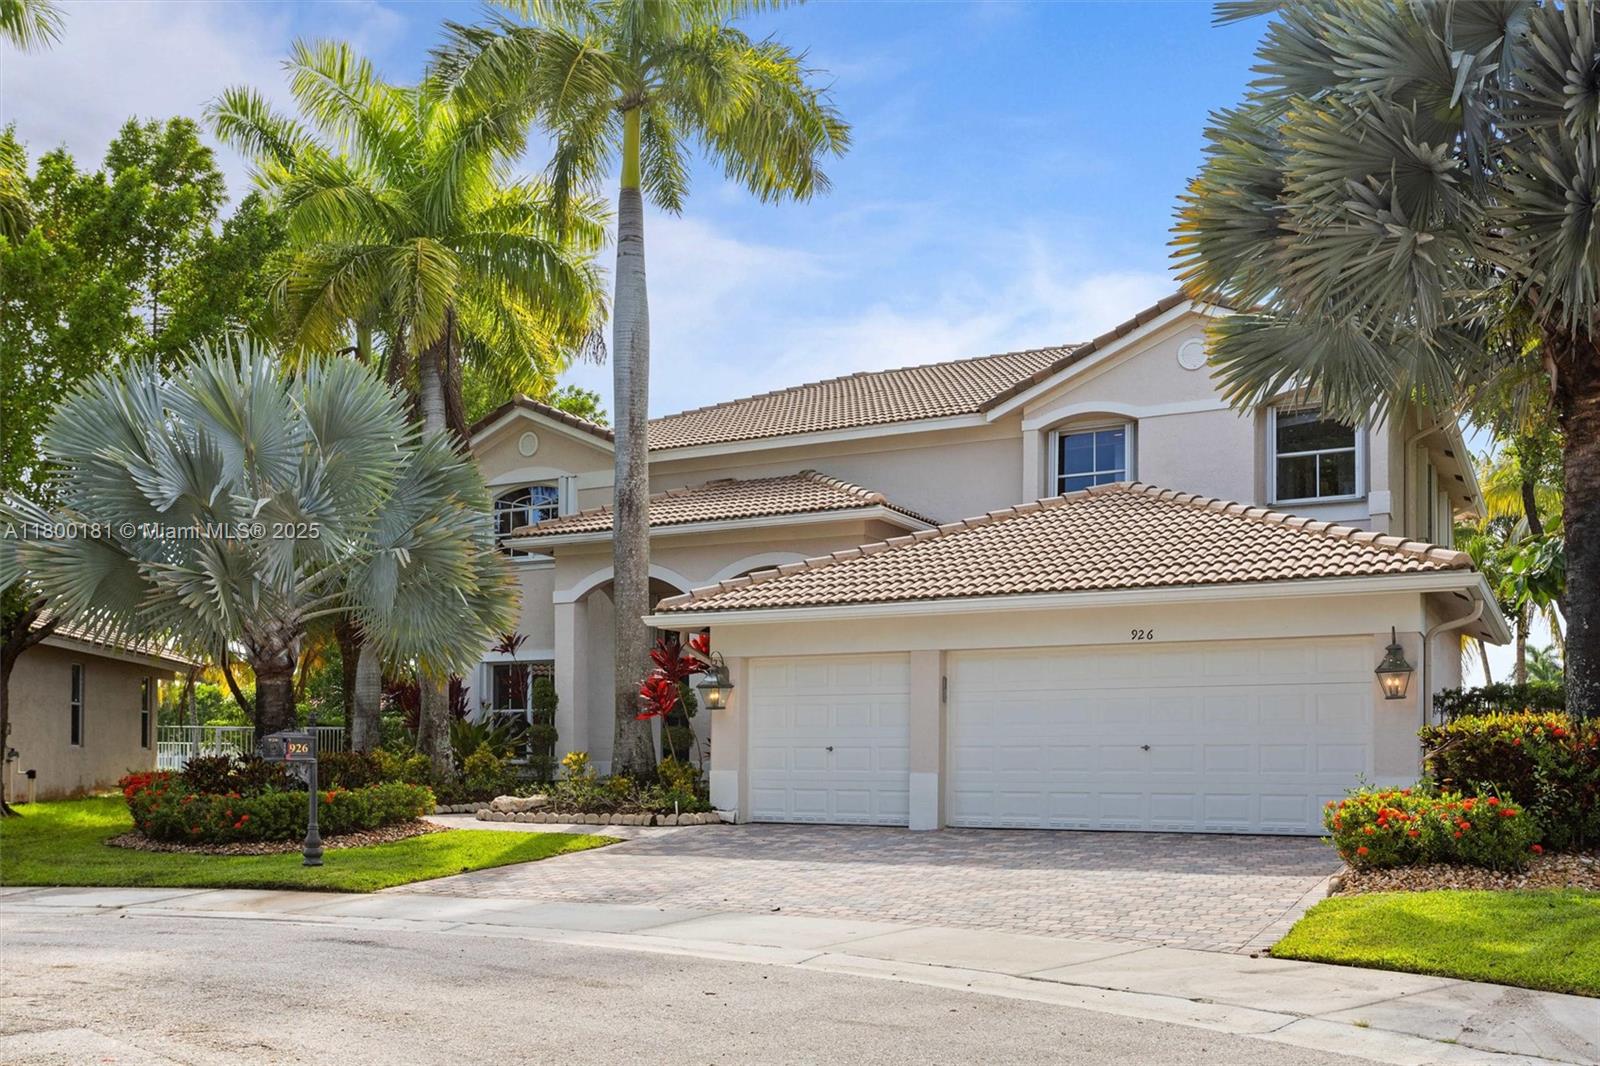
926 Marina Dr, Weston, FL 33327
$-5,768
Cash flow
-15.2%
Cash-on-Cash Return
2.8%
Cap rate
0.5%
Rent to Value Ratio

Pending
$835,000
3
bds
|
2
ba
|
1,829
sqft
|
built
1996
16514 Ruby Lk, Weston, FL 33331
$-2,085
Cash flow
-13.0%
Cash-on-Cash Return
3.3%
Cap rate
0.7%
Rent to Value Ratio
Active
$379,500
2
bds
|
2
ba
|
1,490
sqft
|
built
1980
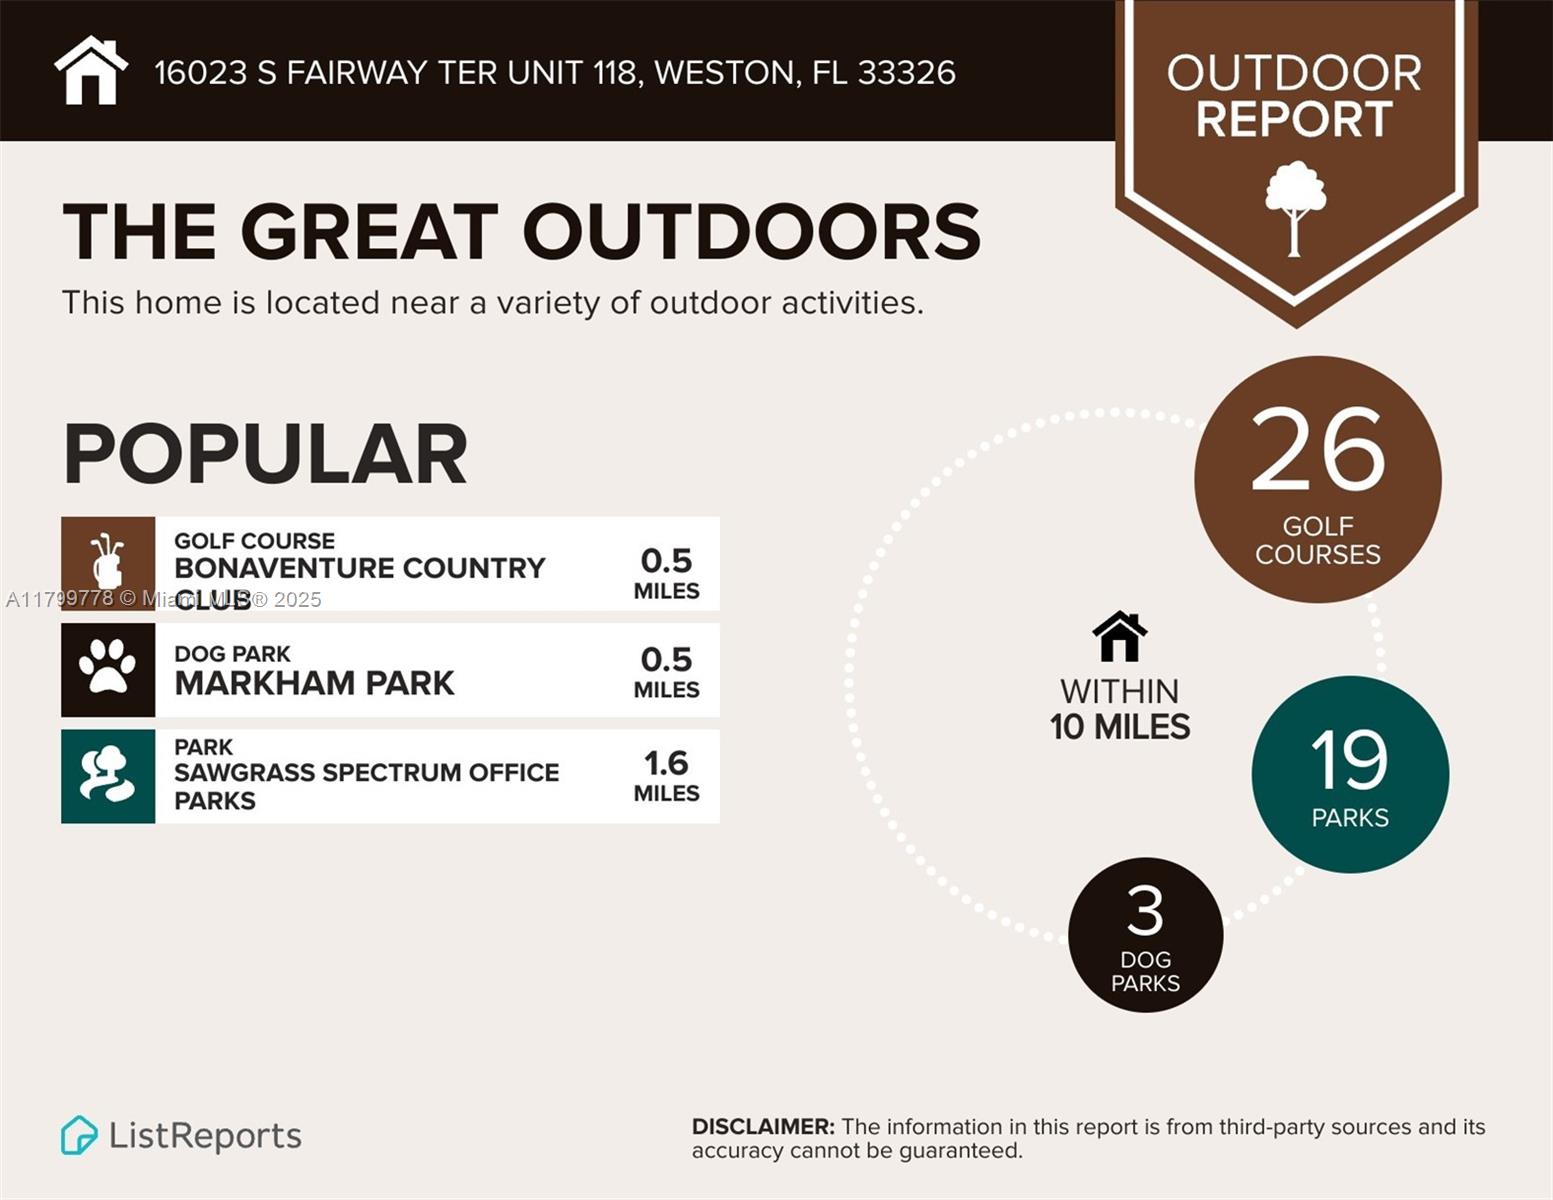
16023 Fairway Ter, Weston, FL 33326
$-994
Cash flow
-13.7%
Cash-on-Cash Return
3.1%
Cap rate
0.8%
Rent to Value Ratio
Pending
$749,000
4
bds
|
3
ba
|
2,071
sqft
|
built
1982
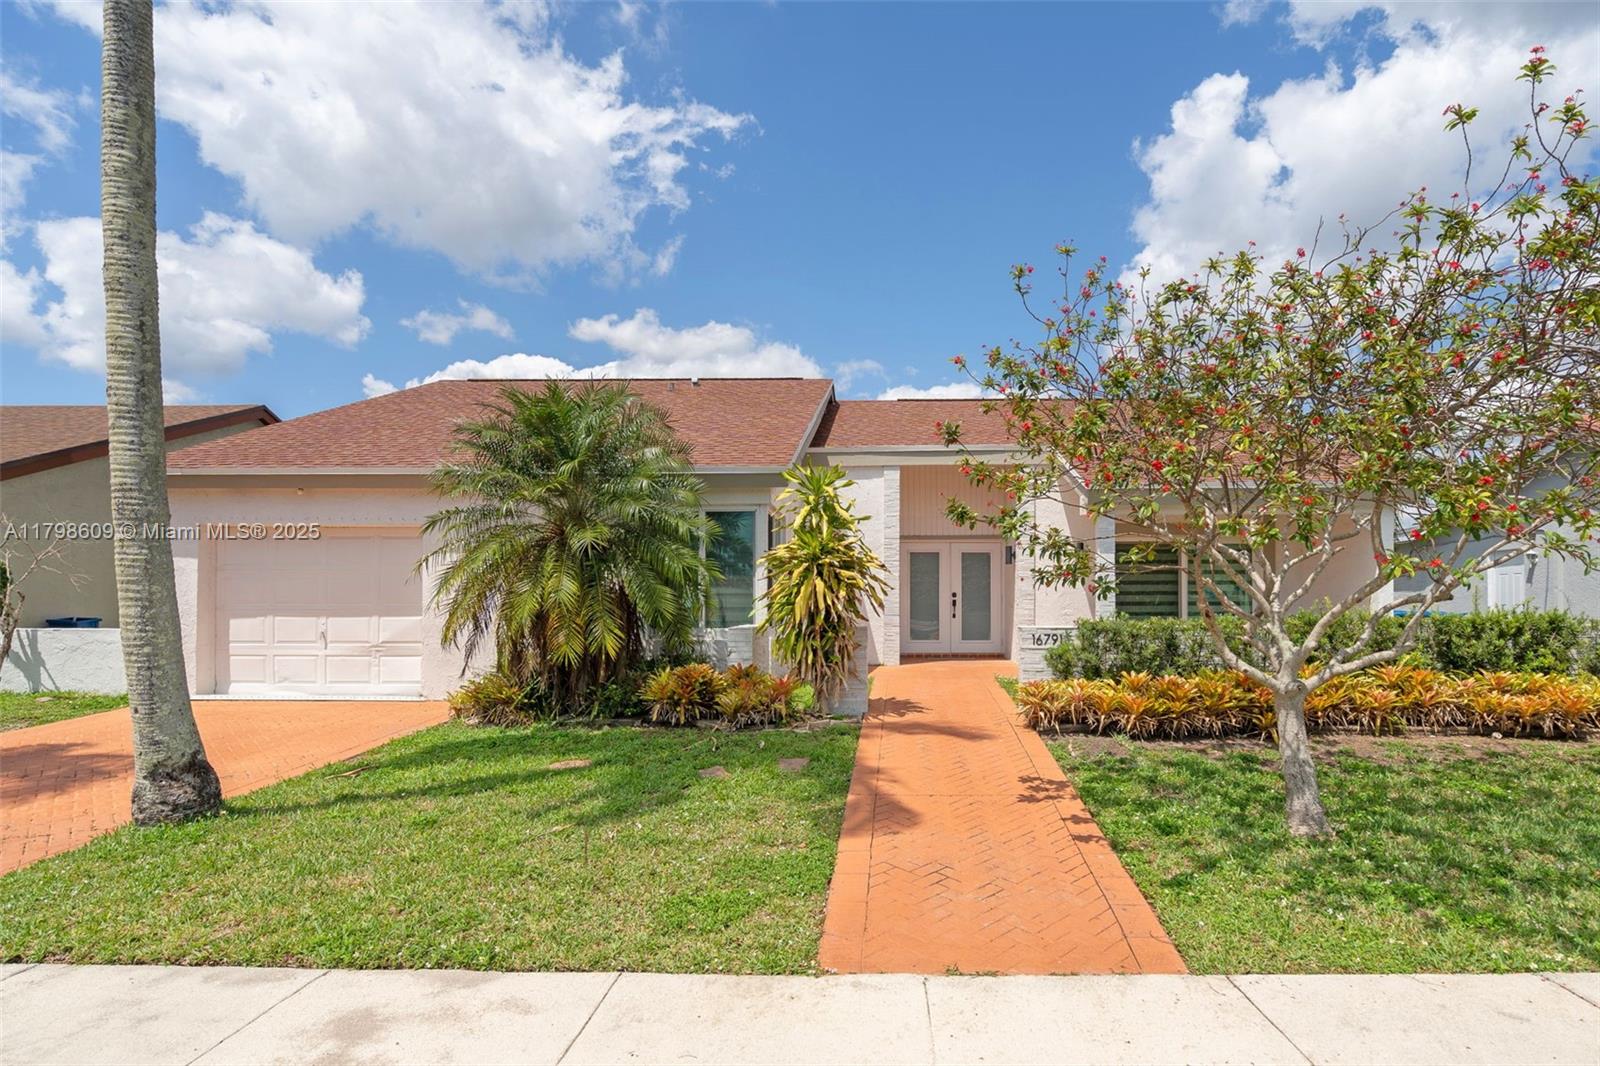
16791 Royal Poinciana Dr, Weston, FL 33326
$-746
Cash flow
-5.2%
Cash-on-Cash Return
5.1%
Cap rate
0.7%
Rent to Value Ratio

Active
$760,000
4
bds
|
3
ba
|
1,915
sqft
|
built
1999
1288 Chinaberry Dr, Weston, FL 33327
$-2,204
Cash flow
-15.1%
Cash-on-Cash Return
2.8%
Cap rate
0.5%
Rent to Value Ratio
Active
$659,000
3
bds
|
2
ba
|
1,542
sqft
|
built
1997
1525 Salerno Cir, Weston, FL 33327
$-1,821
Cash flow
-14.4%
Cash-on-Cash Return
3.0%
Cap rate
0.6%
Rent to Value Ratio
Active
$929,000
5
bds
|
3
ba
|
2,556
sqft
|
built
1993
372 Carrington Dr, Weston, FL 33326
$-2,325
Cash flow
-13.1%
Cash-on-Cash Return
3.3%
Cap rate
0.5%
Rent to Value Ratio
Active
$850,000
4
bds
|
3
ba
|
2,116
sqft
|
built
1999
4458 Stone Ridge Way, Weston, FL 33331
$-2,446
Cash flow
-15.0%
Cash-on-Cash Return
2.8%
Cap rate
0.6%
Rent to Value Ratio
Active
$1,350,000
4
bds
|
4
ba
|
3,465
sqft
|
built
1999
3968 Nighthawk Dr, Weston, FL 33331
$-3,152
Cash flow
-12.2%
Cash-on-Cash Return
3.5%
Cap rate
0.6%
Rent to Value Ratio
Active
$1,175,000
7
bds
|
4
ba
|
3,292
sqft
|
built
2001
1048 Sunflower Cir, Weston, FL 33327
$-3,238
Cash flow
-14.4%
Cash-on-Cash Return
3.0%
Cap rate
0.5%
Rent to Value Ratio
Active
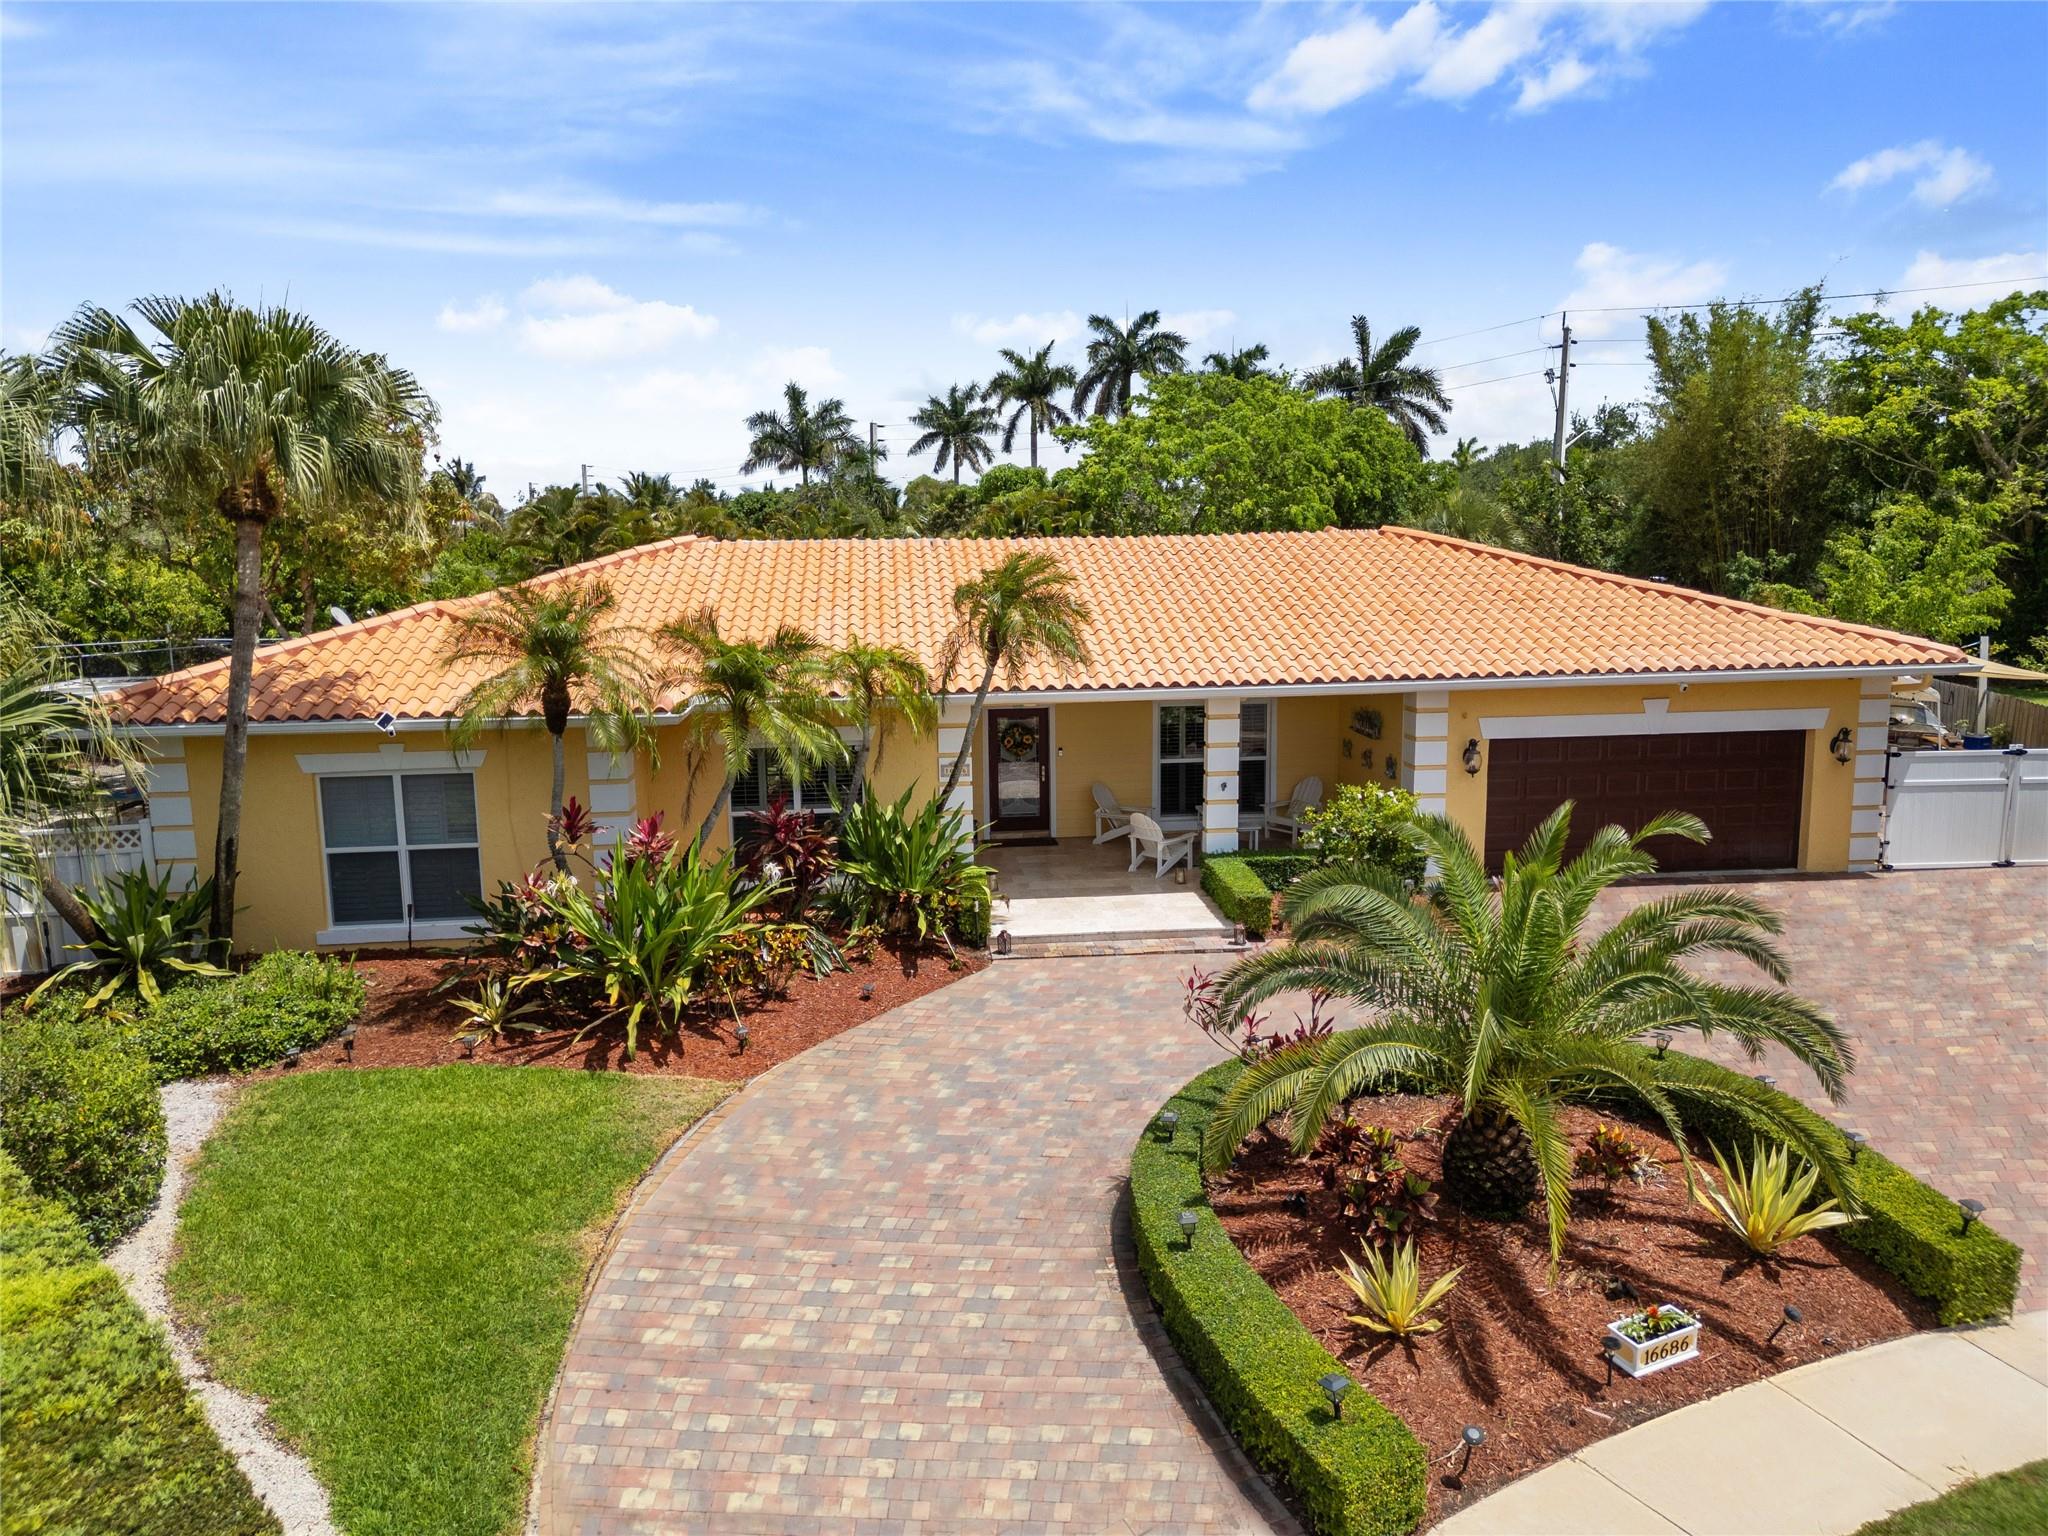
$1,429,000
4
bds
|
3
ba
|
3,892
sqft
|
built
1980
16686 Golfview Dr, Weston, FL 33326
$-4,051
Cash flow
-14.8%
Cash-on-Cash Return
2.9%
Cap rate
0.4%
Rent to Value Ratio
Active
$300,000
2
bds
|
2
ba
|
1,231
sqft
|
built
1980
398 Lakeview Dr, Weston, FL 33326
$-659
Cash flow
-11.5%
Cash-on-Cash Return
3.6%
Cap rate
0.8%
Rent to Value Ratio
Active
$2,700,000
6
bds
|
5
ba
|
4,186
sqft
|
built
1999
2454 Provence Ct, Weston, FL 33327
$-9,649
Cash flow
-18.6%
Cash-on-Cash Return
2.0%
Cap rate
0.4%
Rent to Value Ratio

Active
$875,000
4
bds
|
3
ba
|
1,802
sqft
|
built
1999
1381 Sago Ln, Weston, FL 33327
$-2,546
Cash flow
-15.2%
Cash-on-Cash Return
2.8%
Cap rate
0.5%
Rent to Value Ratio
Active
$899,000
4
bds
|
3
ba
|
2,812
sqft
|
built
1998
16727 Sapphire Isle, Weston, FL 33331
$-2,130
Cash flow
-12.4%
Cash-on-Cash Return
3.4%
Cap rate
0.6%
Rent to Value Ratio
Active
$3,495,000
5
bds
|
6
ba
|
4,820
sqft
|
built
1997
2531 Royal Palm Way, Weston, FL 33327
$-14,147
Cash flow
-21.1%
Cash-on-Cash Return
1.4%
Cap rate
0.3%
Rent to Value Ratio