Weston, FL Investment Properties for Sale
Browse homes for sale and investment properties in Weston, FL. Refine your search by price, property type, or more.
Best cash flowing properties in Weston, FL
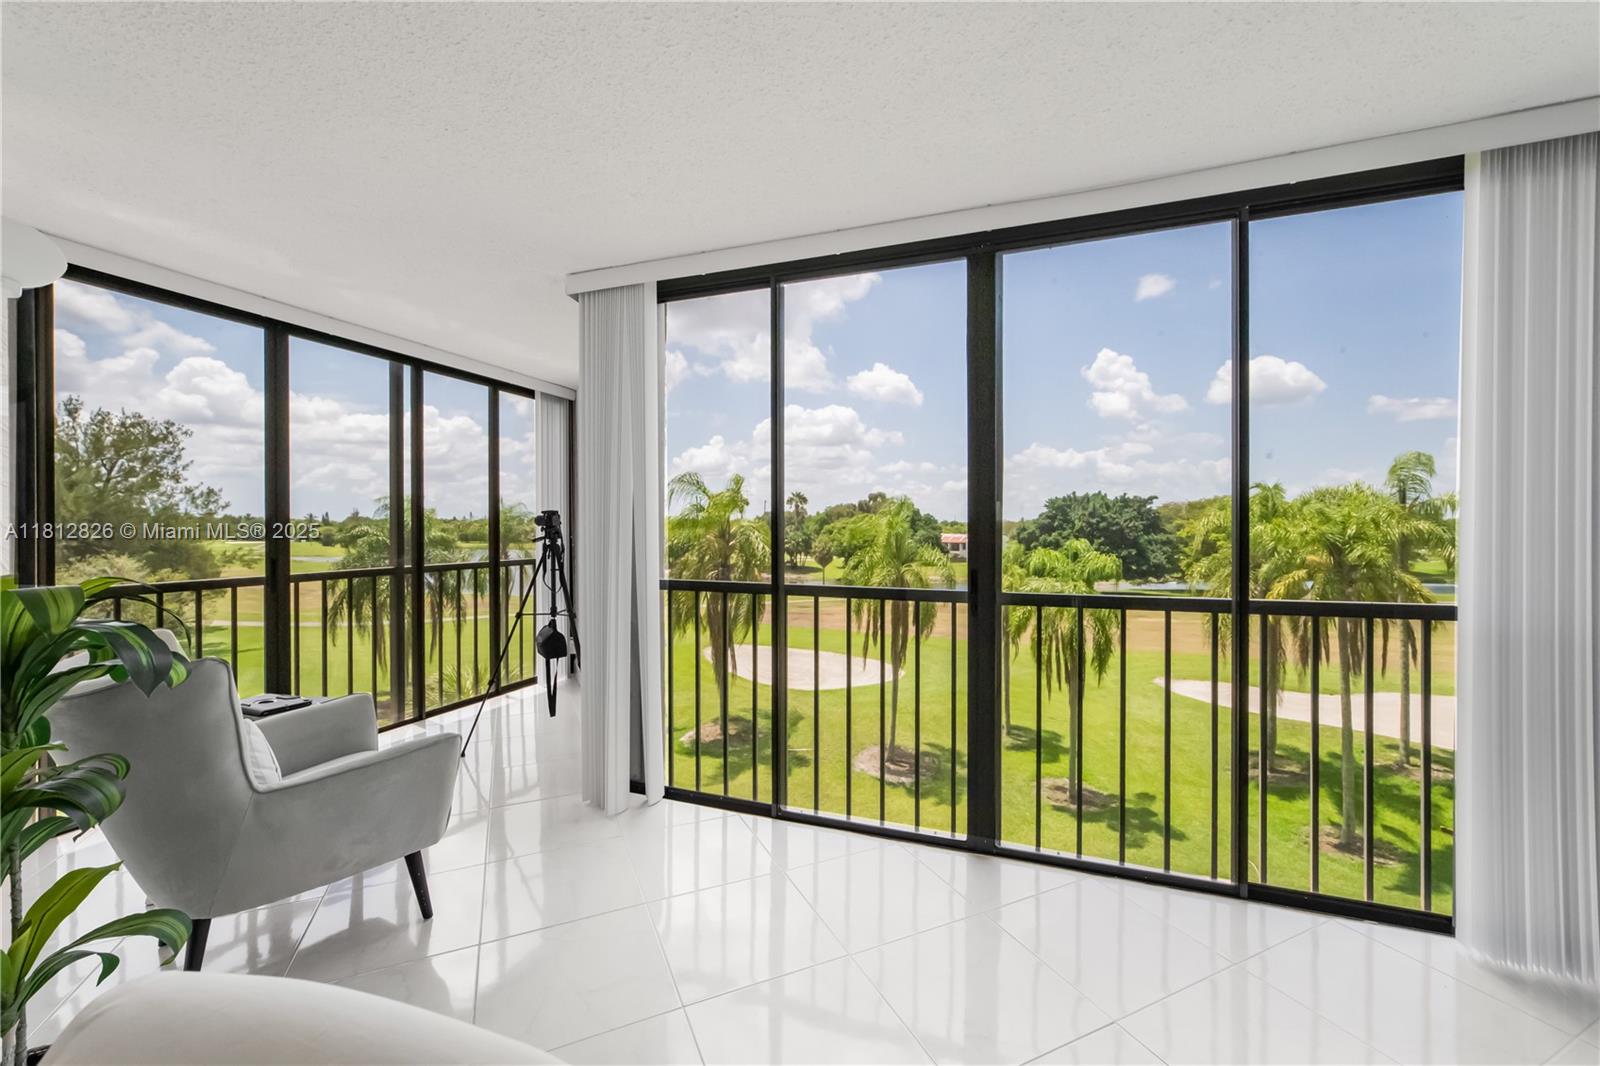
Active
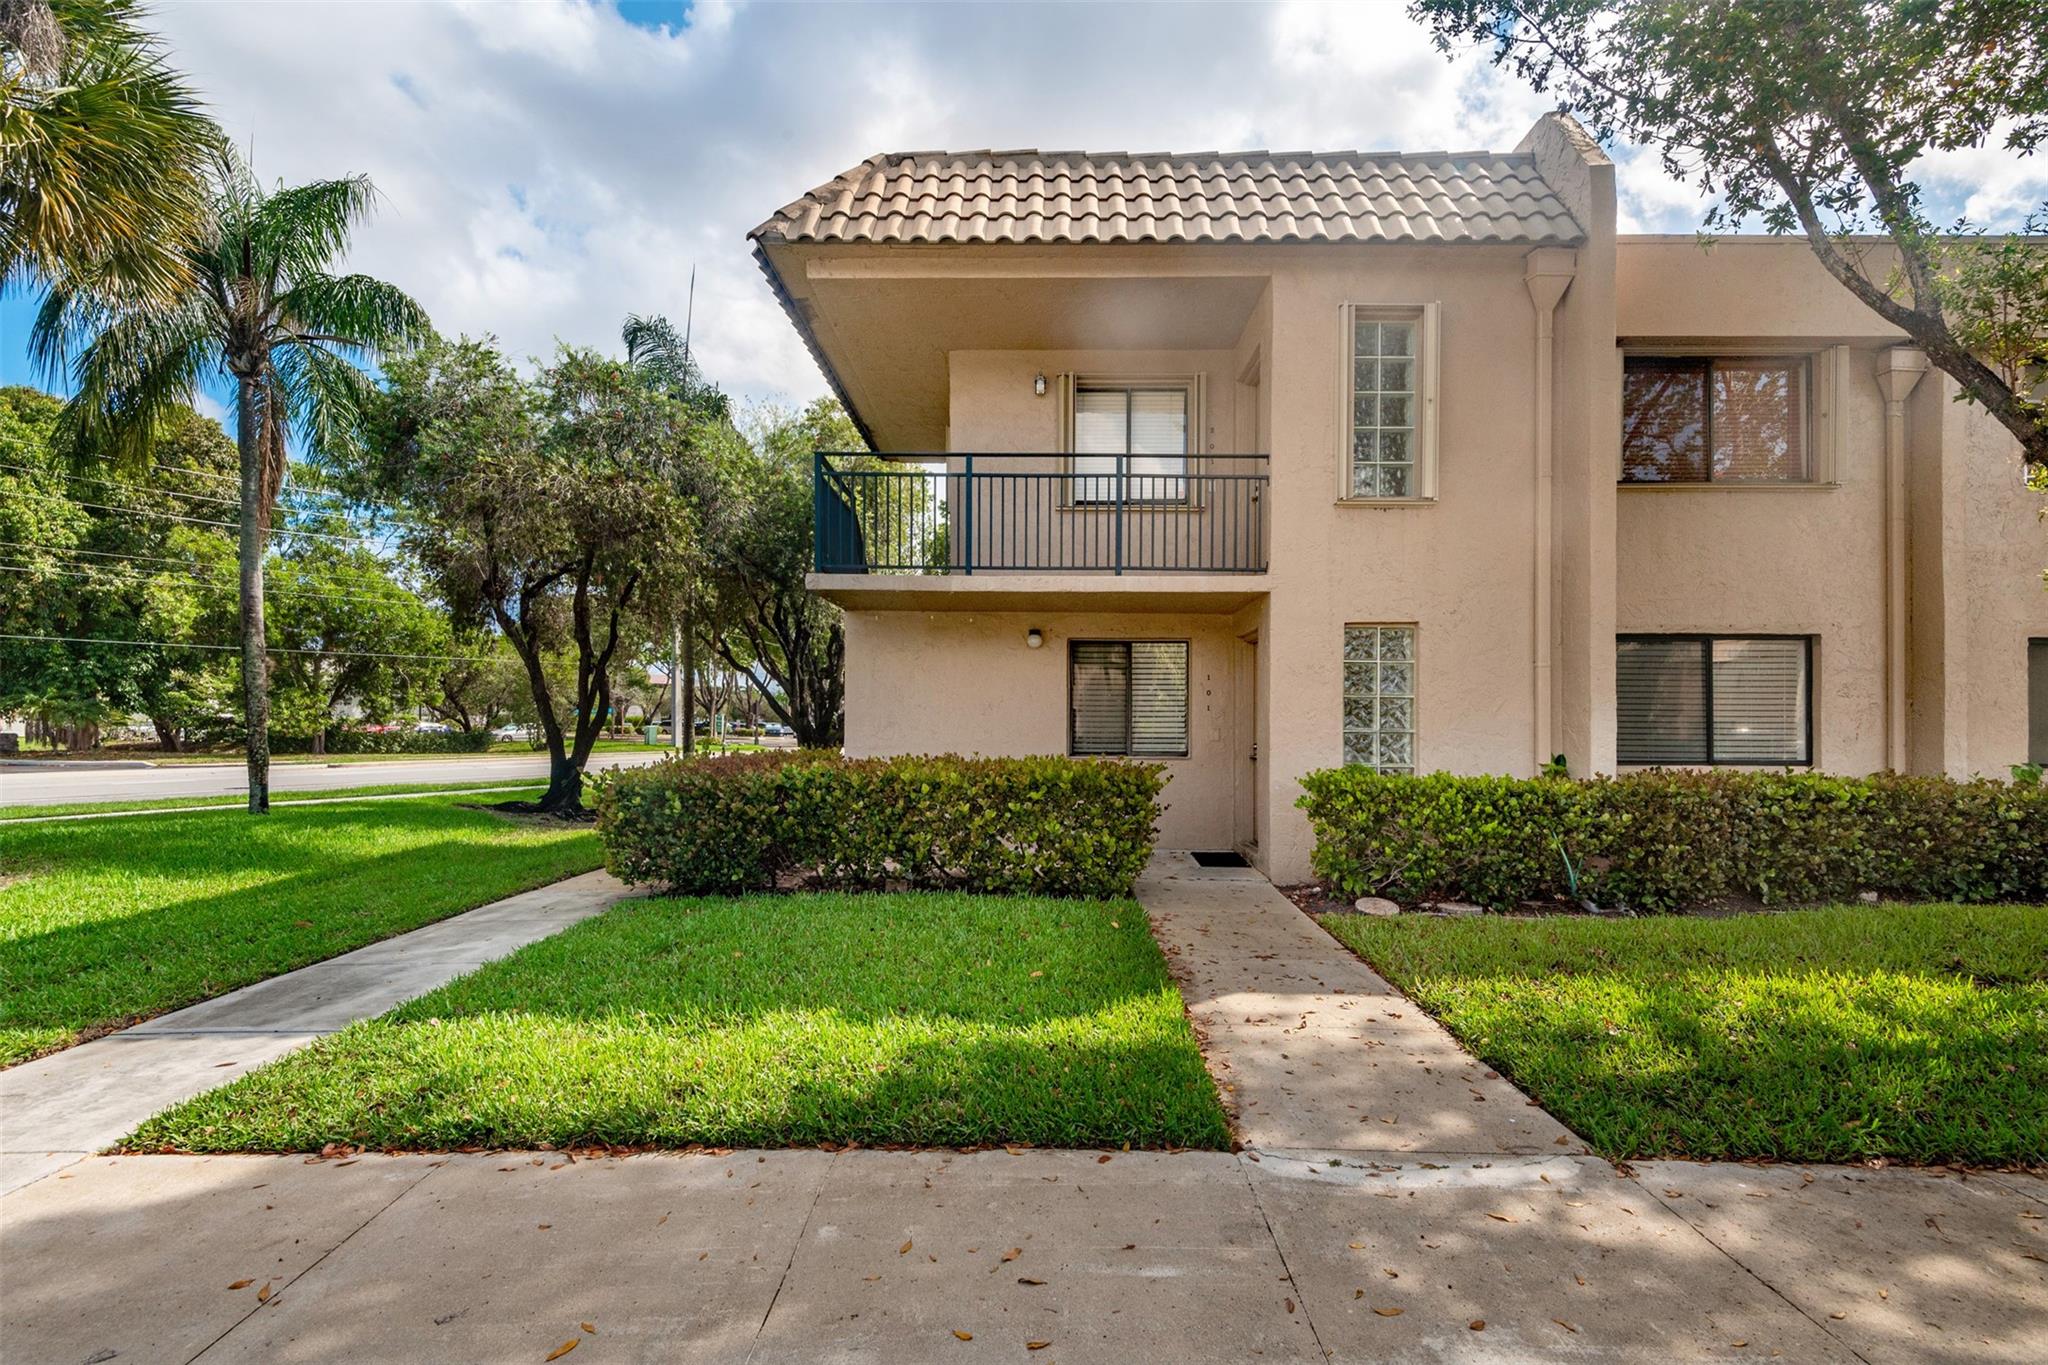
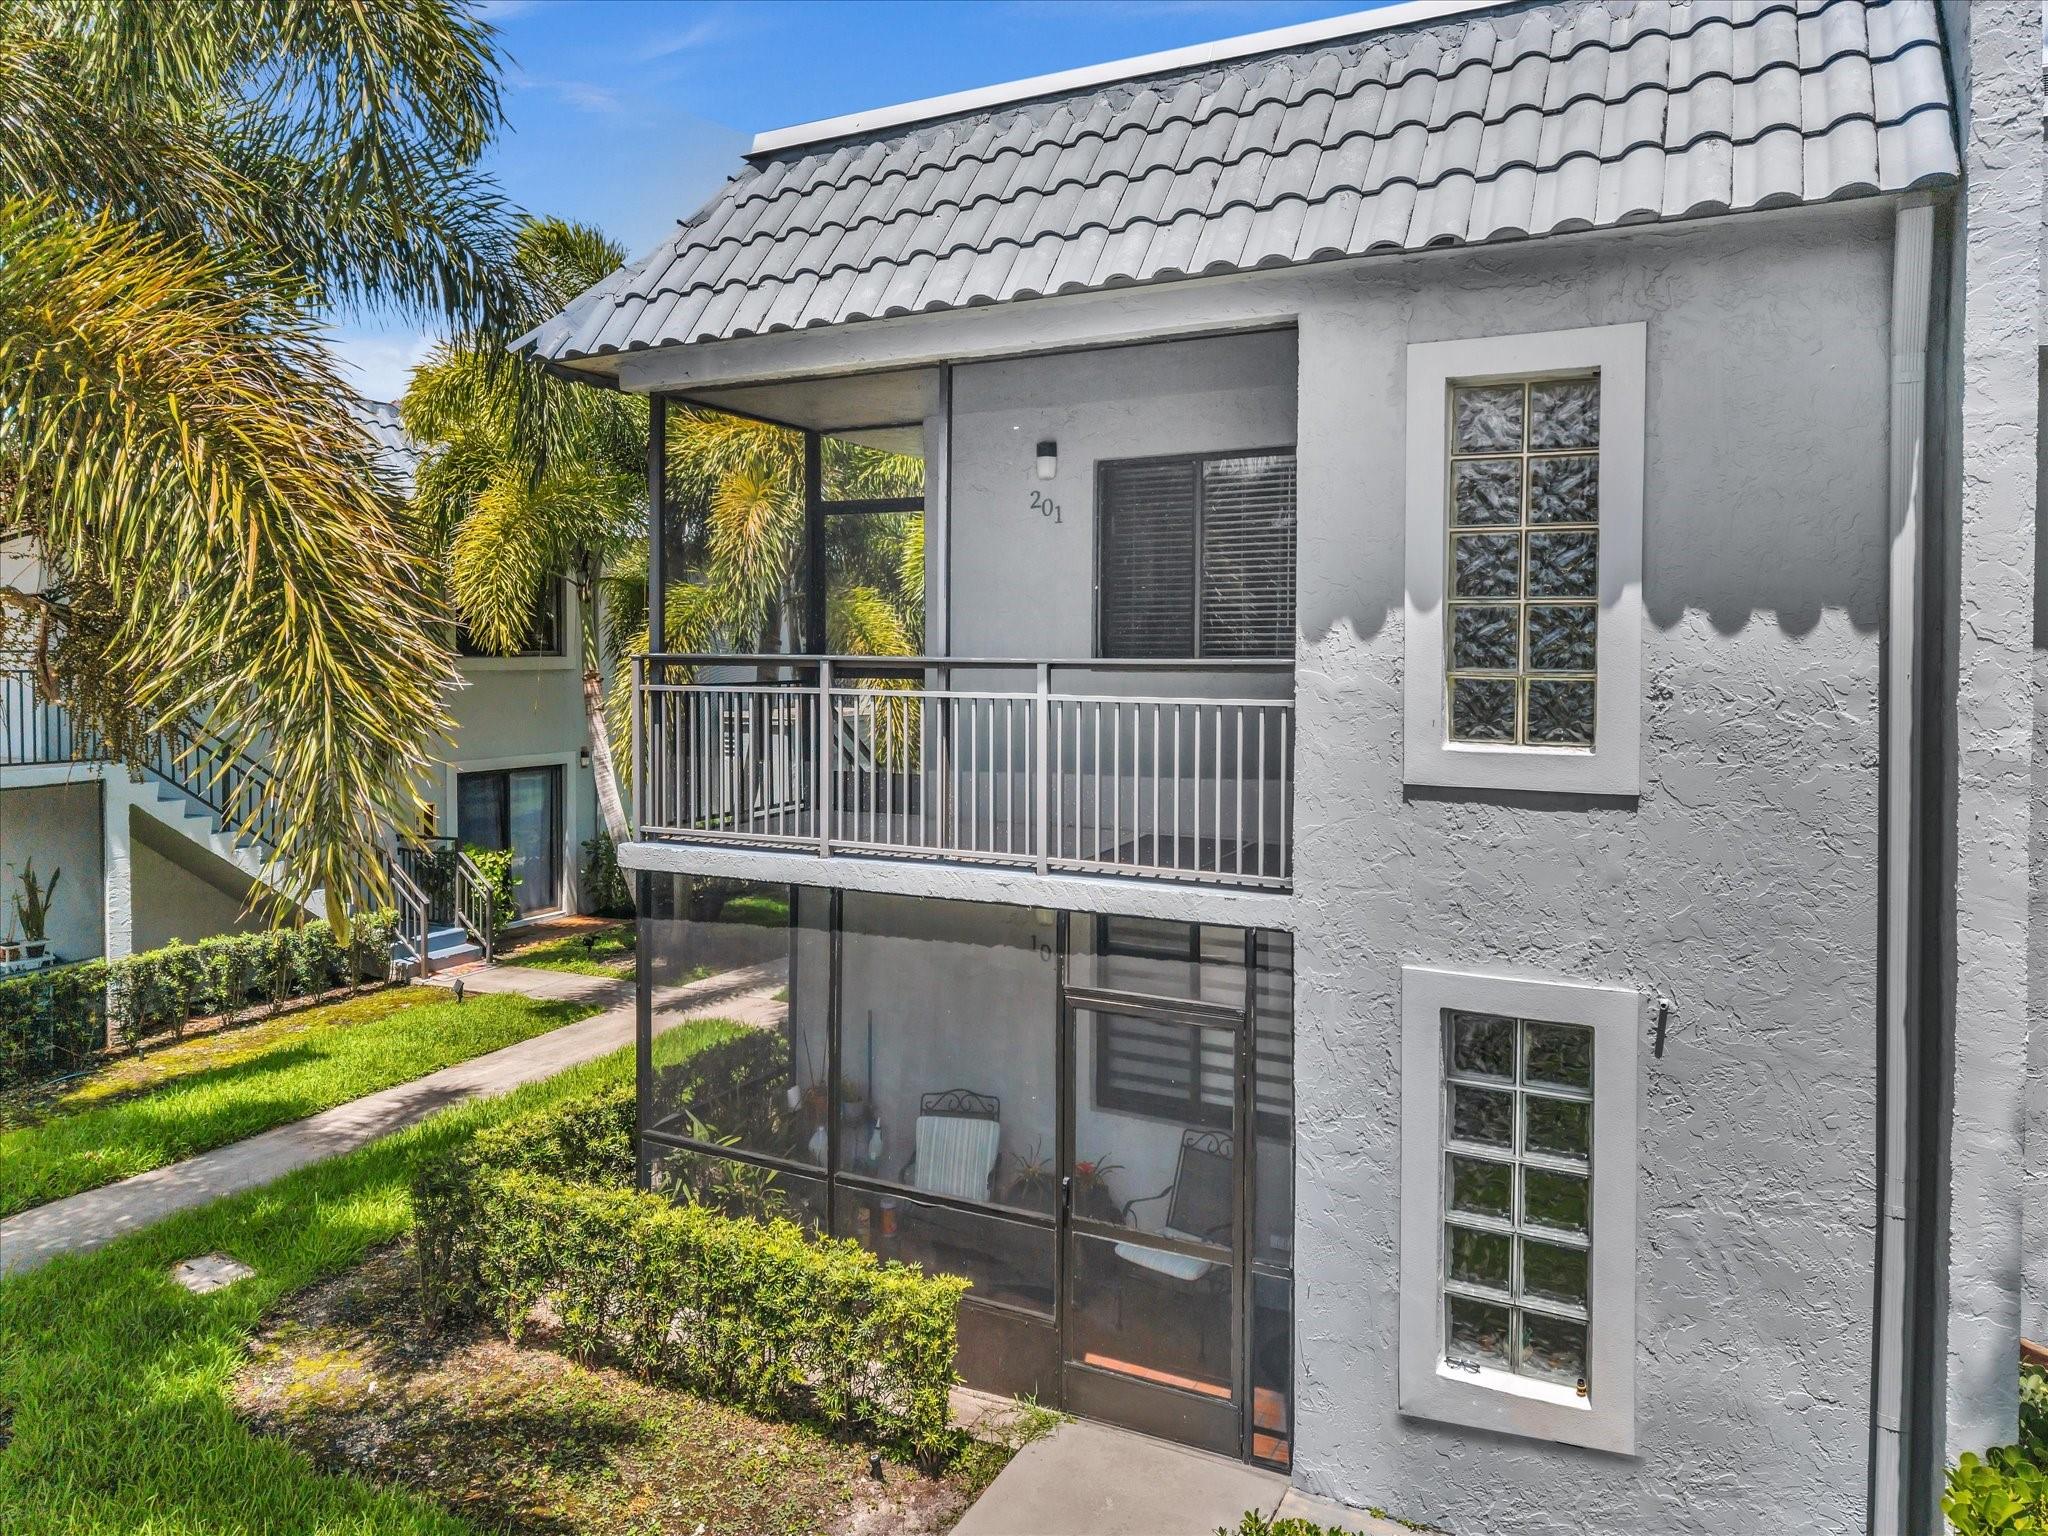
$330,000
2
bds
|
2
ba
|
1,320
sqft
|
built
1980
340 Racquet Club Rd, Weston, FL 33326
$-546
Cash flow
-8.6%
Cash-on-Cash Return
4.3%
Cap rate
0.7%
Rent to Value Ratio
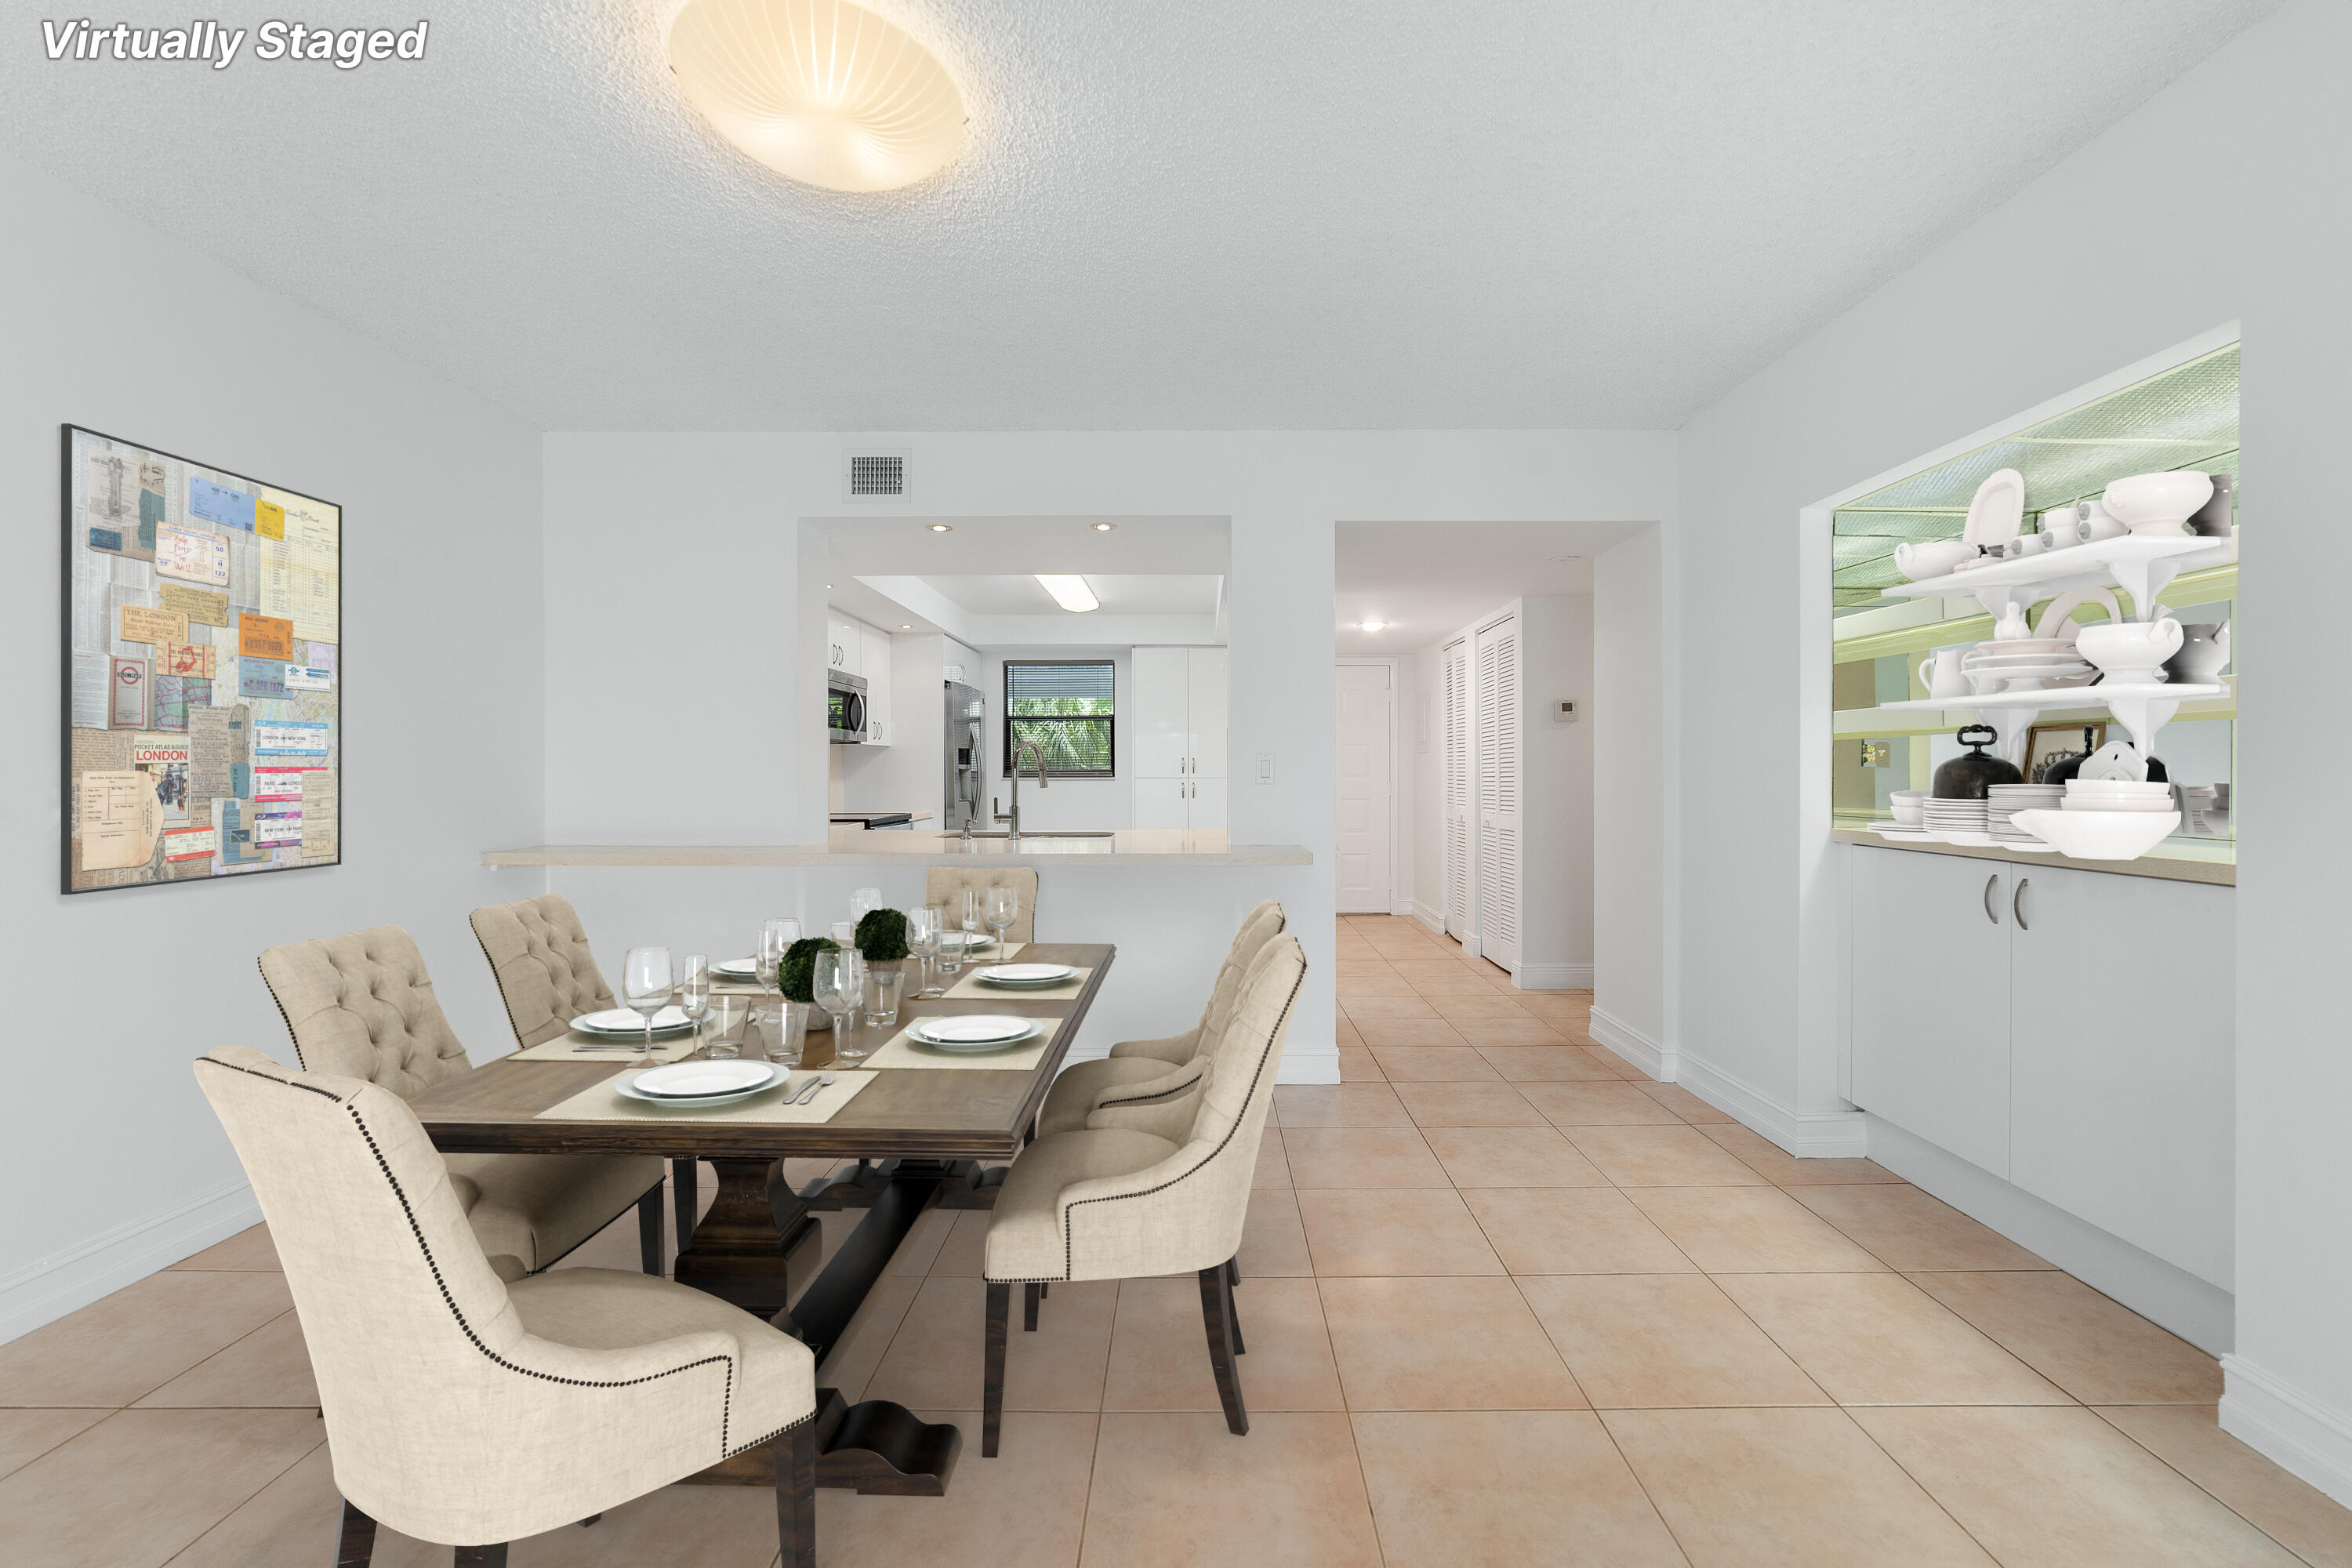
Active
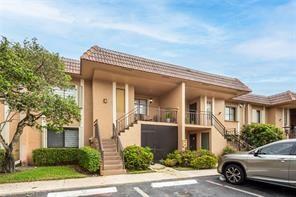
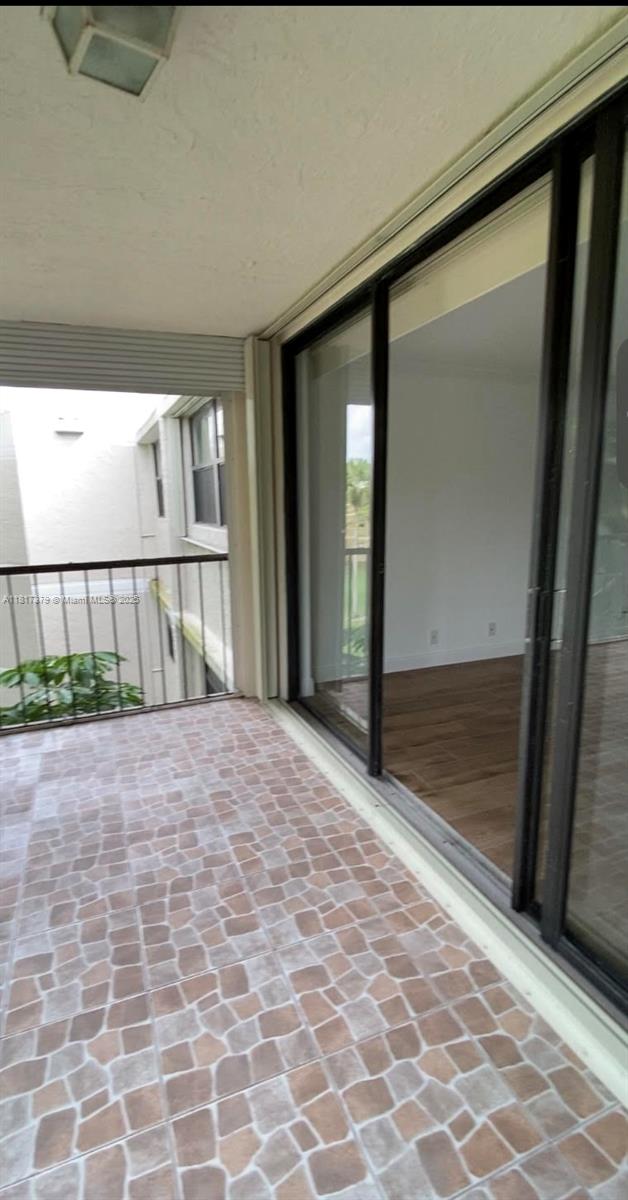
$350,000
2
bds
|
2
ba
|
1,225
sqft
|
built
1979
193 Lakeview Dr, Weston, FL 33326
$-676
Cash flow
-10.1%
Cash-on-Cash Return
4.0%
Cap rate
0.7%
Rent to Value Ratio
315 out of 333 properties for sale in Weston, FL
Limited Results Shown
Create a free account, or log in to reveal all property listings and enjoy the complete experience.
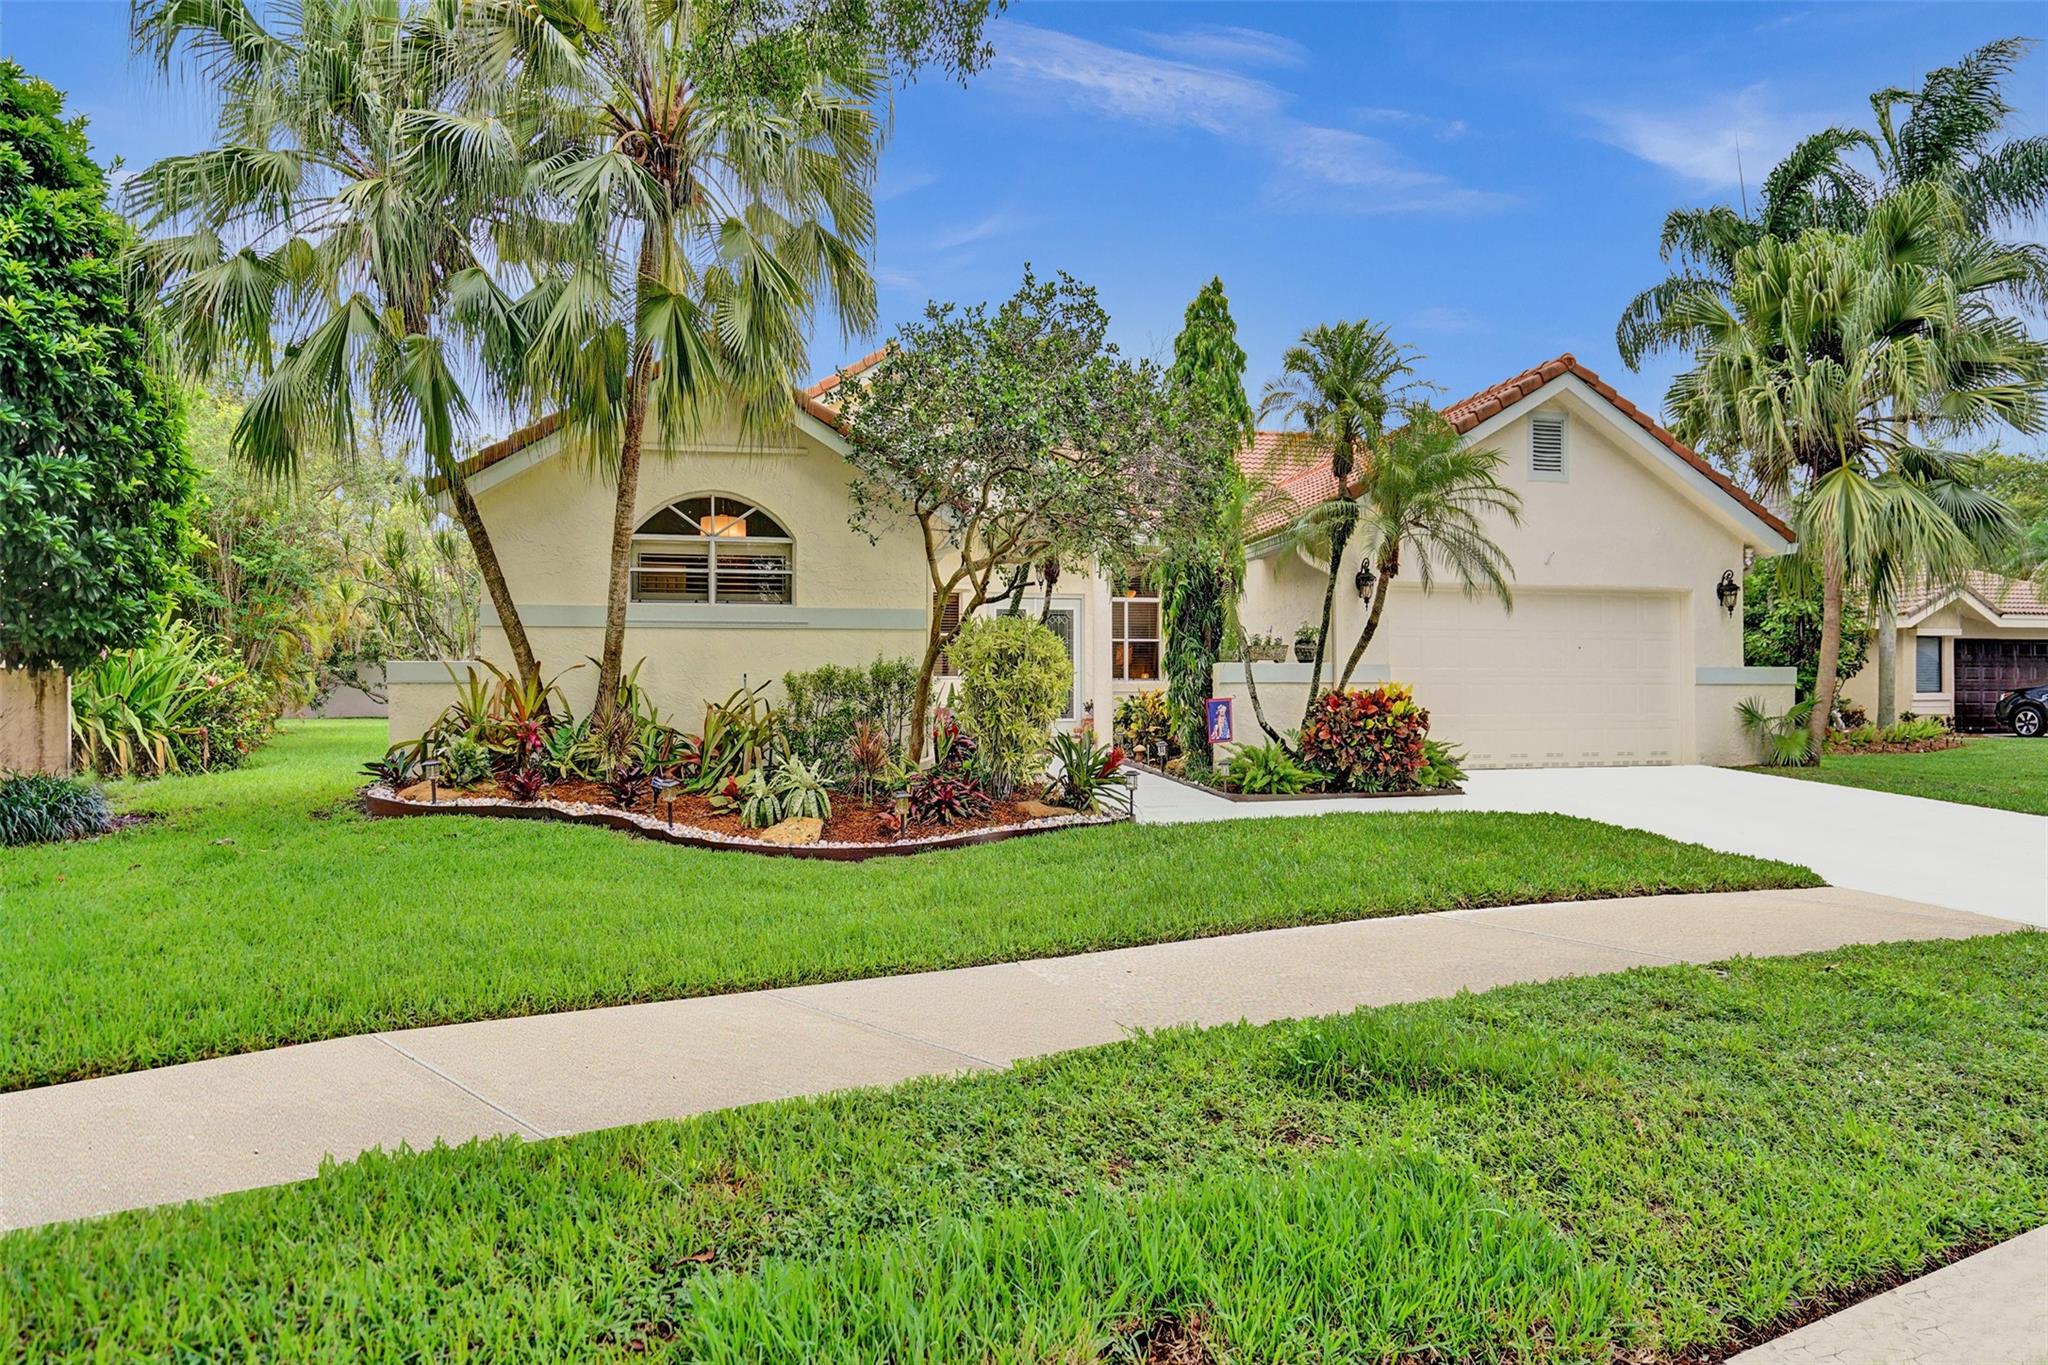
Active
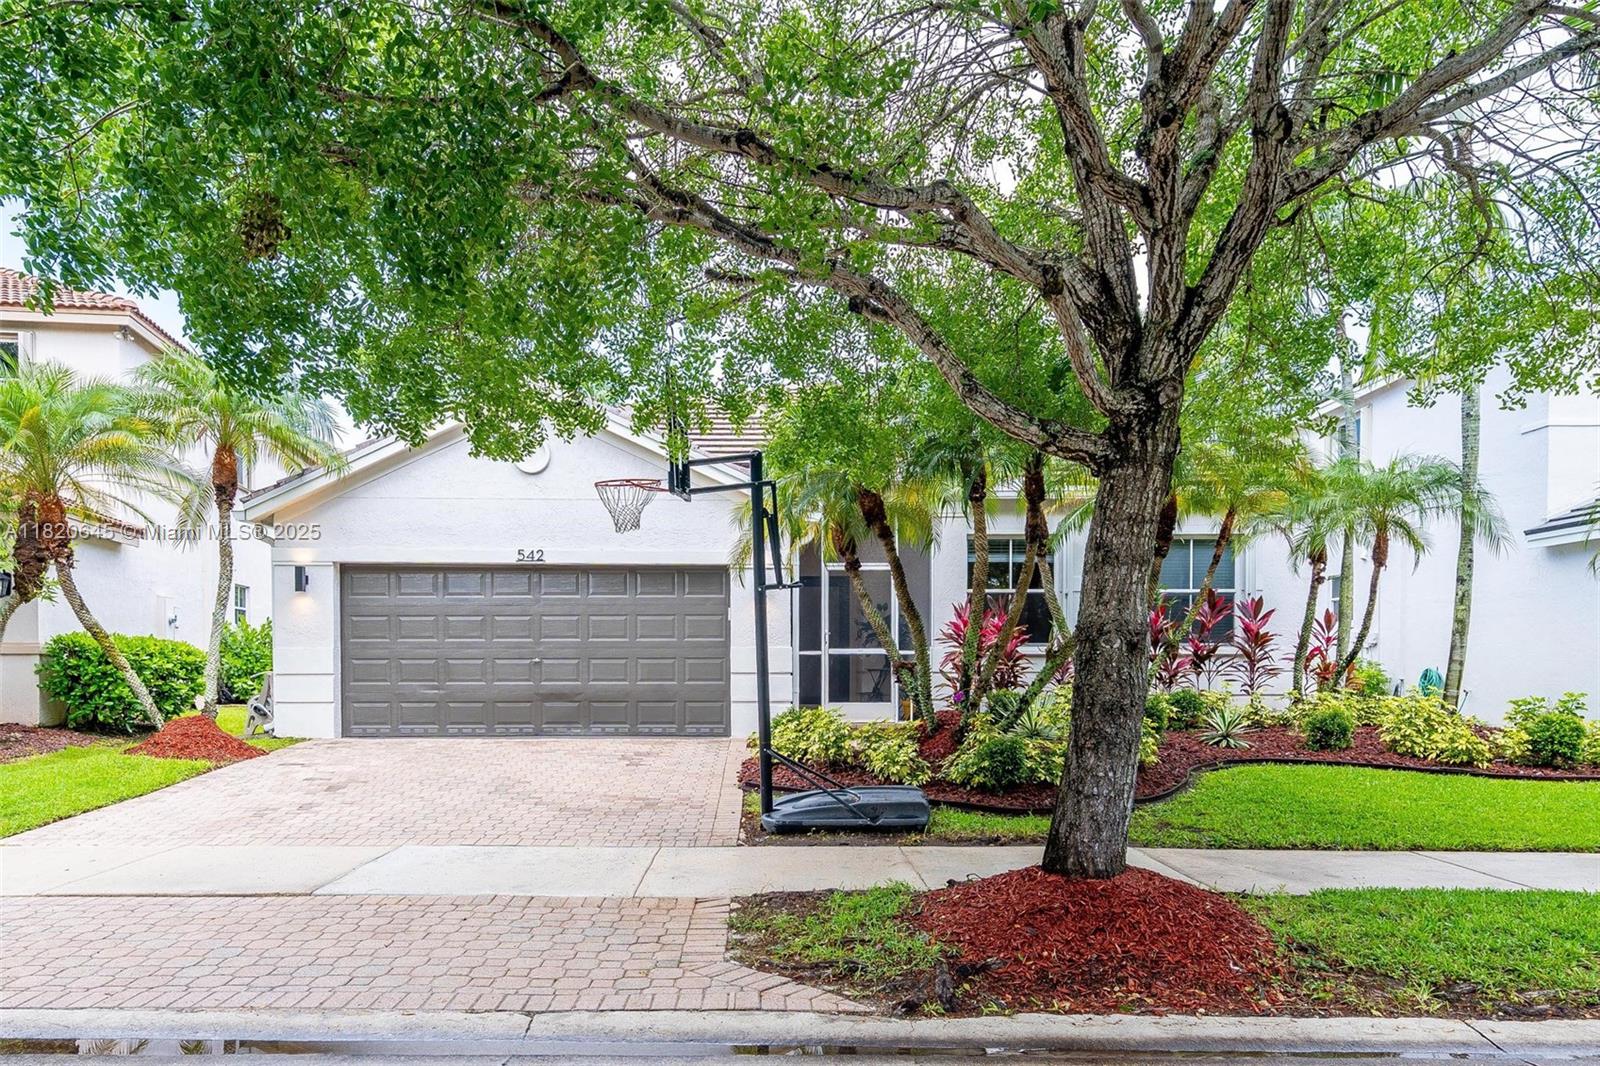
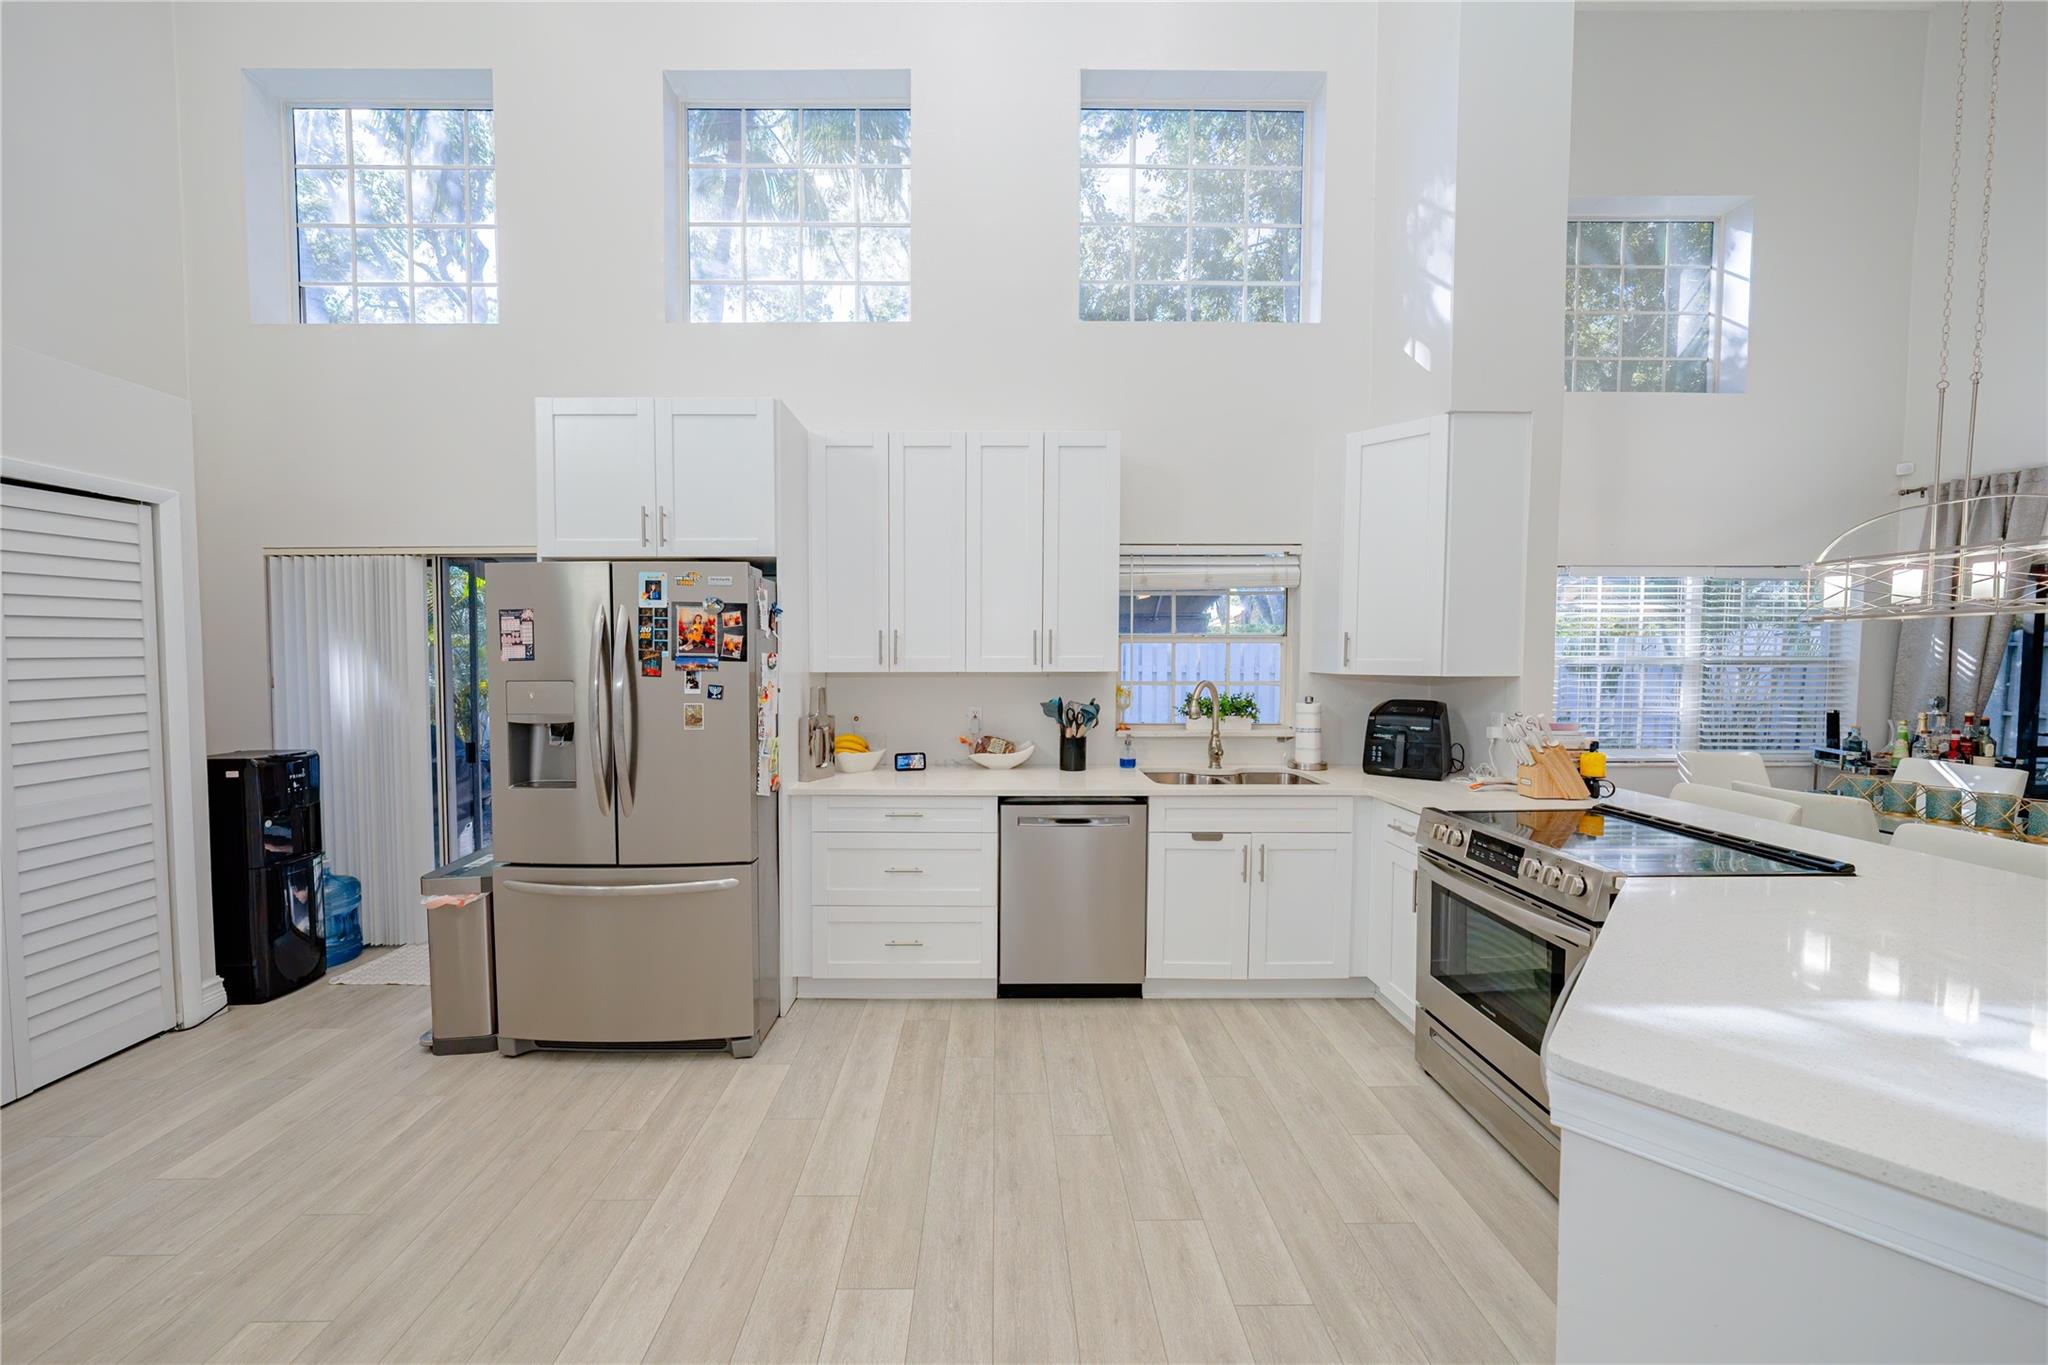
$800,000
4
bds
|
2
ba
|
1,876
sqft
|
built
2001
542 Penta Ct, Weston, FL 33327
$-2,083
Cash flow
-13.6%
Cash-on-Cash Return
3.2%
Cap rate
0.6%
Rent to Value Ratio
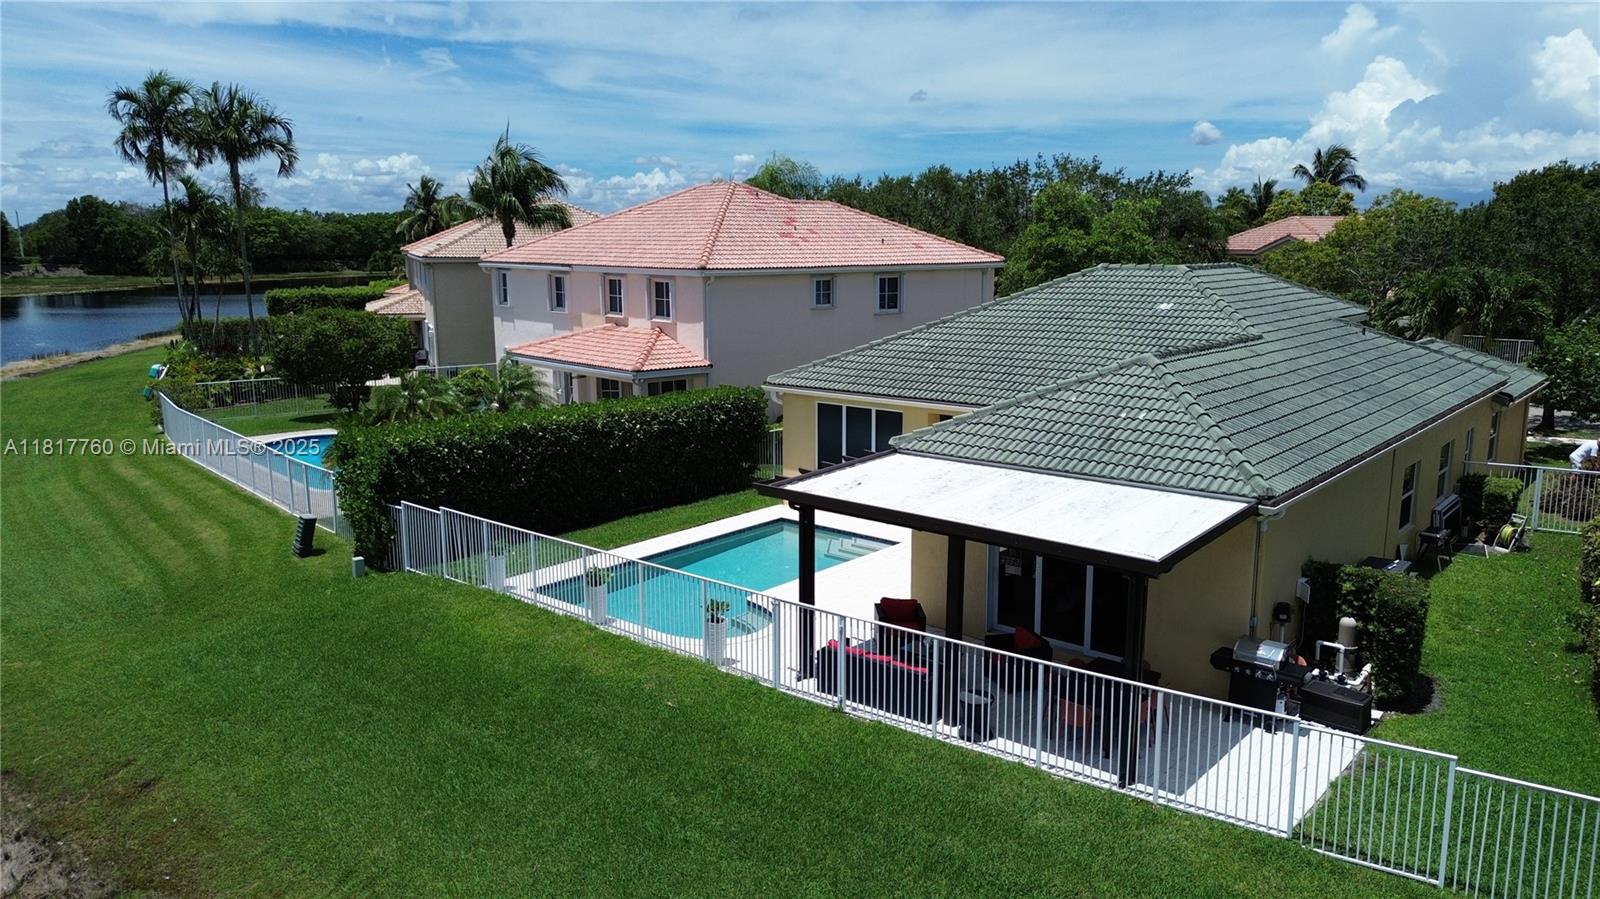
Active
$720,000
3
bds
|
3
ba
|
1,722
sqft
|
built
1990
533 Bedford Ave, Weston, FL 33326
$-1,390
Cash flow
-10.1%
Cash-on-Cash Return
4.0%
Cap rate
0.6%
Rent to Value Ratio

Active
$360,000
2
bds
|
2
ba
|
1,090
sqft
|
built
1976
100 Lakeview Dr, Weston, FL 33326
$-52,923
Cash flow
-767.0%
Cash-on-Cash Return
-170.1%
Cap rate
0.7%
Rent to Value Ratio

Active
$820,000
4
bds
|
3
ba
|
1,978
sqft
|
built
2000
1753 Aspen Ln, Weston, FL 33327
$-2,327
Cash flow
-14.8%
Cash-on-Cash Return
2.9%
Cap rate
0.5%
Rent to Value Ratio
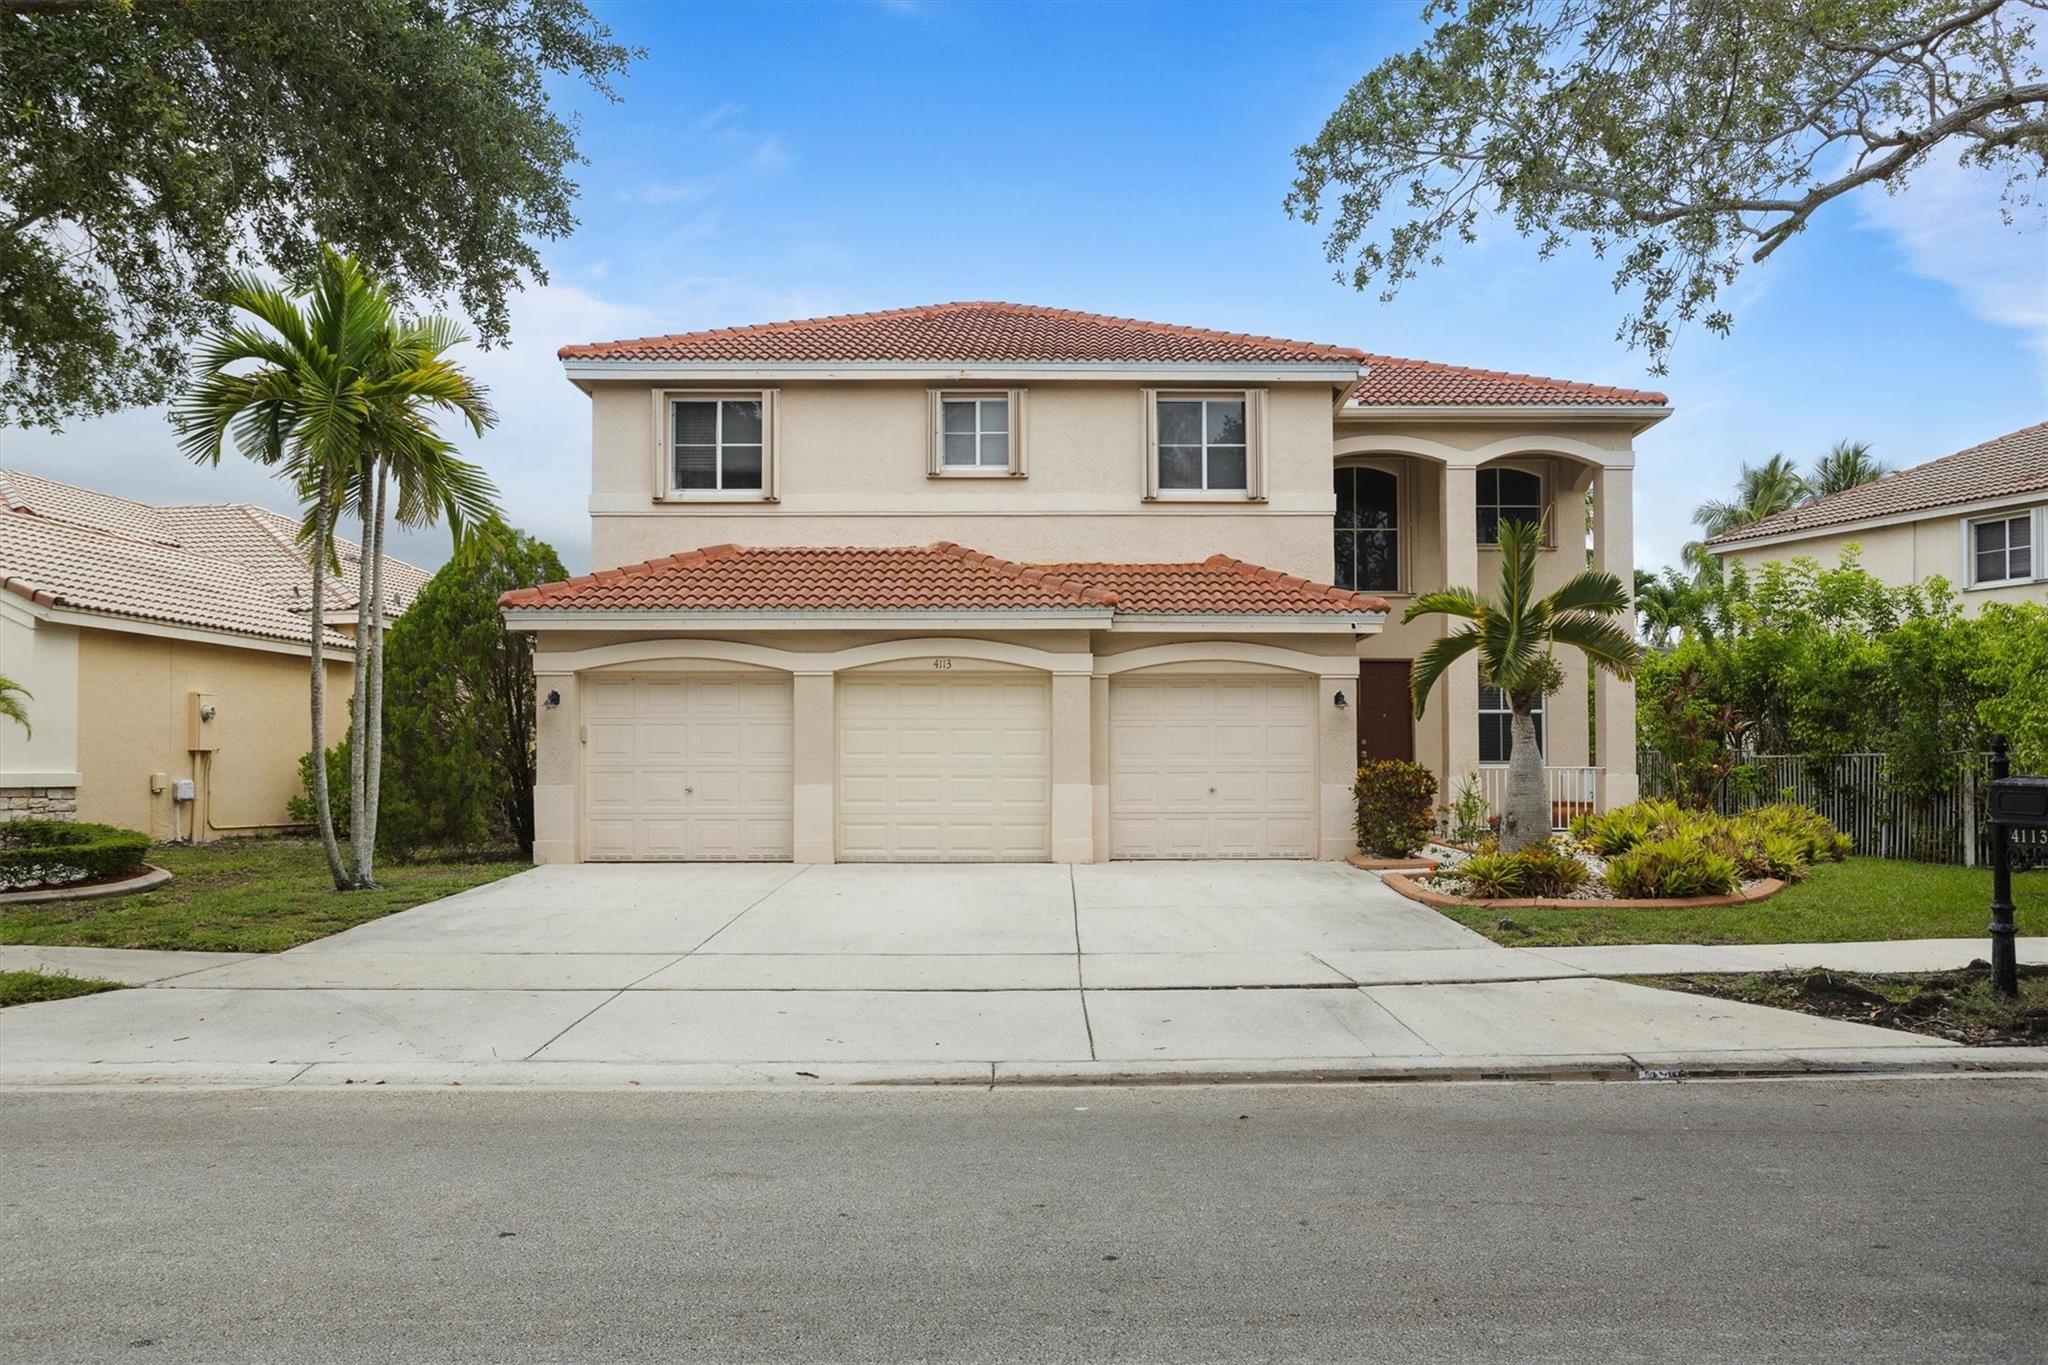
Active under contract
$950,000
6
bds
|
4
ba
|
3,030
sqft
|
built
1997
4113 Staghorn Ln, Weston, FL 33331
$-1,853
Cash flow
-10.2%
Cash-on-Cash Return
3.9%
Cap rate
0.7%
Rent to Value Ratio
Active
$2,400,000
4
bds
|
6
ba
|
4,748
sqft
|
built
2006
15093 SW 16th St, Weston, FL 33326
$-8,413
Cash flow
-18.3%
Cash-on-Cash Return
2.1%
Cap rate
0.5%
Rent to Value Ratio
Active
$2,875,000
4
bds
|
6
ba
|
3,437
sqft
|
built
2020
16639 Botaniko Dr N, Weston, FL 33326
$-10,914
Cash flow
-19.8%
Cash-on-Cash Return
1.7%
Cap rate
0.4%
Rent to Value Ratio
Active under contract
$735,000
3
bds
|
2
ba
|
1,866
sqft
|
built
1994
2060 Island Cir, Weston, FL 33326
$-2,236
Cash flow
-15.9%
Cash-on-Cash Return
2.6%
Cap rate
0.5%
Rent to Value Ratio
Active
$1,075,000
4
bds
|
3
ba
|
2,776
sqft
|
built
1993
1971 Landing Way, Weston, FL 33326
$-2,490
Cash flow
-12.1%
Cash-on-Cash Return
3.5%
Cap rate
0.6%
Rent to Value Ratio
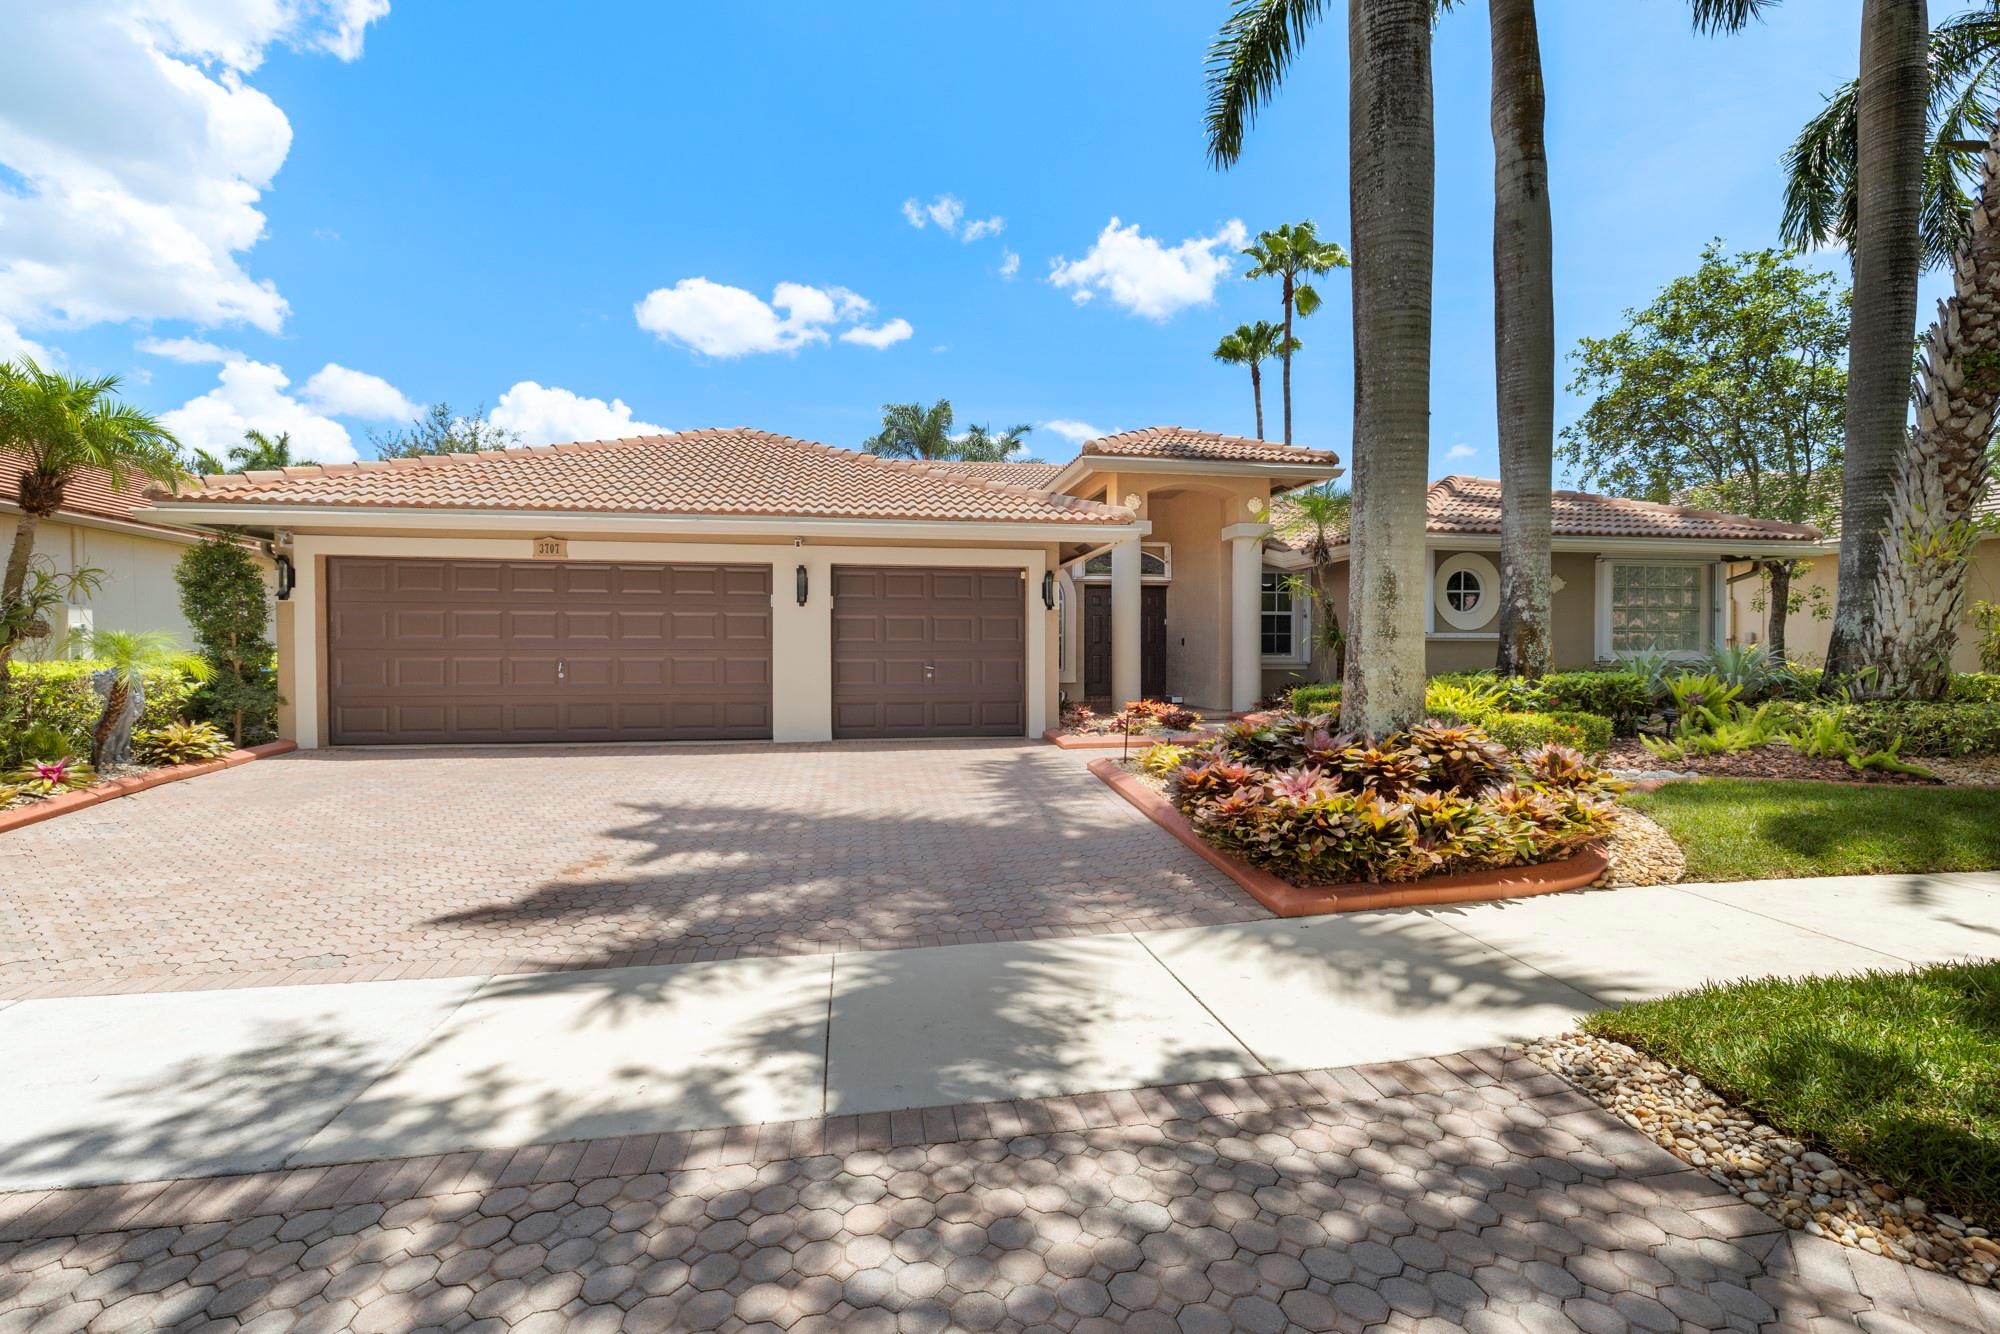
Active
$1,239,000
5
bds
|
3
ba
|
2,587
sqft
|
built
1996
3707 Oak Ridge Cir, Weston, FL 33331
$-3,114
Cash flow
-13.1%
Cash-on-Cash Return
3.3%
Cap rate
0.5%
Rent to Value Ratio
Active
$1,030,000
4
bds
|
3
ba
|
2,487
sqft
|
built
1982
16530 Royal Poinciana Ct, Weston, FL 33326
$-2,821
Cash flow
-14.3%
Cash-on-Cash Return
3.0%
Cap rate
0.5%
Rent to Value Ratio
Active
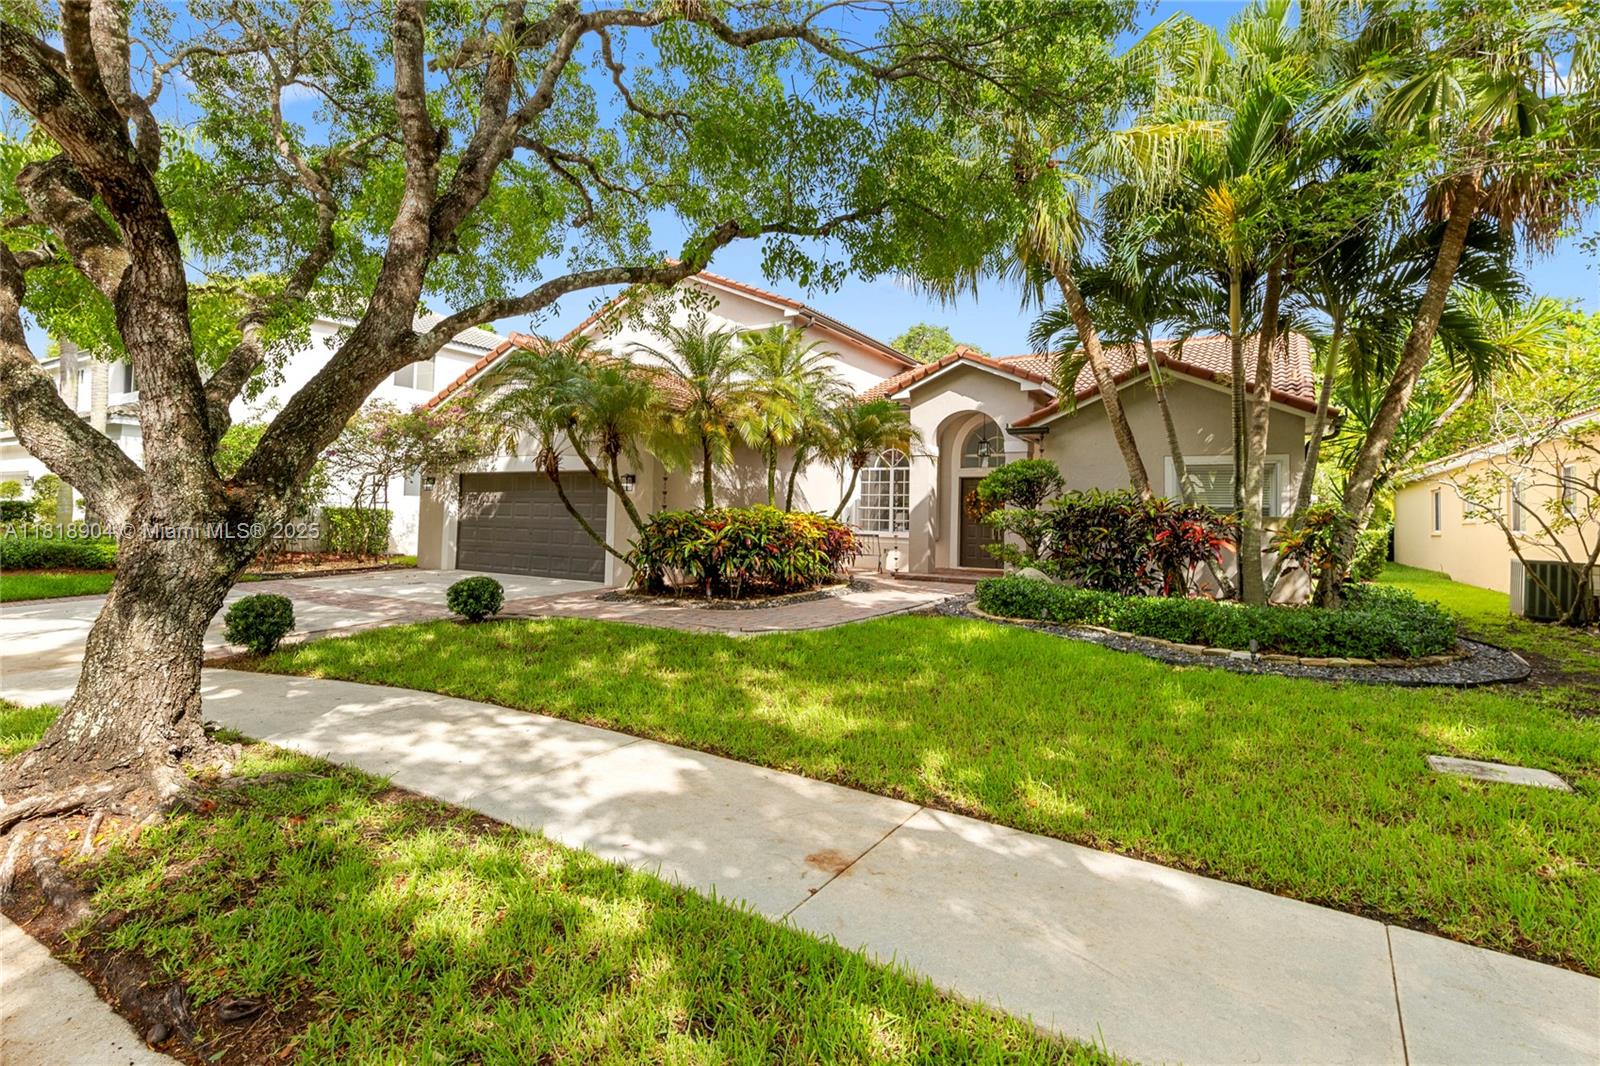
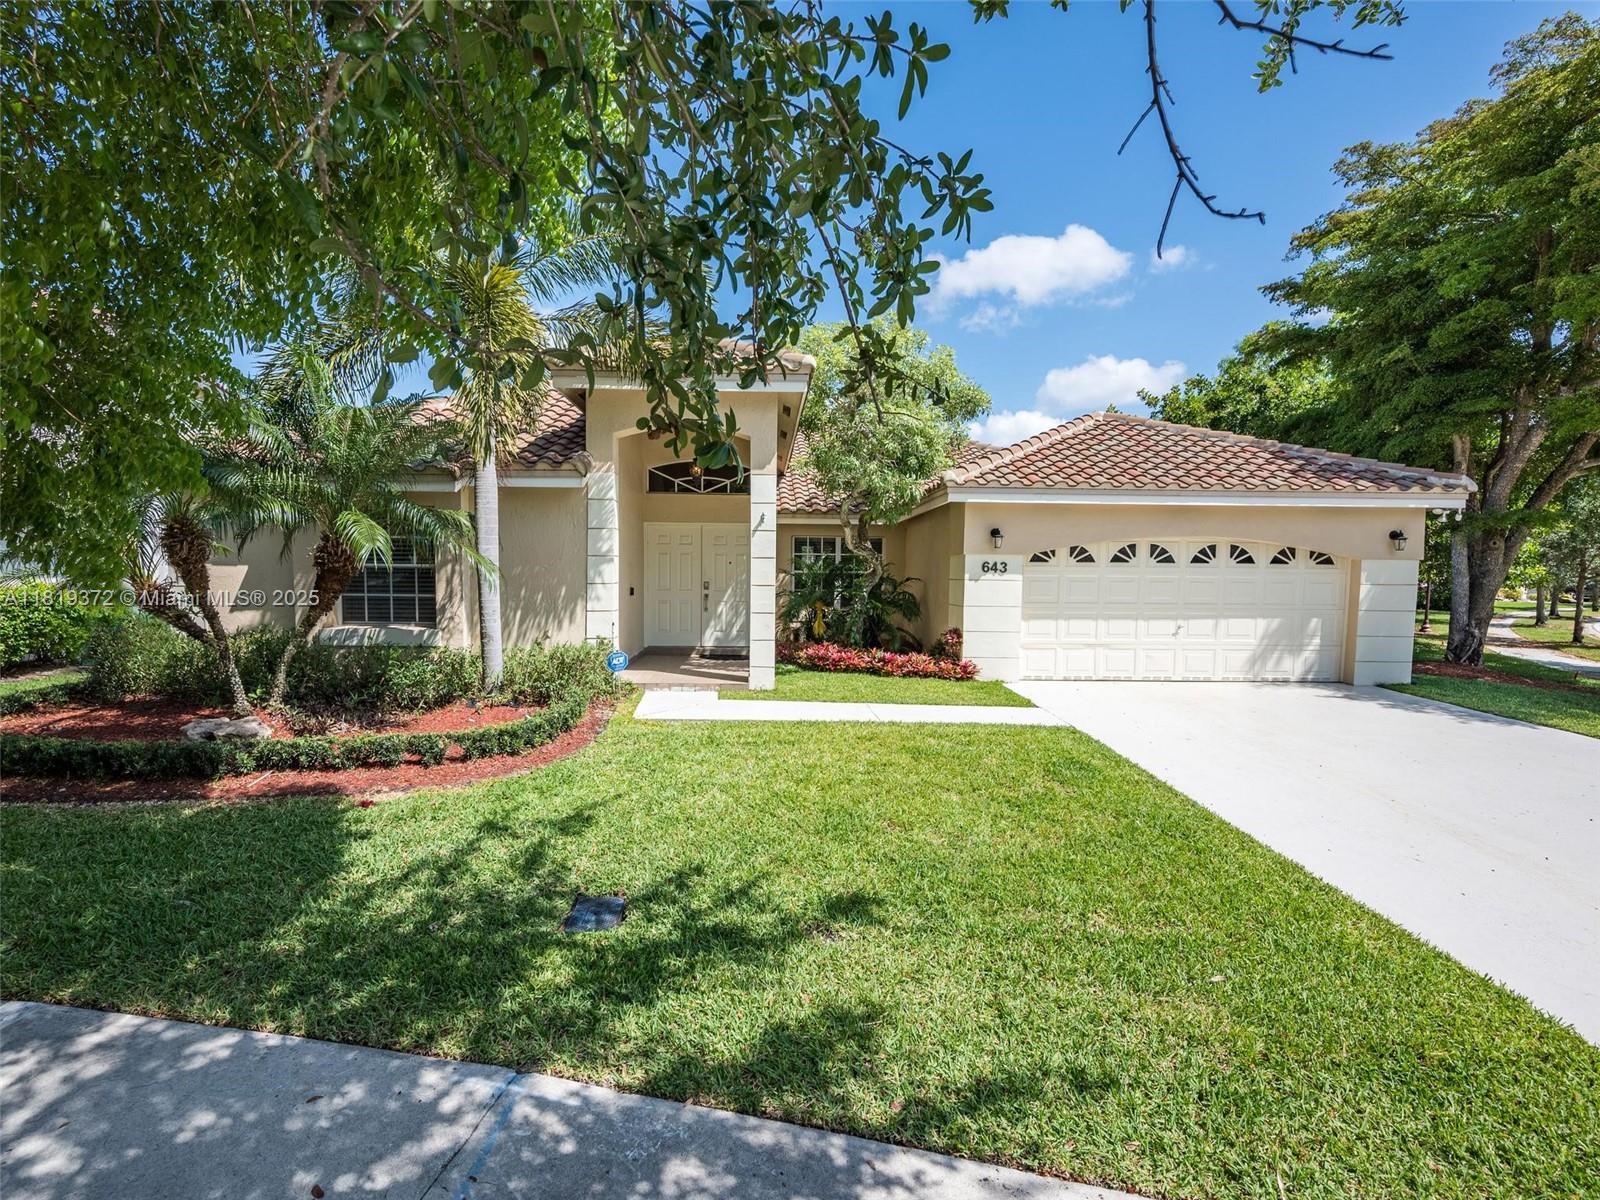
$1,199,000
5
bds
|
4
ba
|
2,852
sqft
|
built
1993
643 Lake Blvd, Weston, FL 33326
$-2,154
Cash flow
-9.4%
Cash-on-Cash Return
4.1%
Cap rate
0.7%
Rent to Value Ratio
Active
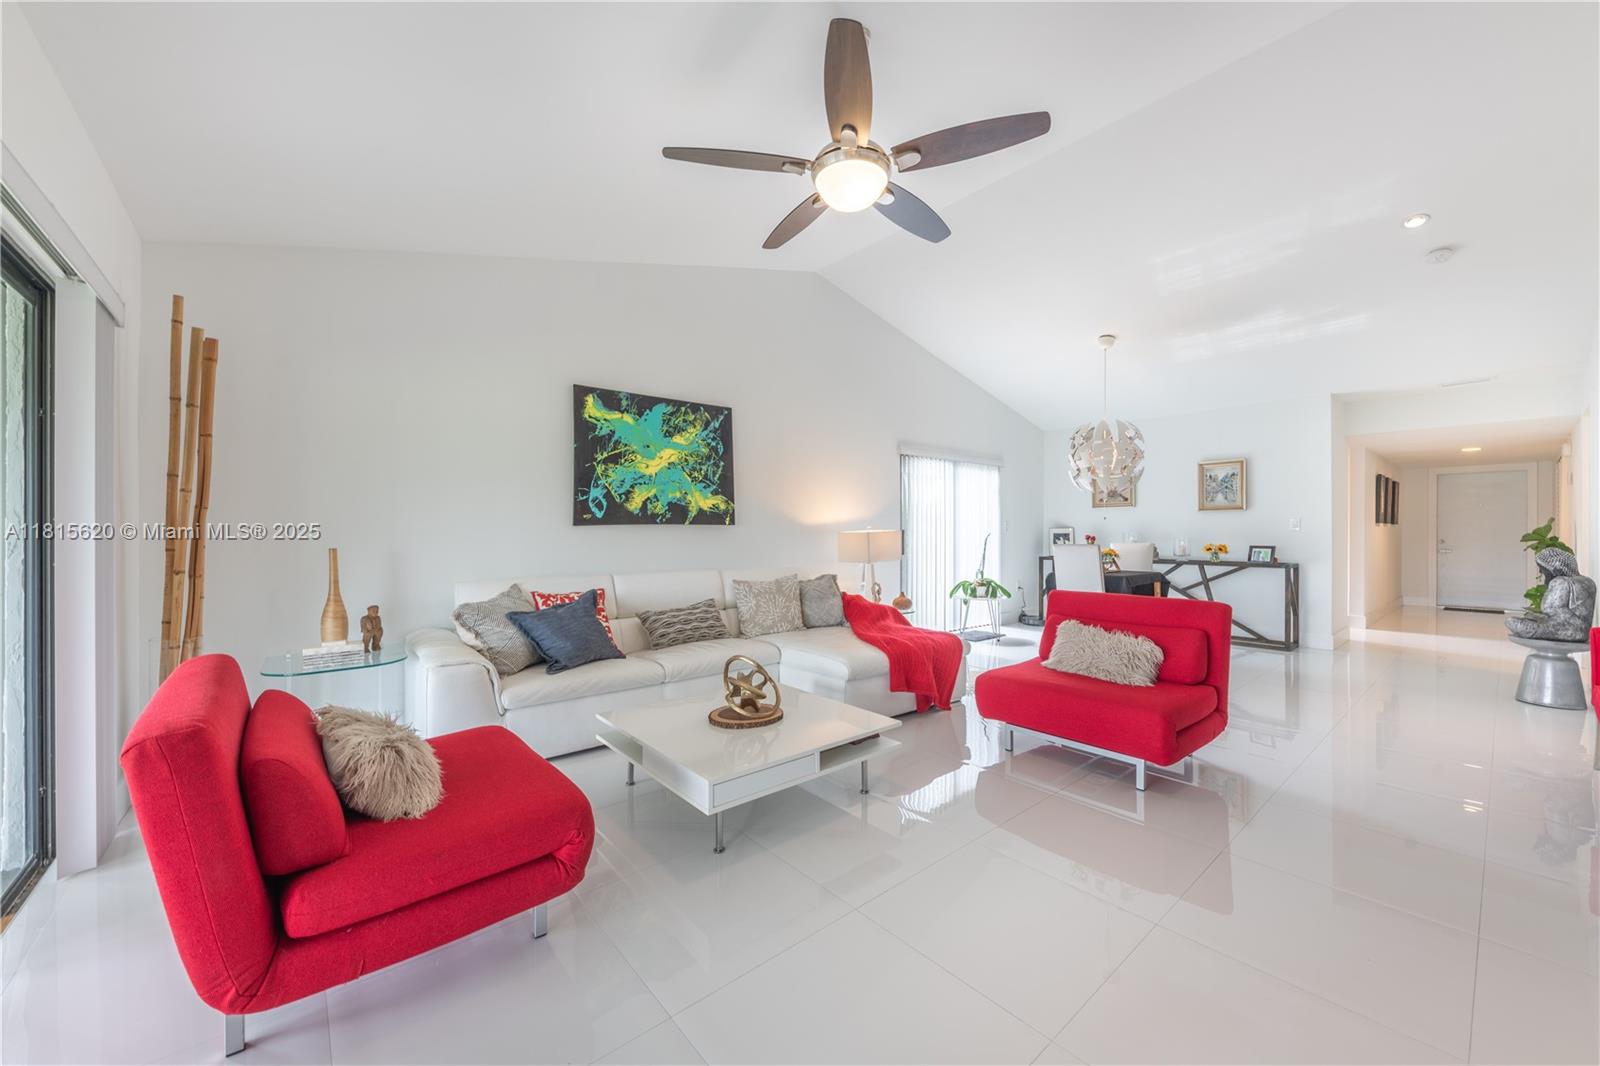
$550,000
2
bds
|
2
ba
|
1,490
sqft
|
built
1980
16039 Fairway Ln, Weston, FL 33326
$-2,127
Cash flow
-20.2%
Cash-on-Cash Return
1.6%
Cap rate
0.5%
Rent to Value Ratio
Active
$1,675,000
6
bds
|
4
ba
|
3,894
sqft
|
built
1999
2509 Hunters Run Way, Weston, FL 33327
$-5,408
Cash flow
-16.8%
Cash-on-Cash Return
2.4%
Cap rate
0.4%
Rent to Value Ratio

Active
$820,000
5
bds
|
4
ba
|
2,466
sqft
|
built
1995
164 Granada Ave, Weston, FL 33326
$-2,340
Cash flow
-14.9%
Cash-on-Cash Return
2.9%
Cap rate
0.5%
Rent to Value Ratio
Active
$2,499,000
5
bds
|
4
ba
|
3,812
sqft
|
built
1993
3272 Muirfield, Weston, FL 33332
$-7,765
Cash flow
-16.2%
Cash-on-Cash Return
2.6%
Cap rate
0.5%
Rent to Value Ratio
Active
$1,399,399
5
bds
|
4
ba
|
2,657
sqft
|
built
1994
2904 Oakbrook Dr, Weston, FL 33332
$-2,802
Cash flow
-10.4%
Cash-on-Cash Return
3.9%
Cap rate
0.6%
Rent to Value Ratio
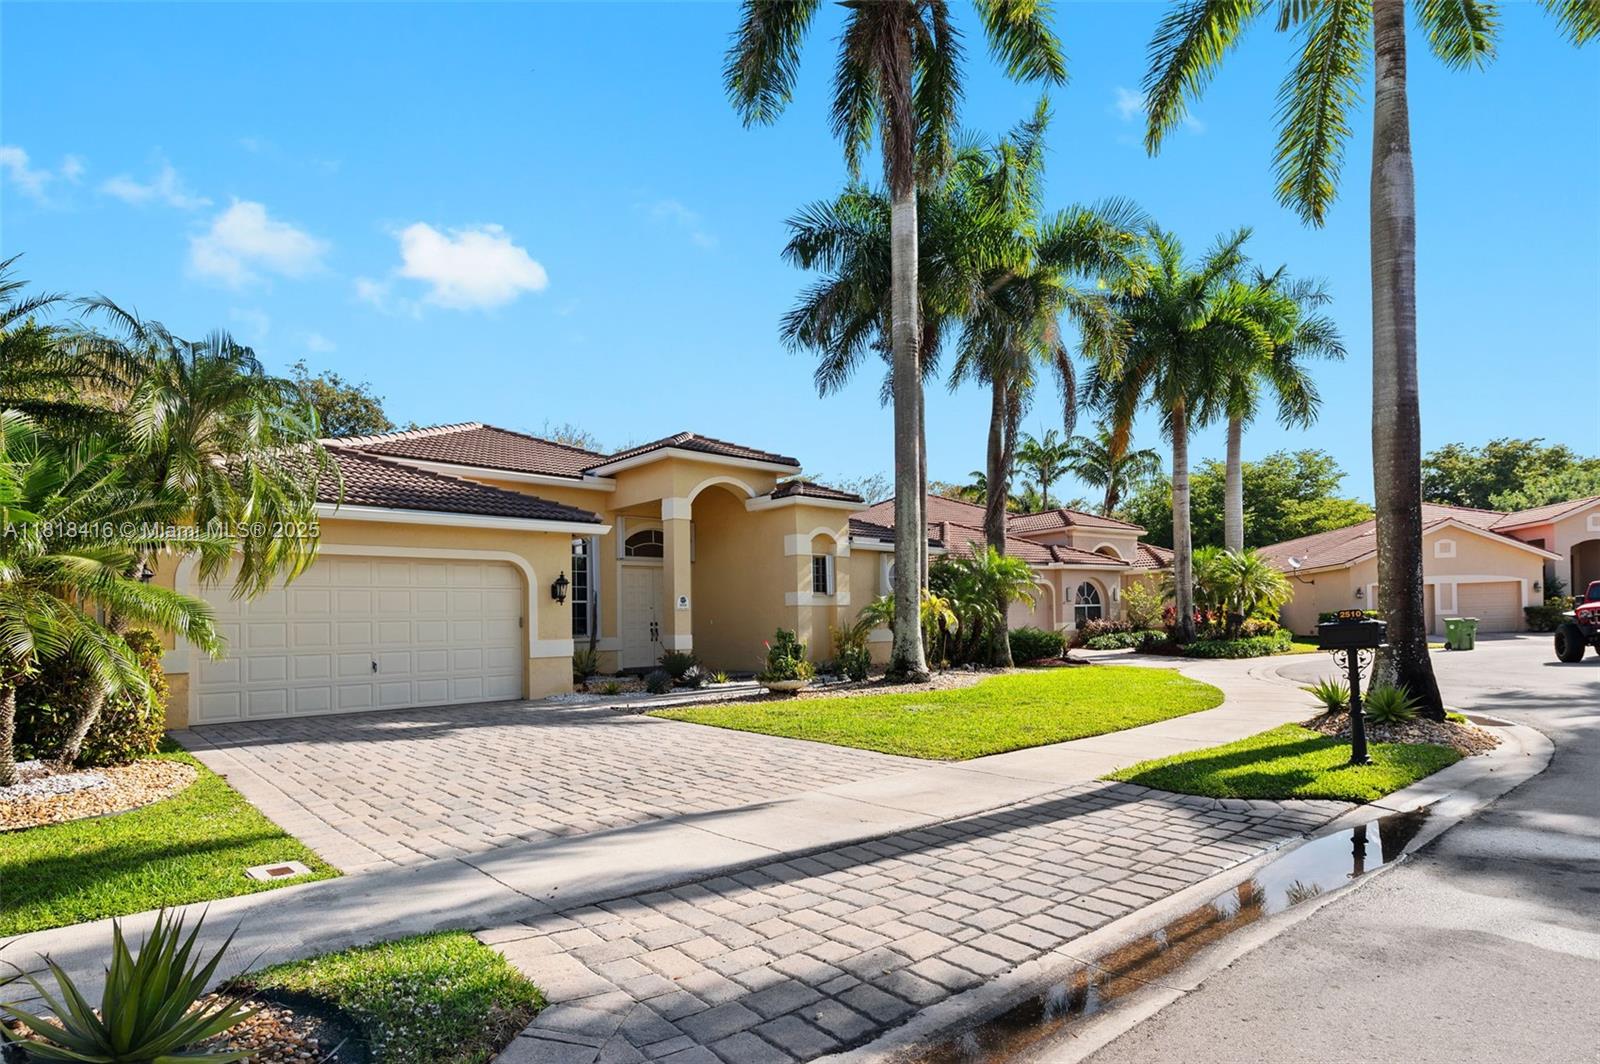
Active
$1,289,000
5
bds
|
3
ba
|
2,719
sqft
|
built
1995
2510 Jardin Dr, Weston, FL 33327
$-2,423
Cash flow
-9.8%
Cash-on-Cash Return
4.0%
Cap rate
0.6%
Rent to Value Ratio
Active
$1,249,999
4
bds
|
3
ba
|
2,410
sqft
|
built
1993
3039 Lakewood Dr, Weston, FL 33332
$-3,947
Cash flow
-16.5%
Cash-on-Cash Return
2.5%
Cap rate
0.4%
Rent to Value Ratio
Active
$764,000
3
bds
|
2
ba
|
1,478
sqft
|
built
1996
916 Savannah Falls Dr, Weston, FL 33327
$-2,388
Cash flow
-16.3%
Cash-on-Cash Return
2.5%
Cap rate
0.5%
Rent to Value Ratio
Active
$1,098,000
4
bds
|
3
ba
|
2,672
sqft
|
built
1990
1106 Waterbrook Ln, Weston, FL 33326
$-2,910
Cash flow
-13.8%
Cash-on-Cash Return
3.1%
Cap rate
0.5%
Rent to Value Ratio
Active
$307,500
2
bds
|
2
ba
|
1,220
sqft
|
built
1981
16521 Blatt Blvd, Weston, FL 33326
$-929
Cash flow
-15.8%
Cash-on-Cash Return
2.7%
Cap rate
0.8%
Rent to Value Ratio
Active
$380,000
2
bds
|
2
ba
|
1,235
sqft
|
built
1979
16500 Golf Club Rd, Weston, FL 33326
$-1,366
Cash flow
-18.8%
Cash-on-Cash Return
2.0%
Cap rate
0.7%
Rent to Value Ratio

Active
$1,250,000
5
bds
|
4
ba
|
2,935
sqft
|
built
1994
523 Stonemont Dr, Weston, FL 33326
$-2,562
Cash flow
-10.7%
Cash-on-Cash Return
3.8%
Cap rate
0.6%
Rent to Value Ratio
Active
$844,900
4
bds
|
3
ba
|
2,383
sqft
|
built
1987
1990 Lakeshore Dr, Weston, FL 33326
$-1,894
Cash flow
-11.7%
Cash-on-Cash Return
3.6%
Cap rate
0.5%
Rent to Value Ratio
Active
$1,100,000
4
bds
|
3
ba
|
2,262
sqft
|
built
2000
4221 Laurel Ridge Cir, Weston, FL 33331
$-3,426
Cash flow
-16.2%
Cash-on-Cash Return
2.5%
Cap rate
0.5%
Rent to Value Ratio
Active
$549,000
2
bds
|
2
ba
|
1,956
sqft
|
built
1979
16189 Laurel Dr, Weston, FL 33326
$-1,889
Cash flow
-18.0%
Cash-on-Cash Return
2.2%
Cap rate
0.7%
Rent to Value Ratio
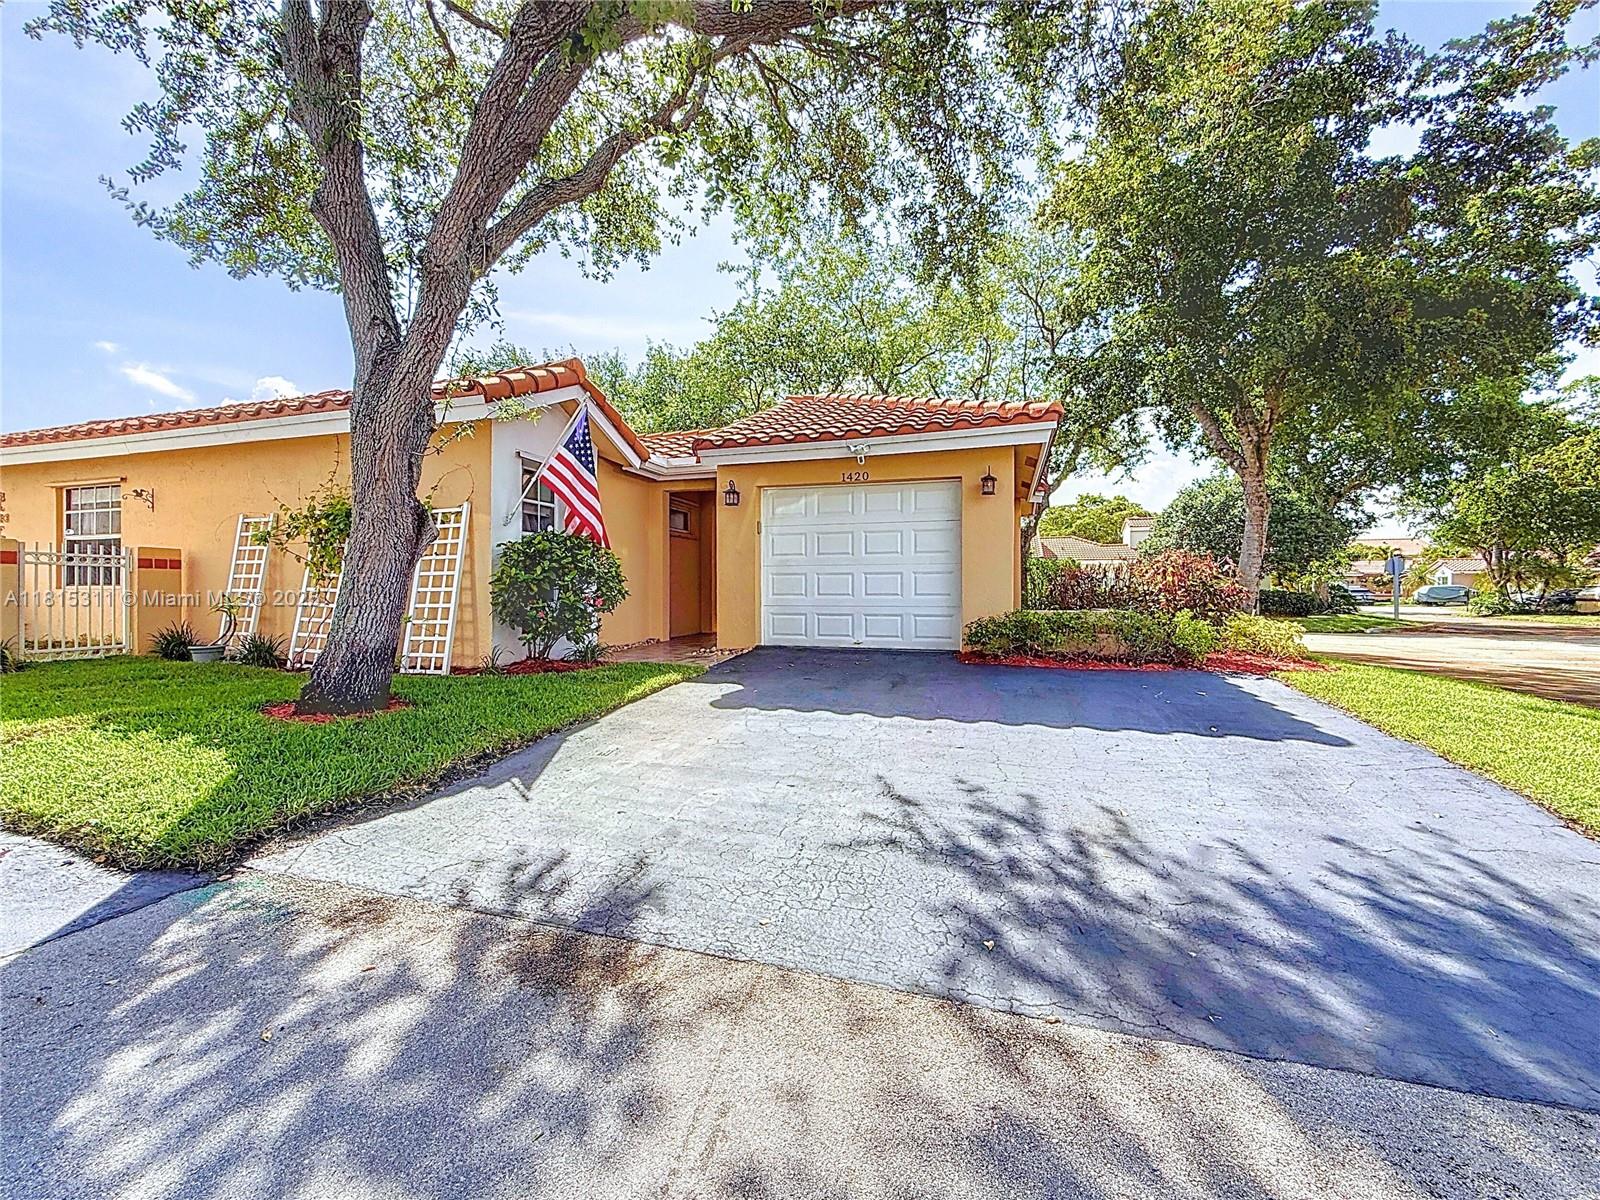
Active
$640,000
3
bds
|
2
ba
|
1,314
sqft
|
built
1988
1420 Seagrape Cir, Weston, FL 33326
$-1,773
Cash flow
-14.5%
Cash-on-Cash Return
3.0%
Cap rate
0.5%
Rent to Value Ratio
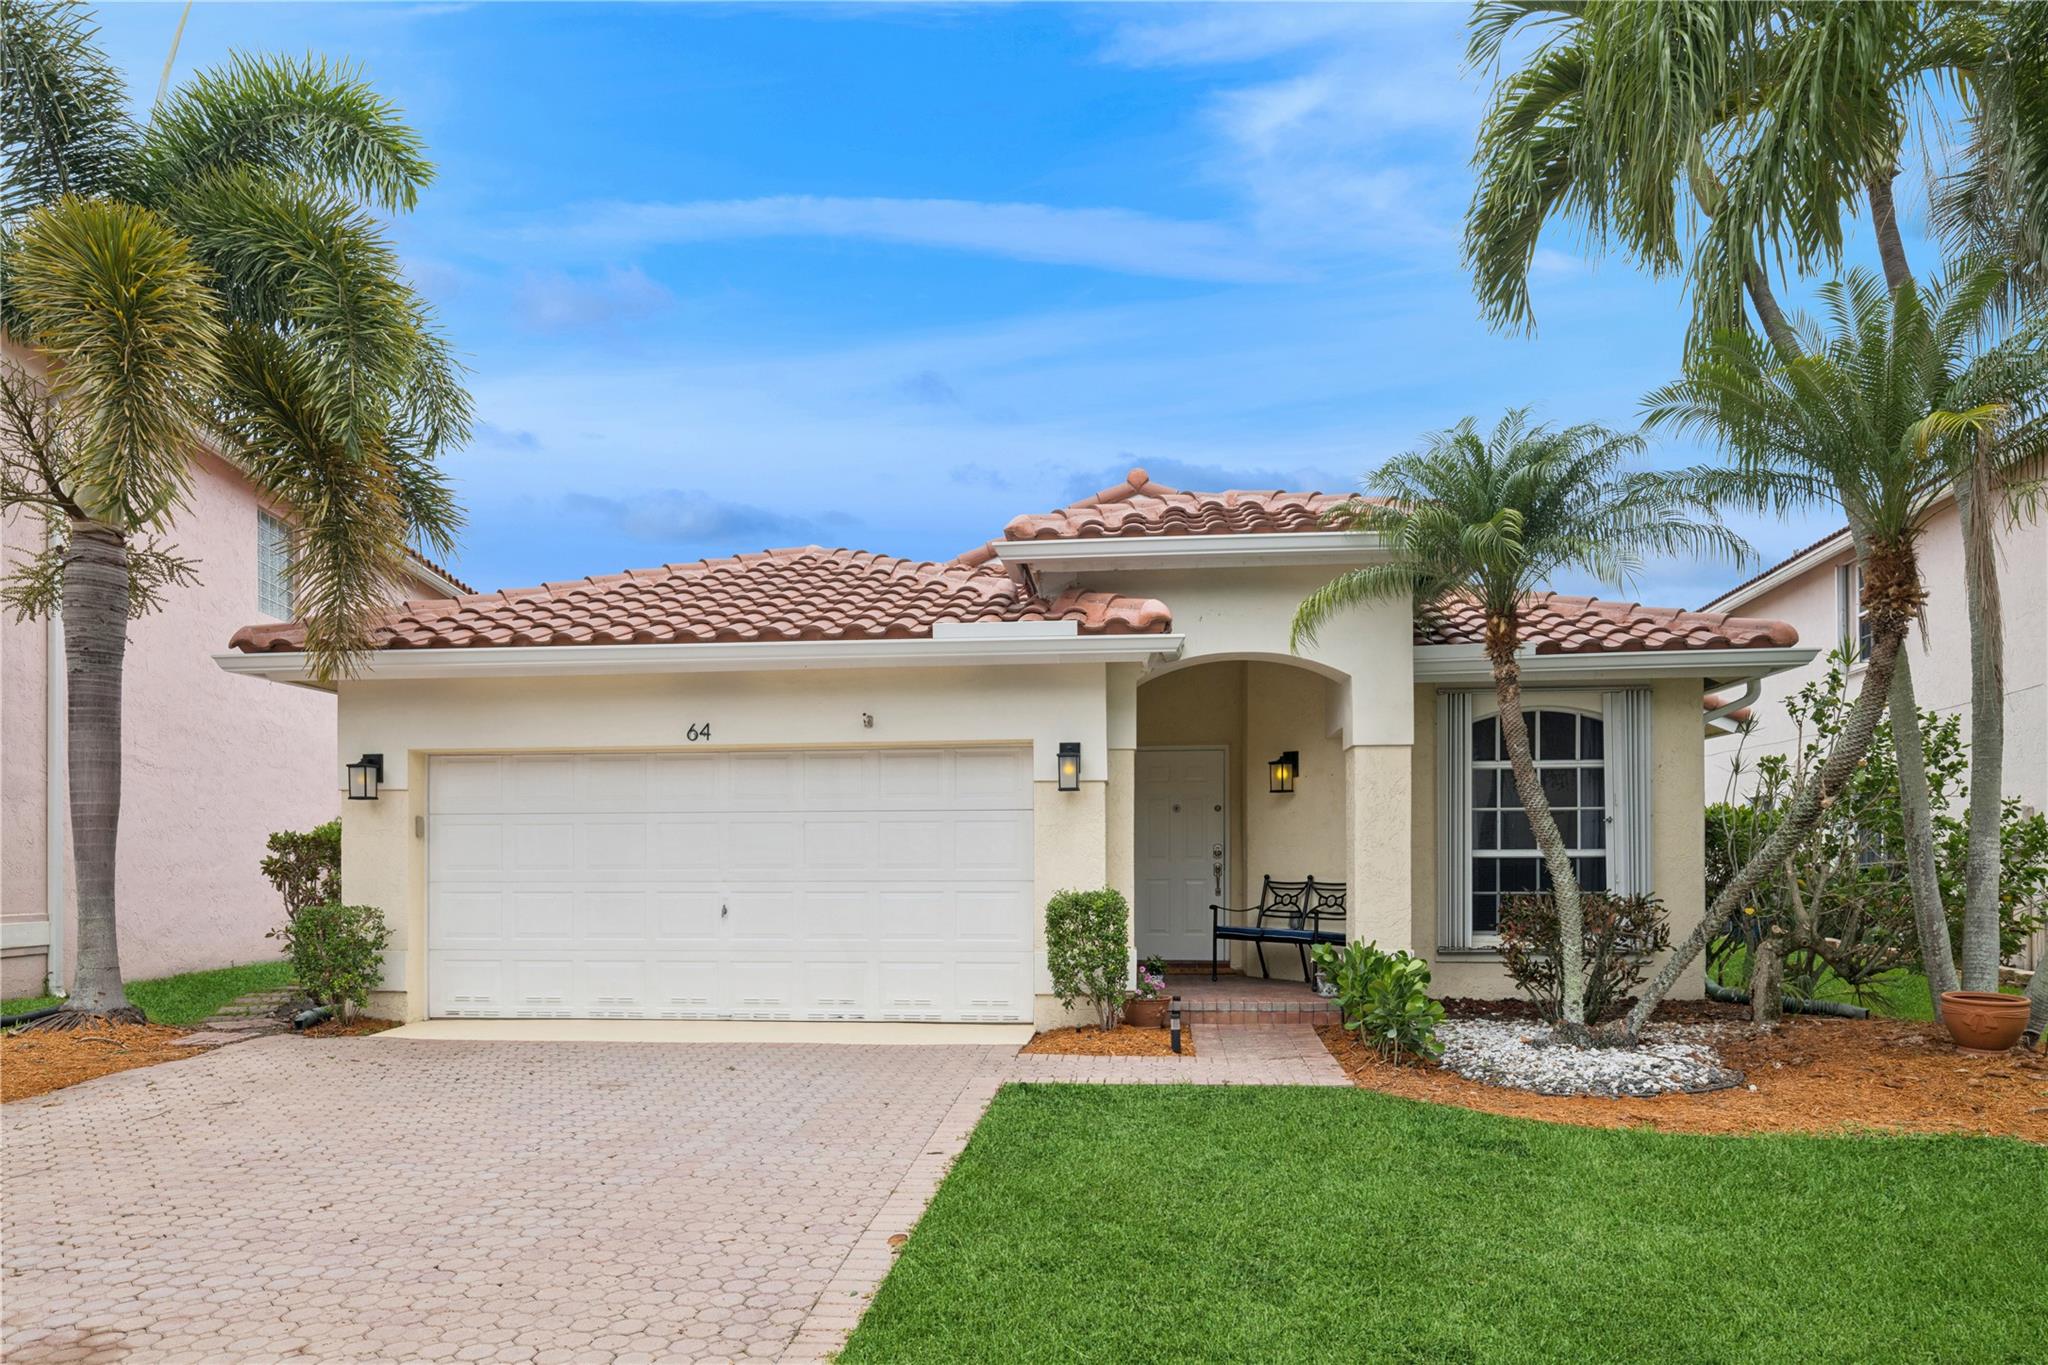
Active
$674,000
3
bds
|
2
ba
|
1,682
sqft
|
built
1996
64 Gables Blvd, Weston, FL 33326
$-1,611
Cash flow
-12.5%
Cash-on-Cash Return
3.4%
Cap rate
0.5%
Rent to Value Ratio
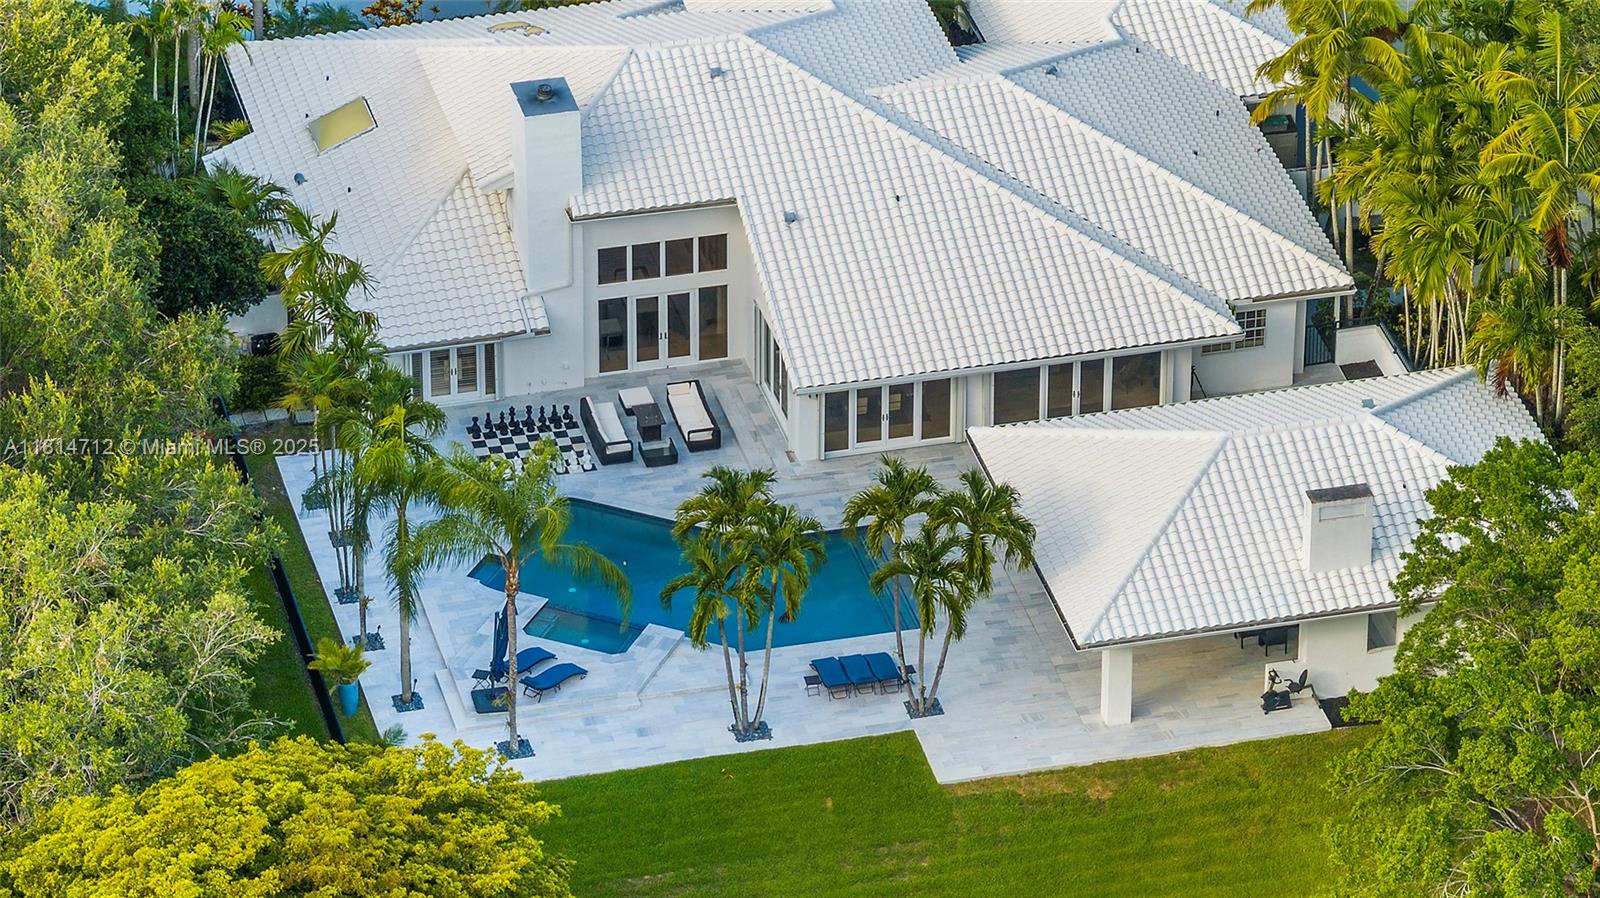
Active
$3,285,000
5
bds
|
5
ba
|
4,486
sqft
|
built
1989
2805 Hackney Rd, Weston, FL 33331
$-17,953
Cash flow
-28.5%
Cash-on-Cash Return
-0.3%
Cap rate
0.1%
Rent to Value Ratio
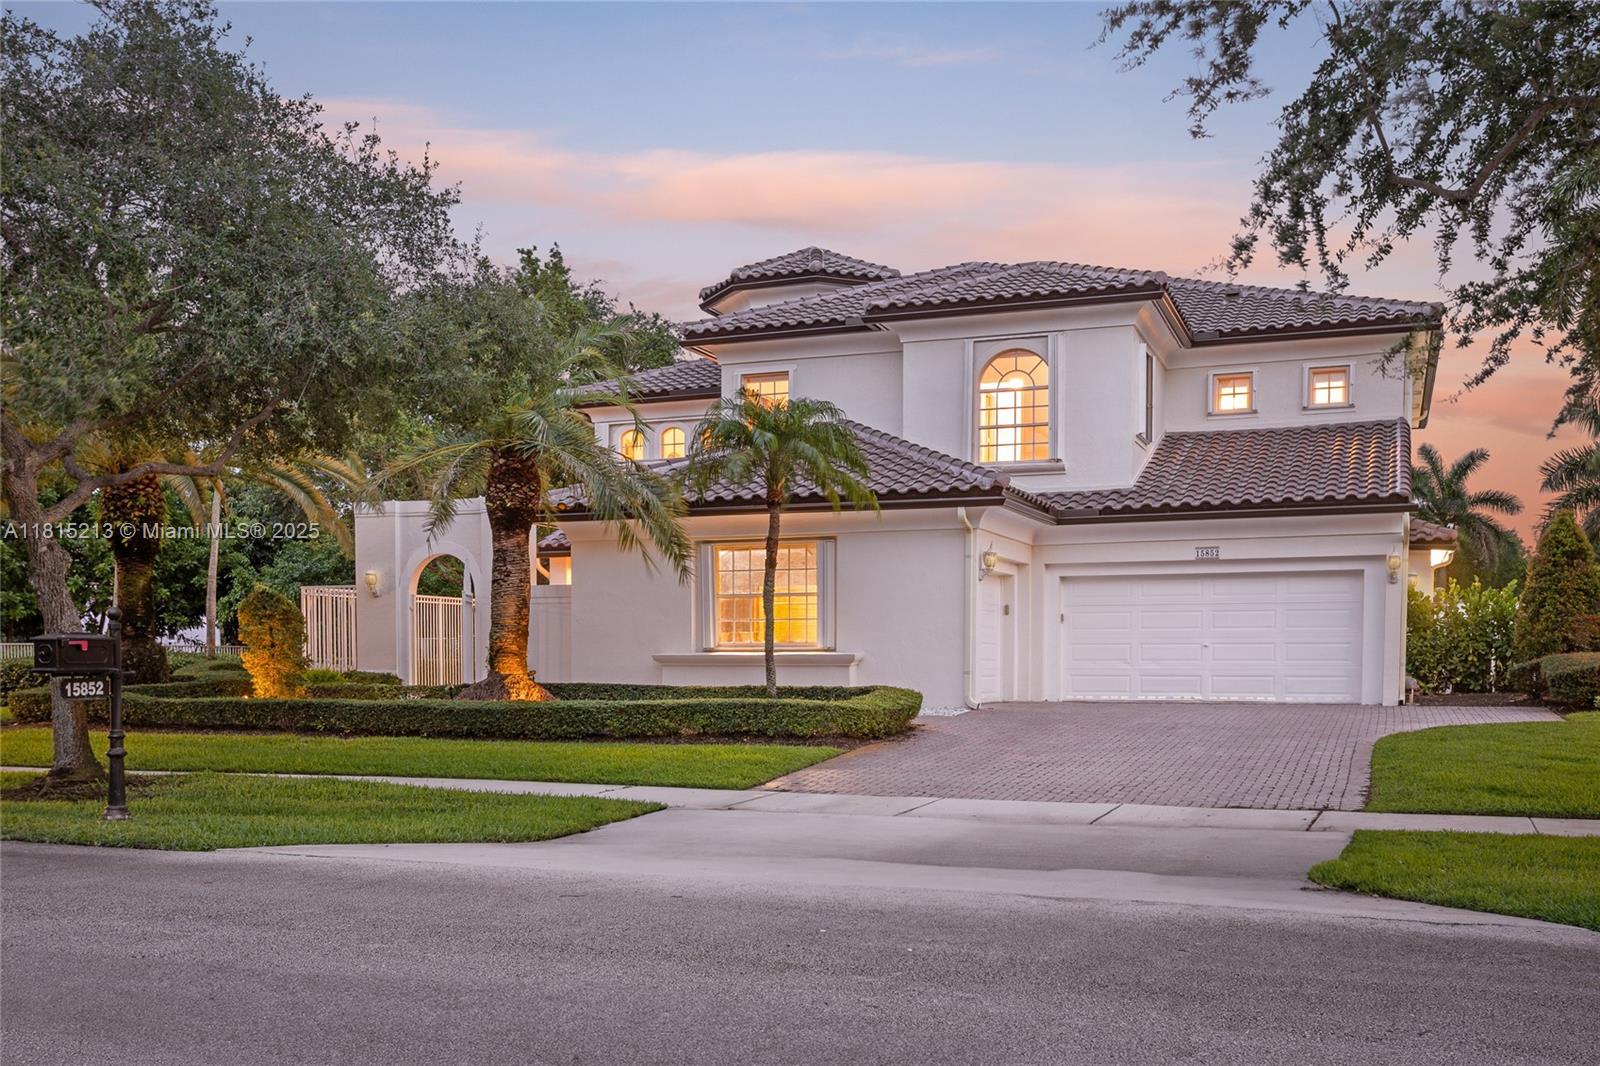
Active
$1,900,000
5
bds
|
4
ba
|
4,285
sqft
|
built
1998
15852 SW 15th St, Weston, FL 33326
$-4,852
Cash flow
-13.3%
Cash-on-Cash Return
3.2%
Cap rate
0.5%
Rent to Value Ratio
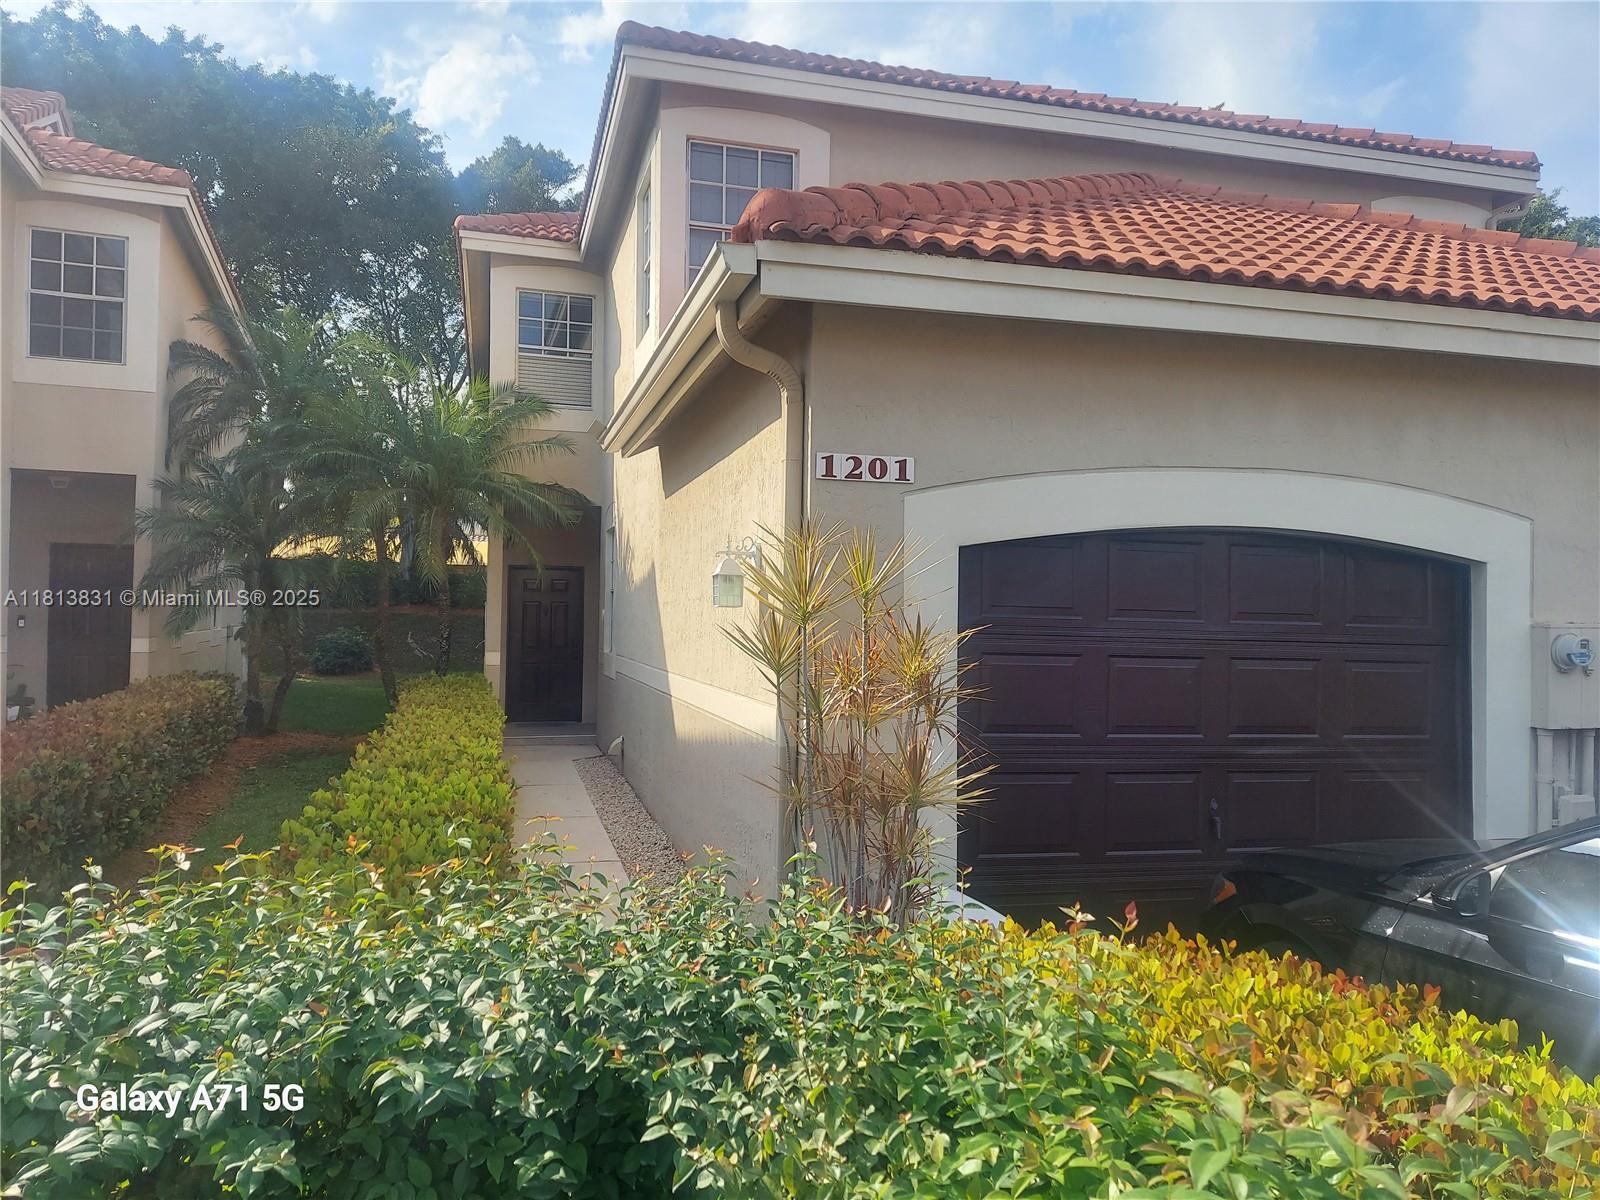
Active
$540,000
3
bds
|
3
ba
|
1,456
sqft
|
built
1995
1201 Sorrento Dr, Weston, FL 33326
$-1,393
Cash flow
-13.5%
Cash-on-Cash Return
3.2%
Cap rate
0.6%
Rent to Value Ratio
Active
$320,000
2
bds
|
2
ba
|
1,292
sqft
|
built
1981
16091 Blatt Blvd, Weston, FL 33326
$-786
Cash flow
-12.8%
Cash-on-Cash Return
3.3%
Cap rate
0.8%
Rent to Value Ratio
Active
$350,000
2
bds
|
2
ba
|
1,225
sqft
|
built
1979
193 Lakeview Dr, Weston, FL 33326
$-676
Cash flow
-10.1%
Cash-on-Cash Return
4.0%
Cap rate
0.7%
Rent to Value Ratio
Active
$330,000
2
bds
|
2
ba
|
1,320
sqft
|
built
1980
340 Racquet Club Rd, Weston, FL 33326
$-546
Cash flow
-8.6%
Cash-on-Cash Return
4.3%
Cap rate
0.7%
Rent to Value Ratio
Active
$389,995
2
bds
|
2
ba
|
1,273
sqft
|
built
1976
16300 Golf Club Rd, Weston, FL 33326
$-1,093
Cash flow
-14.6%
Cash-on-Cash Return
2.9%
Cap rate
0.8%
Rent to Value Ratio
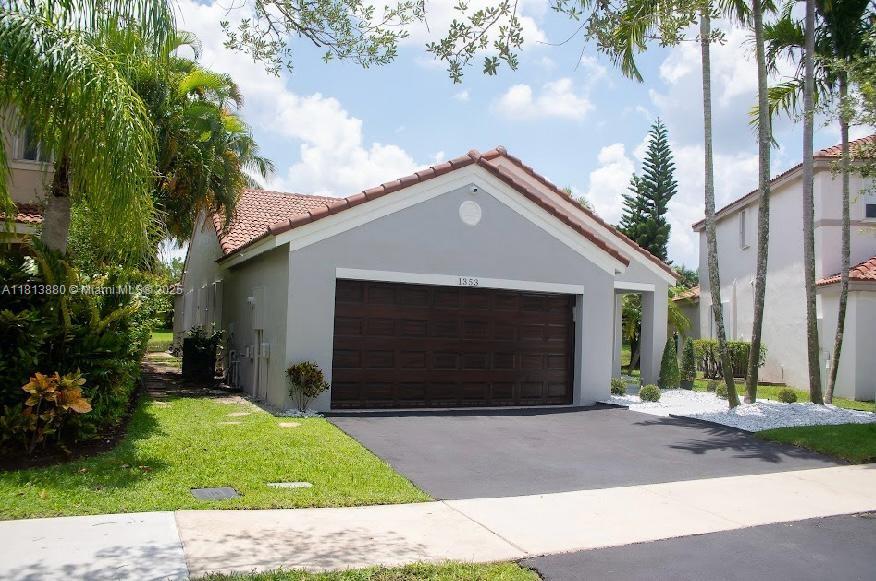
Active
$768,900
3
bds
|
2
ba
|
1,533
sqft
|
built
1999
1353 Majesty Ter, Weston, FL 33327
$-2,100
Cash flow
-14.2%
Cash-on-Cash Return
3.0%
Cap rate
0.5%
Rent to Value Ratio
Active
$1,199,999
5
bds
|
3
ba
|
2,845
sqft
|
built
1995
1326 Ginger Cir, Weston, FL 33326
$-2,562
Cash flow
-11.1%
Cash-on-Cash Return
3.7%
Cap rate
0.7%
Rent to Value Ratio
Active
$1,150,000
4
bds
|
3
ba
|
2,777
sqft
|
built
1999
3943 Nighthawk Dr, Weston, FL 33331
$-2,247
Cash flow
-10.2%
Cash-on-Cash Return
3.9%
Cap rate
0.6%
Rent to Value Ratio
Active
$835,000
4
bds
|
3
ba
|
2,131
sqft
|
built
1992
210 Somerset Way, Weston, FL 33326
$-2,095
Cash flow
-13.1%
Cash-on-Cash Return
3.3%
Cap rate
0.6%
Rent to Value Ratio