Westport, MA Investment Properties for Sale
Browse homes for sale and investment properties in Westport, MA. Refine your search by price, property type, or more.
Best cash flowing properties in Westport, MA
Active
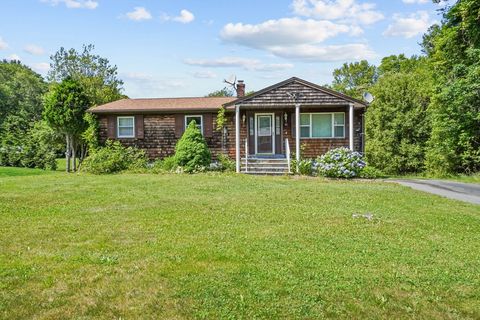
$400,000
3
bds
|
1
ba
|
1,200
sqft
|
built
1971
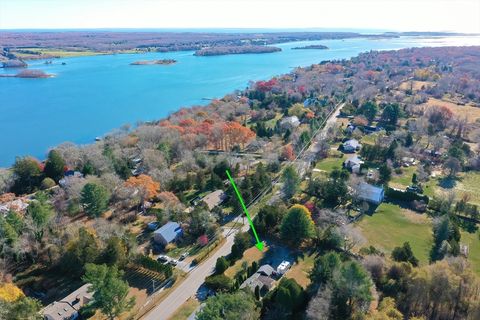
92 Benoit St, Westport, MA 02790
$-176
Cash flow
-2.3%
Cash-on-Cash Return
5.2%
Cap rate
0.7%
Rent to Value Ratio
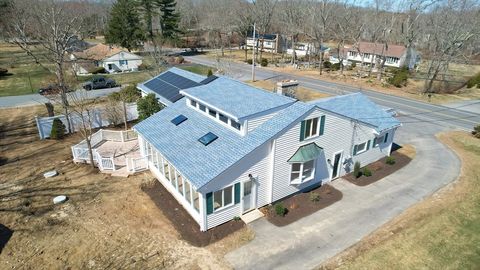
Active
$675,000
3
bds
|
2
ba
|
2,920
sqft
|
built
1963
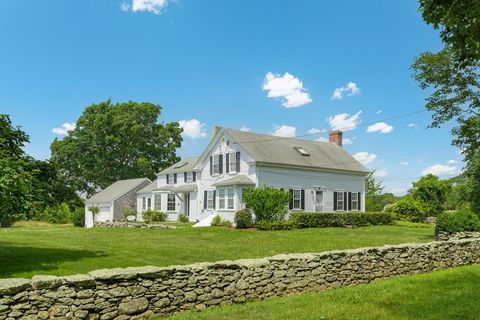
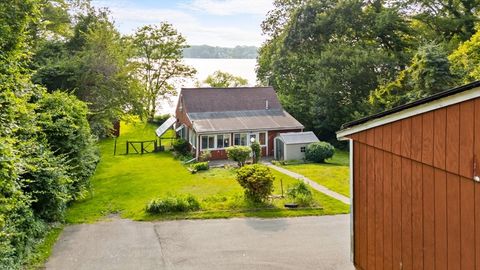
180 Tickle Rd, Westport, MA 02790
$-1,026
Cash flow
-7.9%
Cash-on-Cash Return
3.9%
Cap rate
0.5%
Rent to Value Ratio
20 out of 21 properties for sale in Westport, MA
Limited Results Shown
Create a free account, or log in to reveal all property listings and enjoy the complete experience.
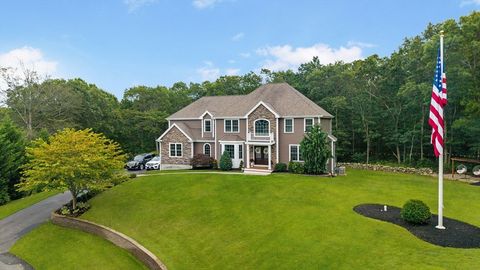
Active
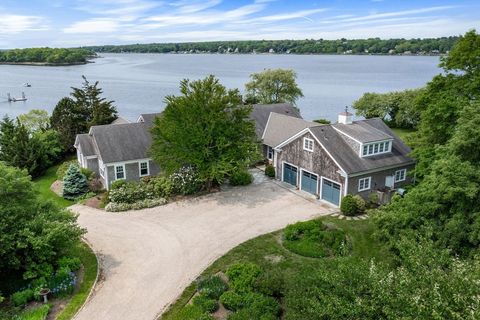
$1,299,000
4
bds
|
3
ba
|
3,899
sqft
|
built
2015
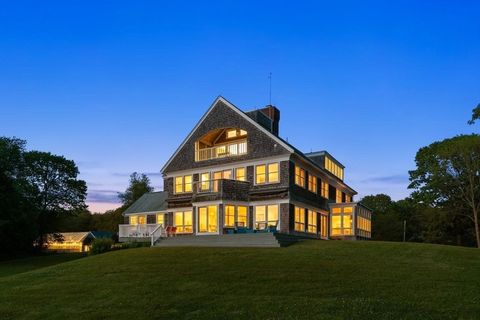
47 Devol Ave, Westport, MA 02790
$-2,782
Cash flow
-11.2%
Cash-on-Cash Return
3.1%
Cap rate
0.4%
Rent to Value Ratio
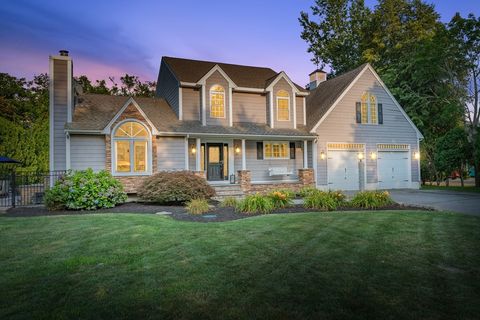
Active
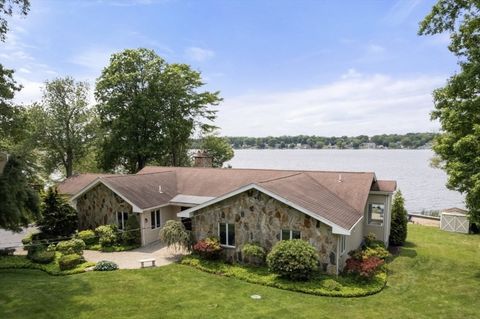
$890,000
4
bds
|
3
ba
|
2,698
sqft
|
built
1996
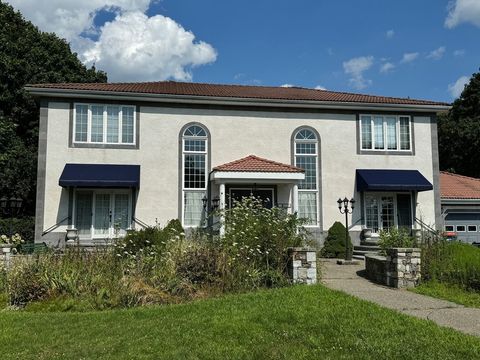
2 Lawtons Ln, Westport, MA 02790
$-1,606
Cash flow
-9.4%
Cash-on-Cash Return
3.5%
Cap rate
0.5%
Rent to Value Ratio
Active
$1,750,000
5
bds
|
2
ba
|
2,557
sqft
|
built
1900
143 Horseneck Rd, Westport, MA 02790
$-5,995
Cash flow
-17.9%
Cash-on-Cash Return
1.6%
Cap rate
0.2%
Rent to Value Ratio
Active
$545,000
1
bds
|
2
ba
|
2,080
sqft
|
built
2008
1346 Main Rd, Westport, MA 02790
$-1,435
Cash flow
-13.7%
Cash-on-Cash Return
2.5%
Cap rate
0.5%
Rent to Value Ratio
Active
$699,900
3
bds
|
2
ba
|
1,757
sqft
|
built
1969
100 D Dr, Westport, MA 02790
$-1,375
Cash flow
-10.2%
Cash-on-Cash Return
3.3%
Cap rate
0.5%
Rent to Value Ratio
Active
$875,000
2
bds
|
1
ba
|
804
sqft
|
built
1960
99 Sylvia Ln, Westport, MA 02790
$-3,293
Cash flow
-19.6%
Cash-on-Cash Return
1.2%
Cap rate
0.2%
Rent to Value Ratio
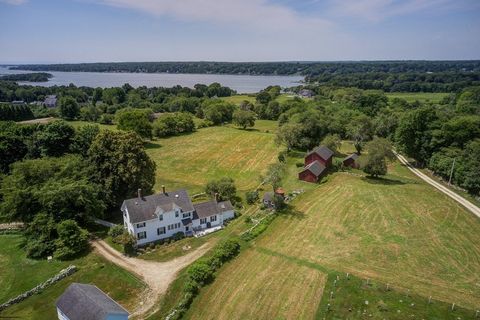
Active
$3,189,000
4
bds
|
3
ba
|
1,979
sqft
|
built
1770
177 Howland Rd, Westport, MA 02790
$-13,400
Cash flow
-21.9%
Cash-on-Cash Return
0.6%
Cap rate
0.1%
Rent to Value Ratio
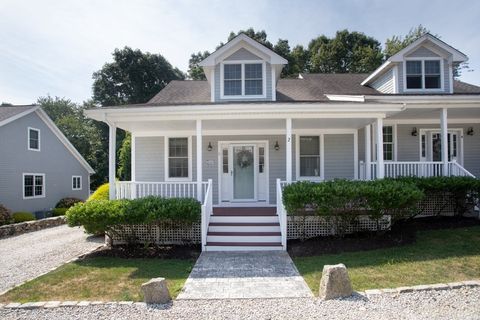
Active
$1,625,000
3
bds
|
3
ba
|
3,472
sqft
|
built
1976
47 Fallon Dr, Westport, MA 02790
$-5,197
Cash flow
-16.7%
Cash-on-Cash Return
1.8%
Cap rate
0.3%
Rent to Value Ratio
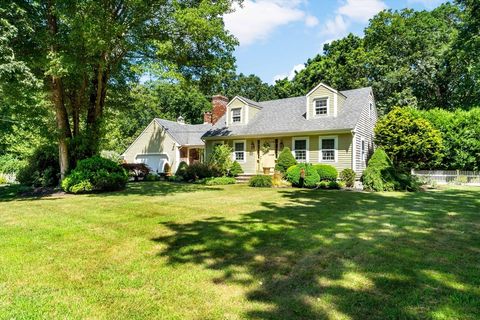
Active
$710,000
3
bds
|
2
ba
|
1,838
sqft
|
built
2000
211 Tickle Rd, Westport, MA 02790
$-1,545
Cash flow
-11.4%
Cash-on-Cash Return
3.1%
Cap rate
0.5%
Rent to Value Ratio
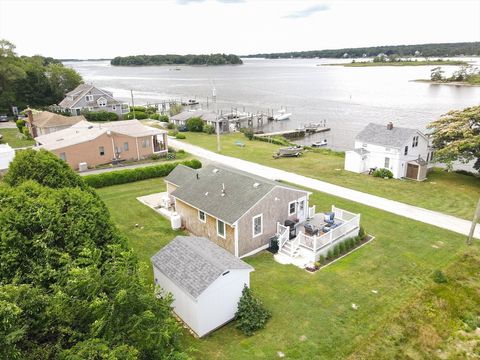
Active
$1,250,000
3
bds
|
1
ba
|
1,428
sqft
|
built
1930
1518 Drift Rd, Westport, MA 02790
$-4,548
Cash flow
-19.0%
Cash-on-Cash Return
1.3%
Cap rate
0.2%
Rent to Value Ratio
Active
$3,775,000
4
bds
|
5
ba
|
5,000
sqft
|
built
1978
37 Glen Rd, Westport, MA 02790
$-13,754
Cash flow
-19.0%
Cash-on-Cash Return
1.3%
Cap rate
0.2%
Rent to Value Ratio
Active
$1,198,000
4
bds
|
5
ba
|
5,552
sqft
|
built
1987
41 Plymouth Blvd, Westport, MA 02790
$-2,829
Cash flow
-12.3%
Cash-on-Cash Return
2.8%
Cap rate
0.4%
Rent to Value Ratio
Active
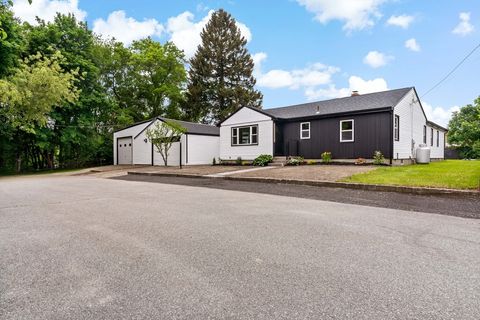
$669,900
3
bds
|
2
ba
|
2,276
sqft
|
built
1962
23 Donna St, Westport, MA 02790
$-1,428
Cash flow
-11.1%
Cash-on-Cash Return
3.1%
Cap rate
0.4%
Rent to Value Ratio
Active
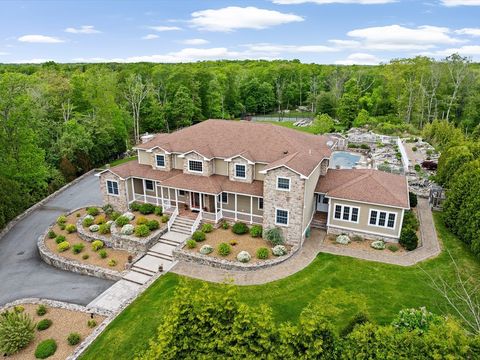
$2,995,000
5
bds
|
6
ba
|
11,880
sqft
|
built
2008
33 Moniz Dr, Westport, MA 02790
$-11,855
Cash flow
-20.7%
Cash-on-Cash Return
0.9%
Cap rate
0.2%
Rent to Value Ratio
Active
$589,000
3
bds
|
2
ba
|
1,272
sqft
|
built
1952
165 Plymouth Blvd, Westport, MA 02790
$-1,043
Cash flow
-9.2%
Cash-on-Cash Return
3.6%
Cap rate
0.5%
Rent to Value Ratio
Active
$495,000
1
bds
|
1
ba
|
596
sqft
|
built
1945
1371 Drift Rd, Westport, MA 02790
$-1,445
Cash flow
-15.2%
Cash-on-Cash Return
2.2%
Cap rate
0.4%
Rent to Value Ratio
Active
$3,950,000
5
bds
|
7
ba
|
7,561
sqft
|
built
1989
1069 Horseneck Rd, Westport, MA 02790
$-16,669
Cash flow
-22.0%
Cash-on-Cash Return
0.6%
Cap rate
0.1%
Rent to Value Ratio
Active
$884,900
4
bds
|
3
ba
|
3,284
sqft
|
built
1989
116 Gifford Rd, Westport, MA 02790
$-1,287
Cash flow
-7.6%
Cash-on-Cash Return
3.9%
Cap rate
0.6%
Rent to Value Ratio