Weymouth, MA Investment Properties for Sale
Browse homes for sale and investment properties in Weymouth, MA. Refine your search by price, property type, or more.
Best cash flowing properties in Weymouth, MA
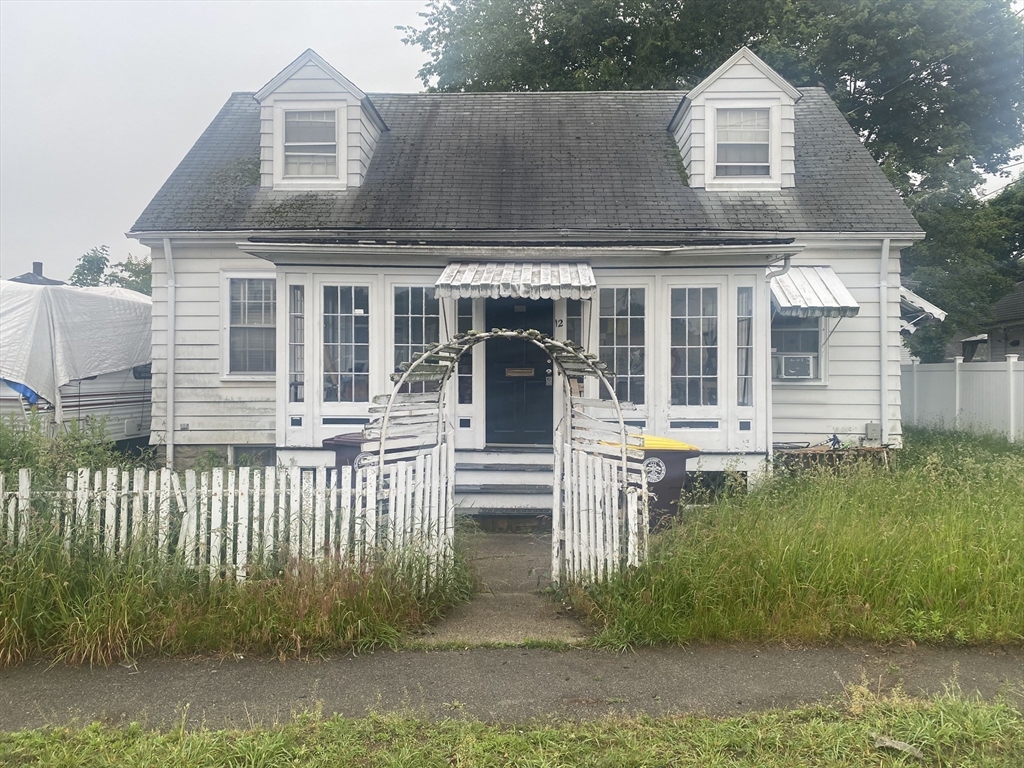
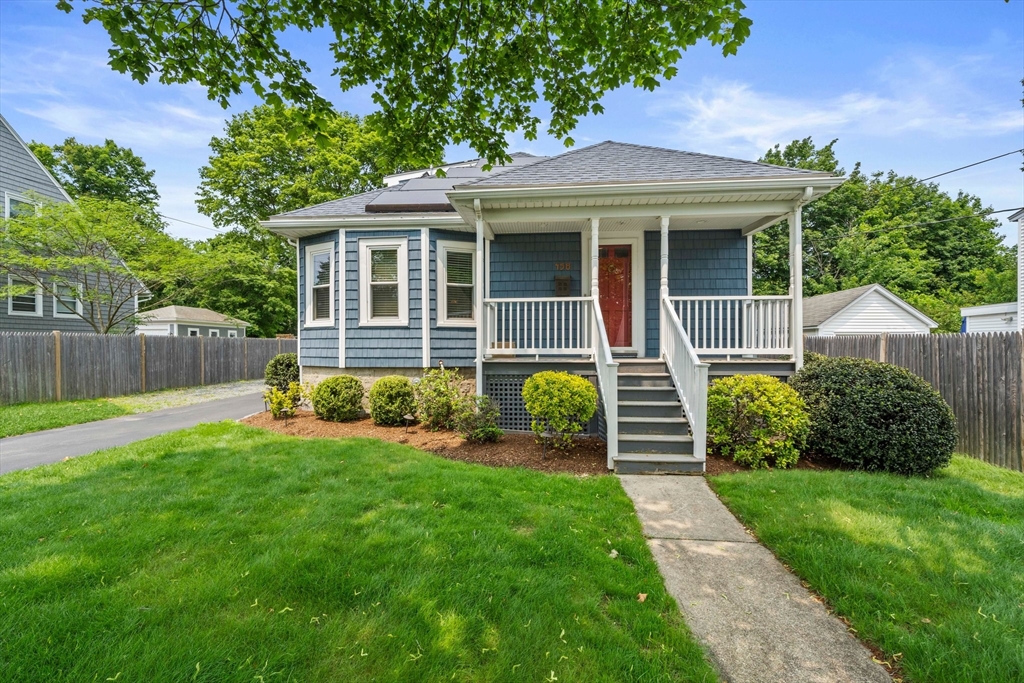
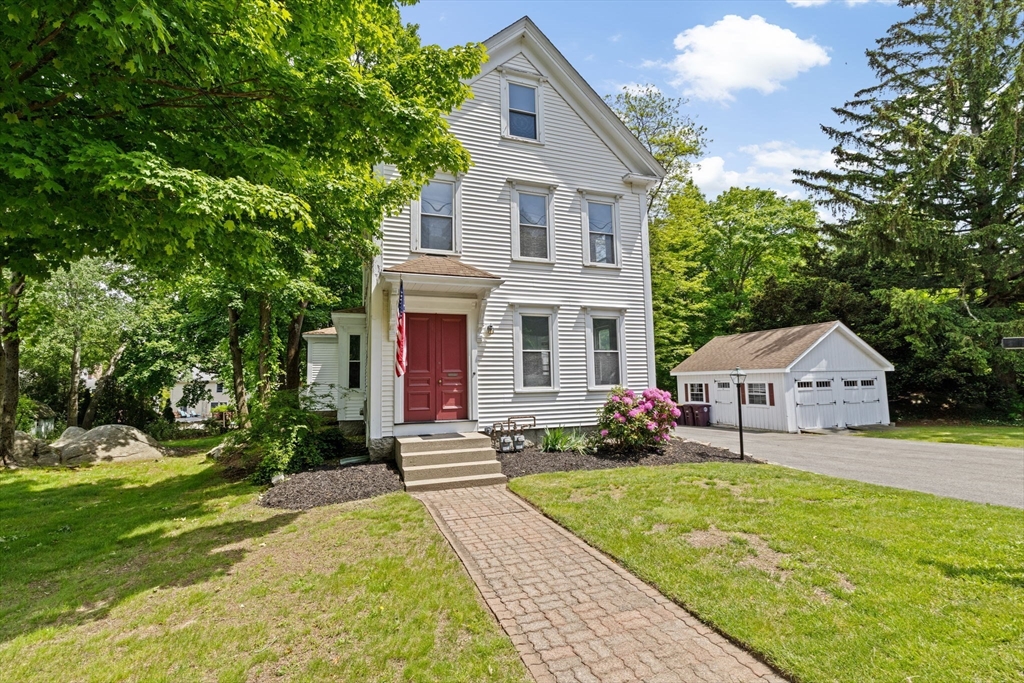
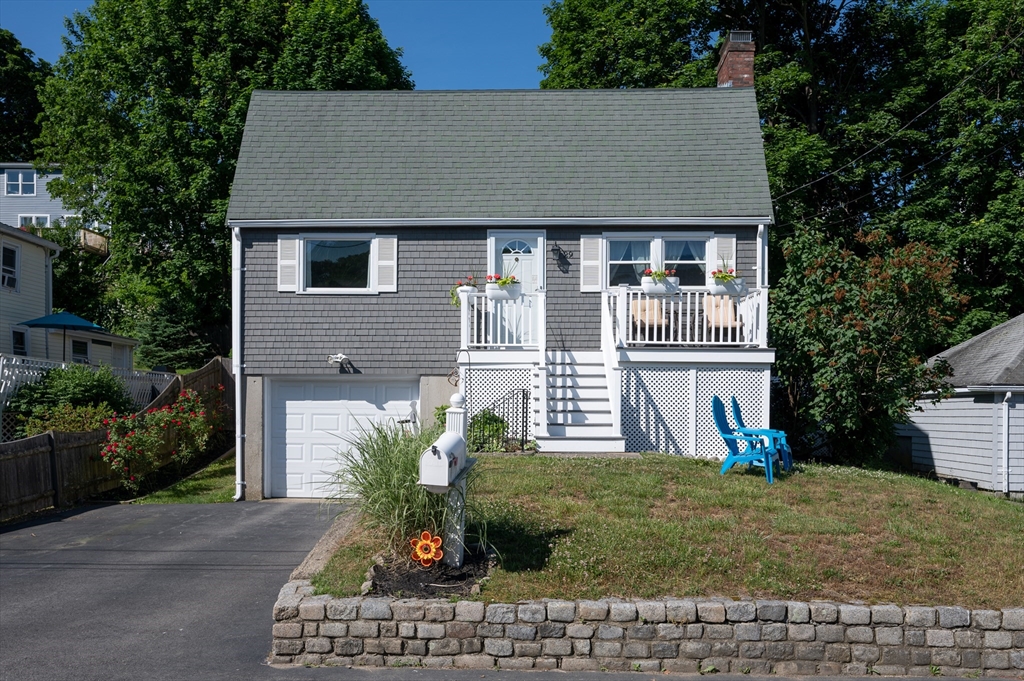
Active under contract
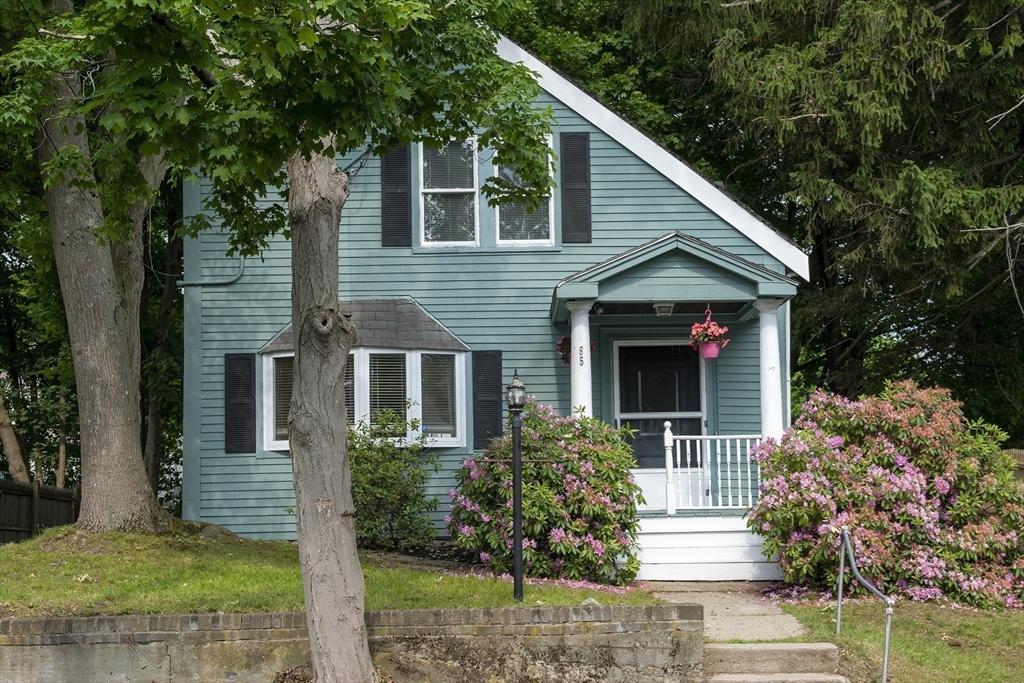
$399,900
3
bds
|
1
ba
|
1,470
sqft
|
built
1935
12 Fairlawn Rd, Weymouth, MA 02191
$-103
Cash flow
-1.3%
Cash-on-Cash Return
6.0%
Cap rate
0.9%
Rent to Value Ratio
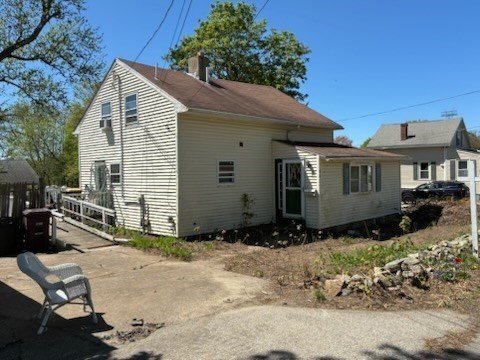
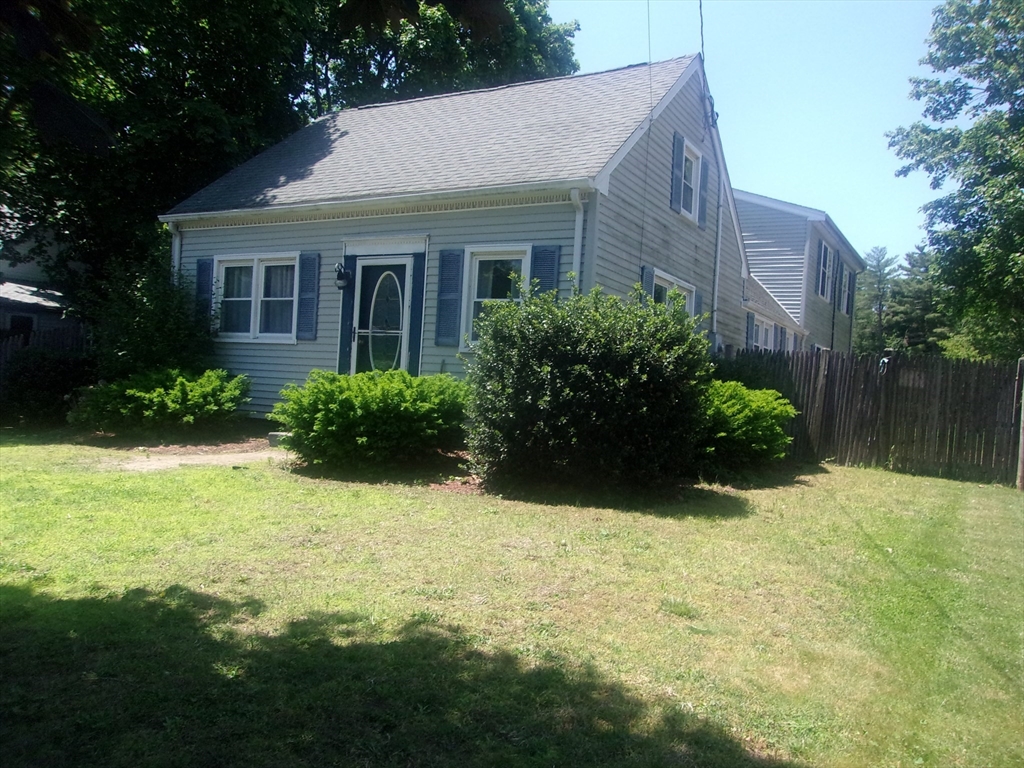
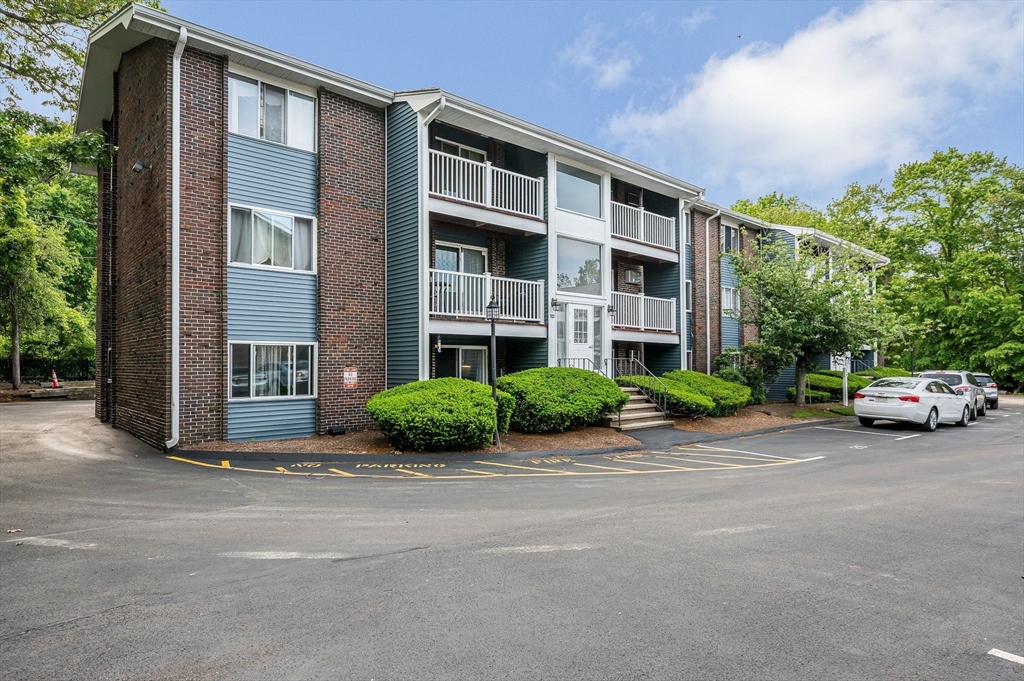
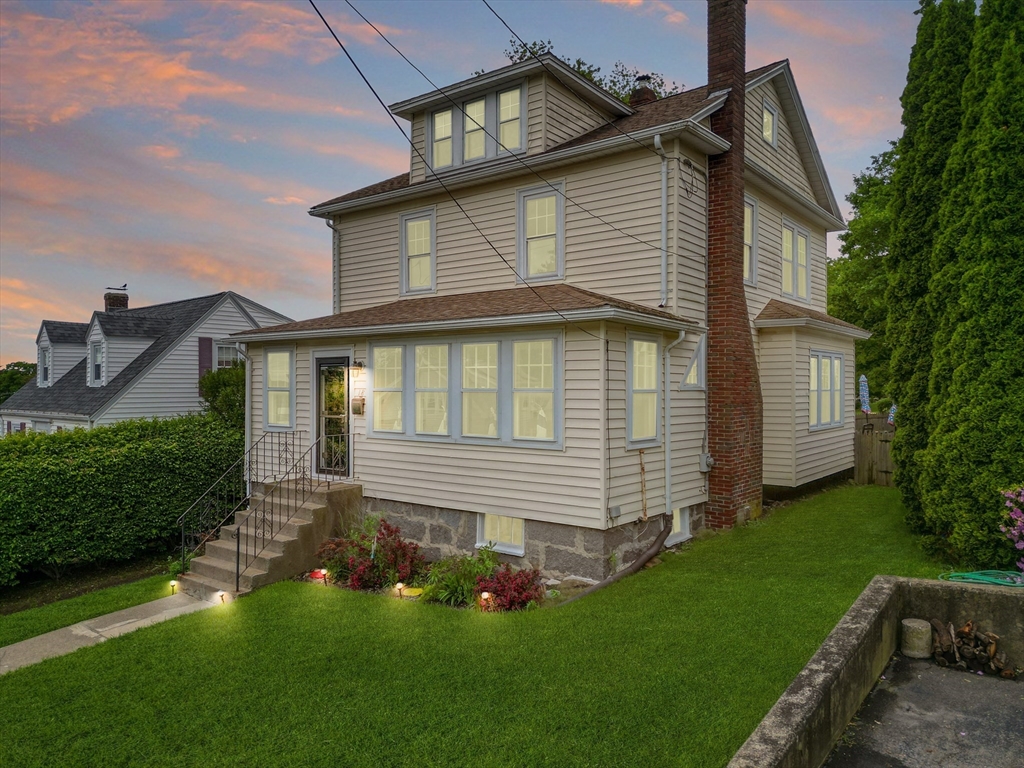
Active under contract
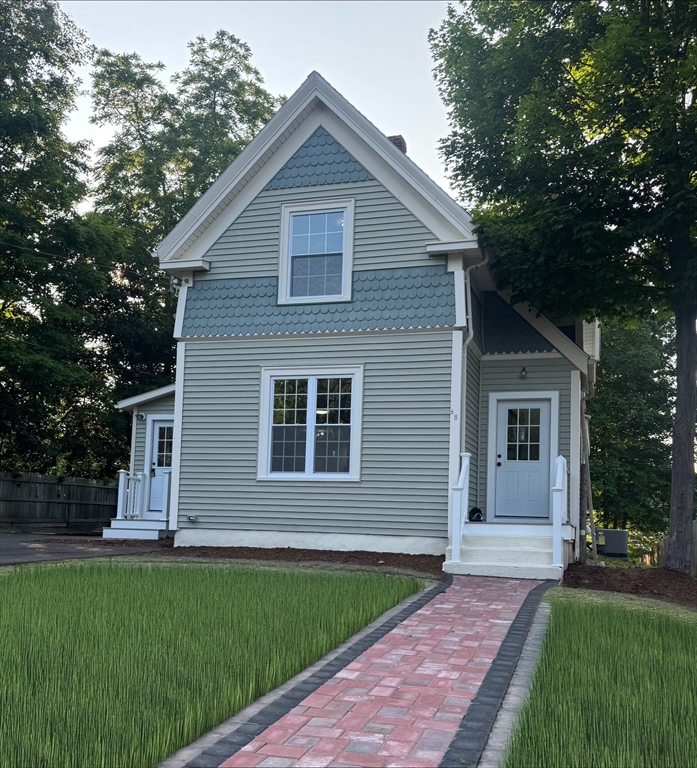
$419,900
3
bds
|
1
ba
|
1,148
sqft
|
built
1922
96 Manzanetta Ave, Weymouth, MA 02188
$-349
Cash flow
-4.3%
Cash-on-Cash Return
5.3%
Cap rate
0.8%
Rent to Value Ratio
63 out of 72 properties for sale in Weymouth, MA
Limited Results Shown
Create a free account, or log in to reveal all property listings and enjoy the complete experience.
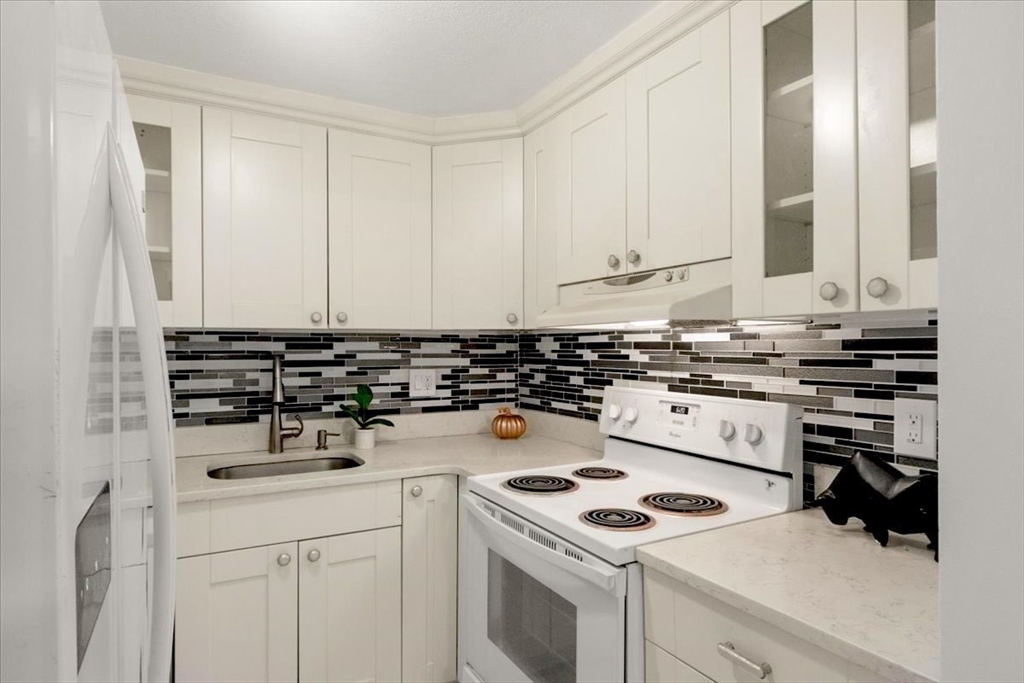
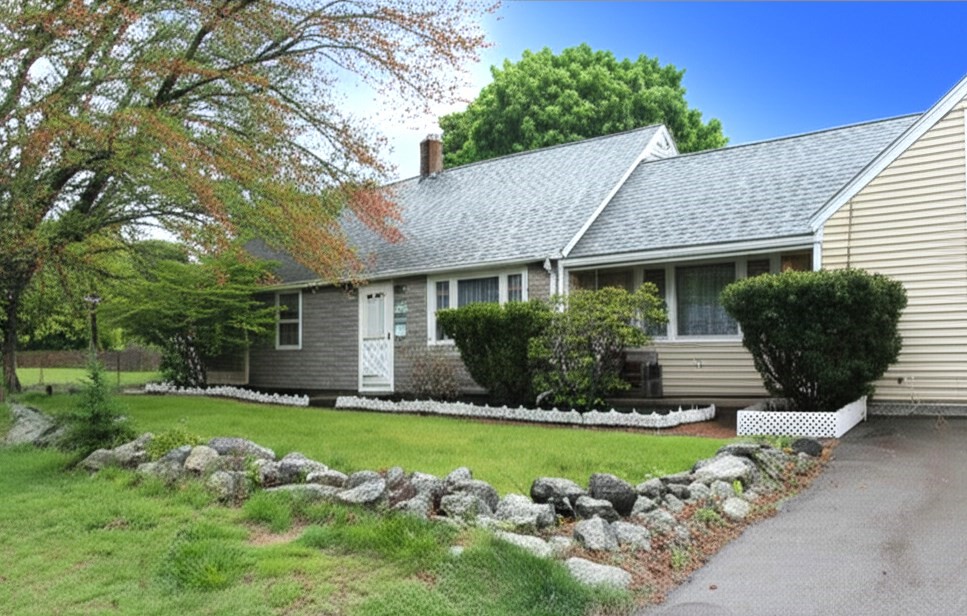
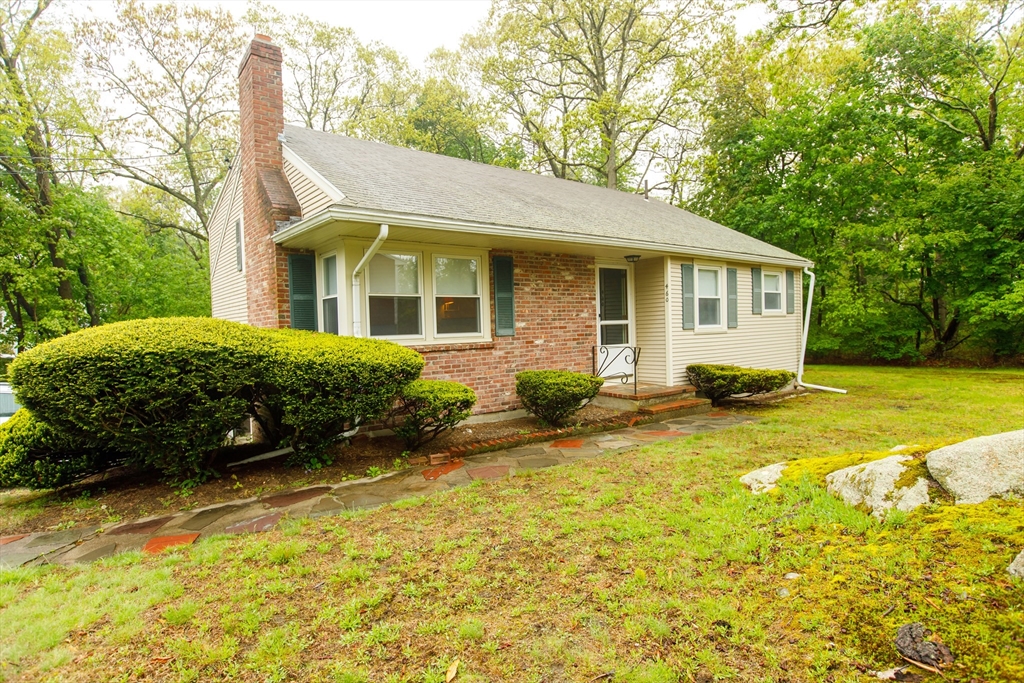
Active
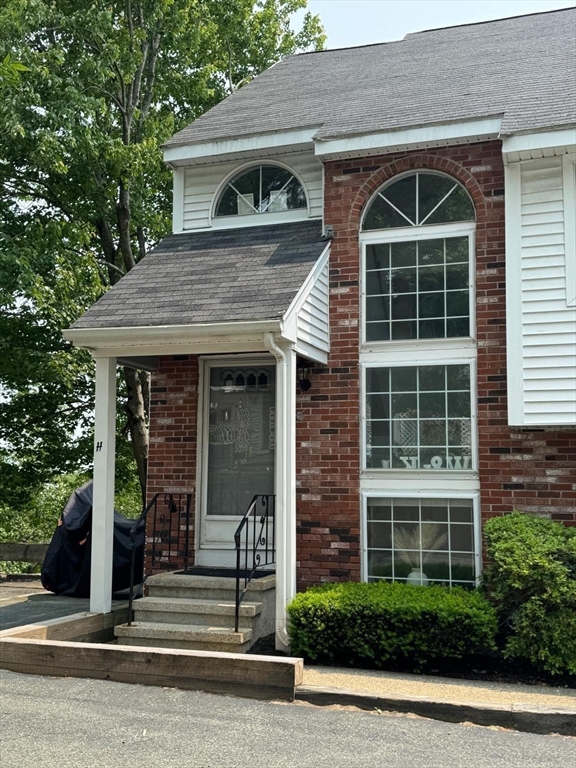
$210,000
1
bds
|
1
ba
|
615
sqft
|
built
1969
215 Winter St, Weymouth, MA 02188
$-588
Cash flow
-14.6%
Cash-on-Cash Return
2.9%
Cap rate
0.9%
Rent to Value Ratio
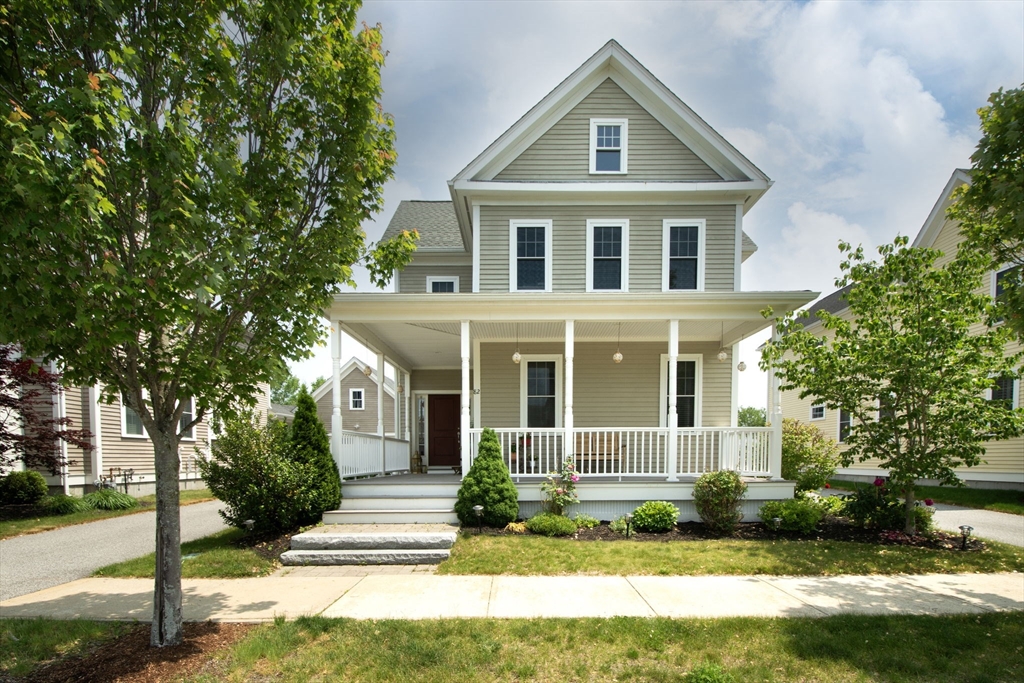
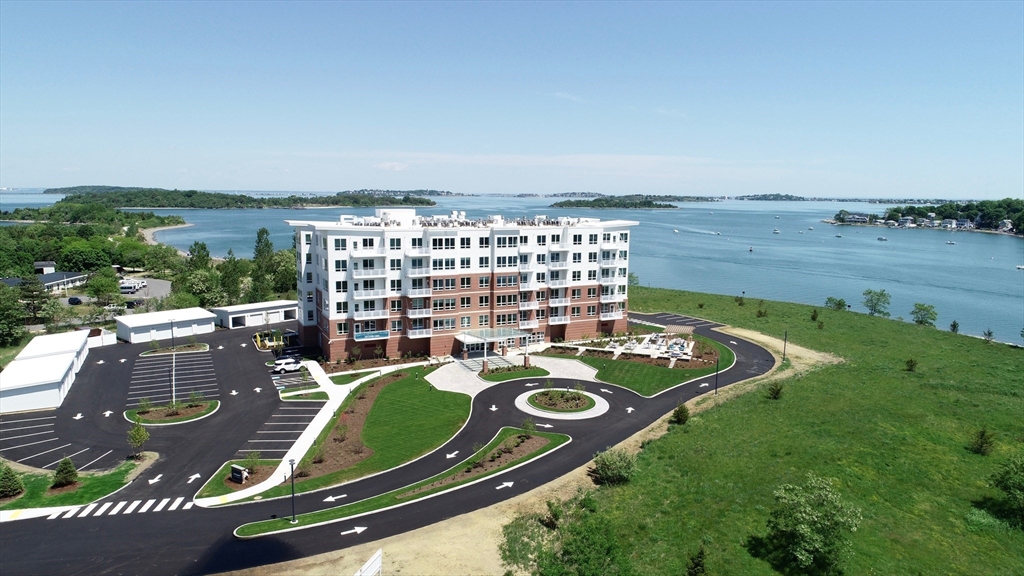
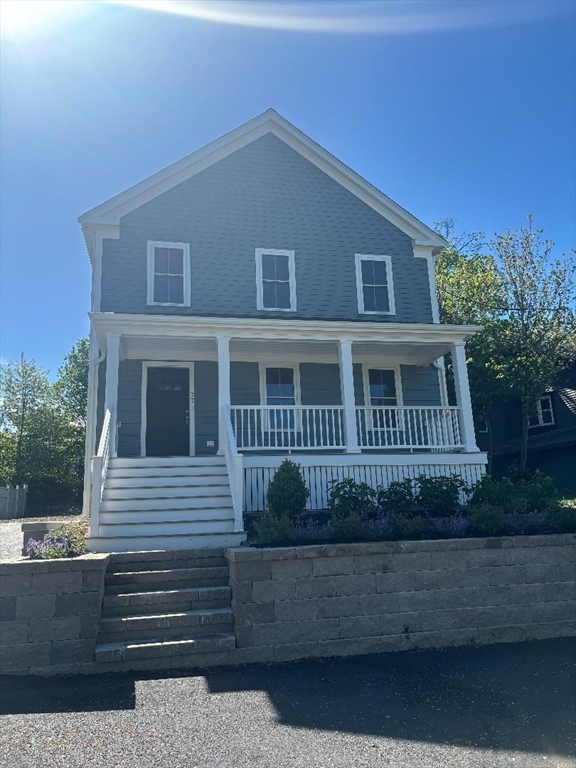
Active
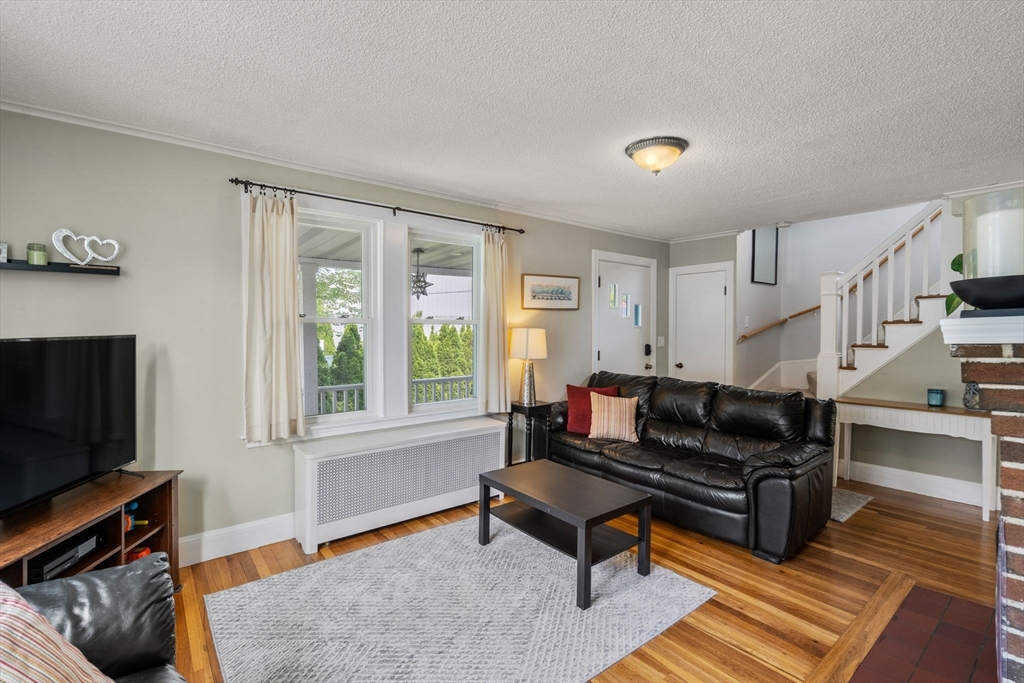
$939,900
3
bds
|
3
ba
|
1,990
sqft
|
built
2016
82 Snowbird Ave, Weymouth, MA 02190
$-2,622
Cash flow
-14.6%
Cash-on-Cash Return
2.9%
Cap rate
0.5%
Rent to Value Ratio
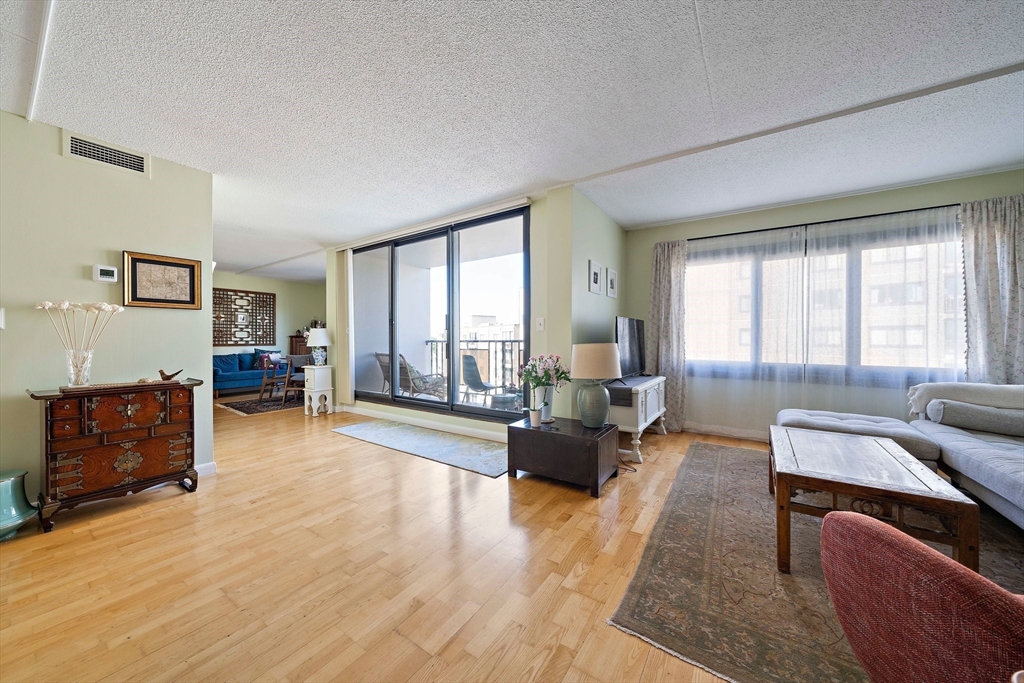
Active
$299,900
1
bds
|
1
ba
|
526
sqft
|
built
1973
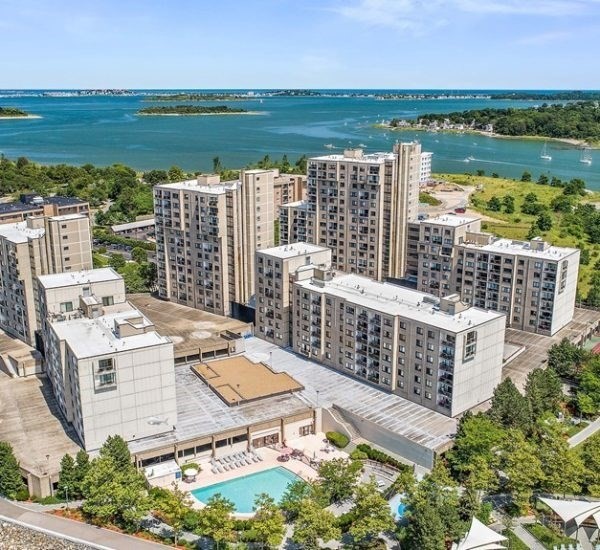
73 Broad Reach, Weymouth, MA 02191
$-923
Cash flow
-16.1%
Cash-on-Cash Return
2.6%
Cap rate
0.6%
Rent to Value Ratio
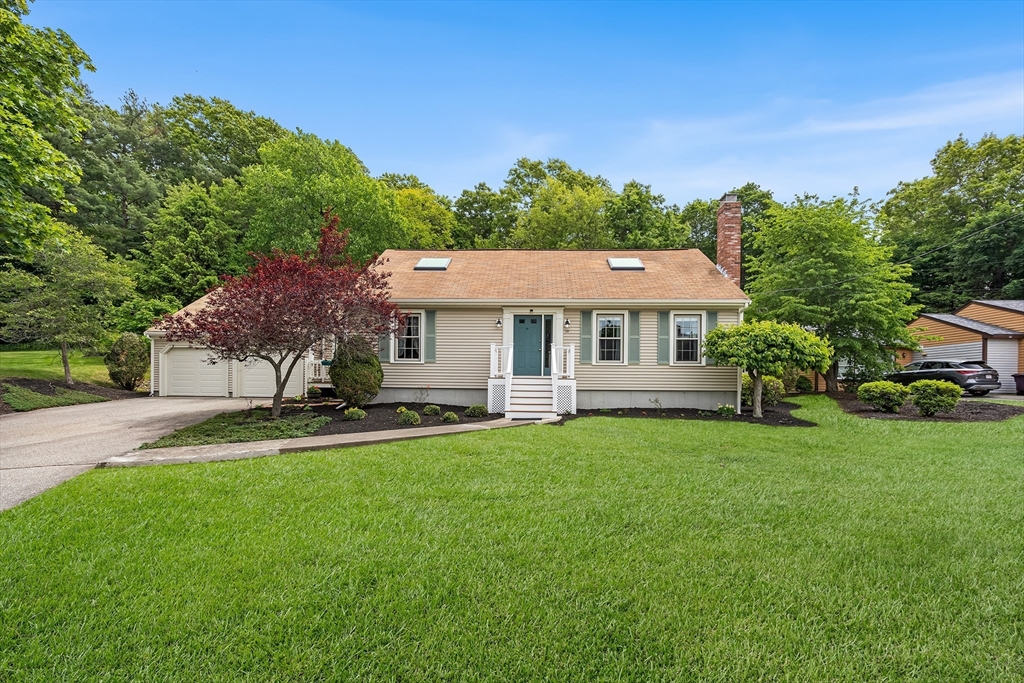
Active
$499,000
4
bds
|
3
ba
|
1,510
sqft
|
built
1908
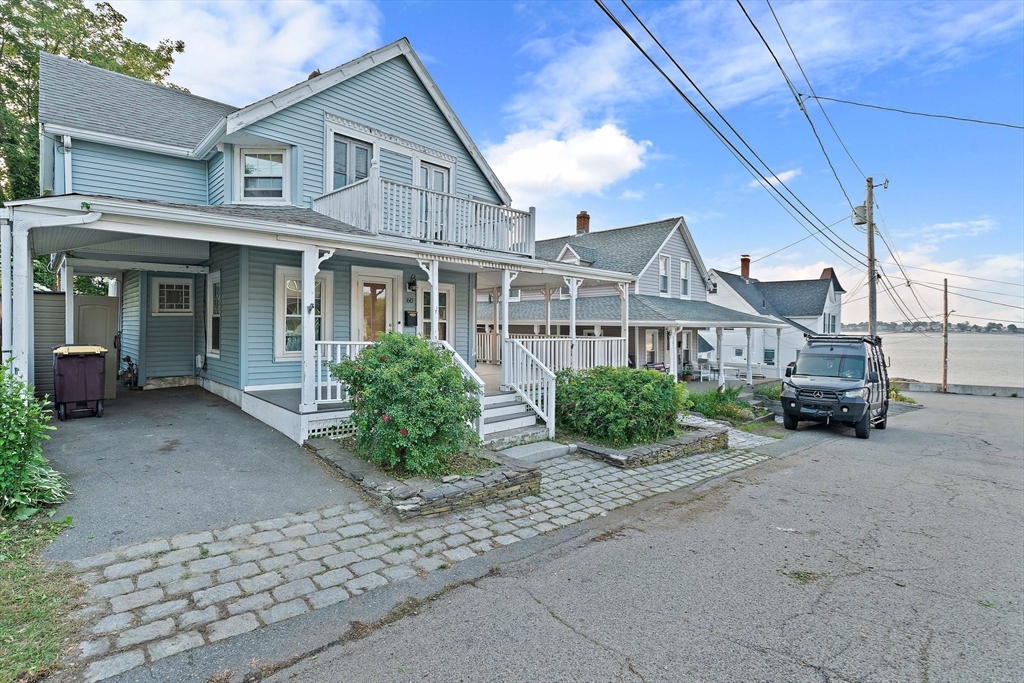
60 Holbrook Rd, Weymouth, MA 02191
$-639
Cash flow
-6.7%
Cash-on-Cash Return
4.7%
Cap rate
0.7%
Rent to Value Ratio
Active
$410,000
2
bds
|
2
ba
|
1,078
sqft
|
built
1925
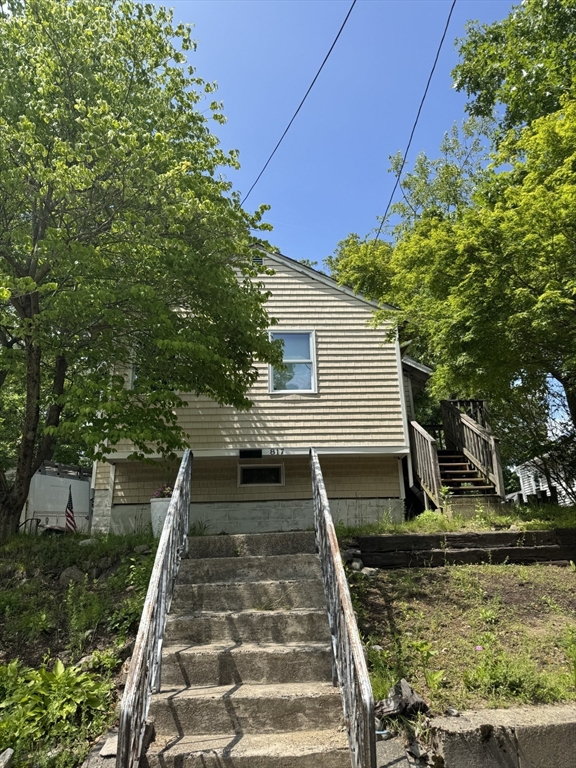
817 Middle St, Weymouth, MA 02188
$-738
Cash flow
-9.4%
Cash-on-Cash Return
4.1%
Cap rate
0.6%
Rent to Value Ratio
Active
$829,000
3
bds
|
2
ba
|
2,256
sqft
|
built
1953
24 East St, Weymouth, MA 02189
$-2,380
Cash flow
-15.0%
Cash-on-Cash Return
2.8%
Cap rate
0.4%
Rent to Value Ratio
Active under contract
$399,900
3
bds
|
1
ba
|
1,470
sqft
|
built
1935
12 Fairlawn Rd, Weymouth, MA 02191
$-103
Cash flow
-1.3%
Cash-on-Cash Return
6.0%
Cap rate
0.9%
Rent to Value Ratio
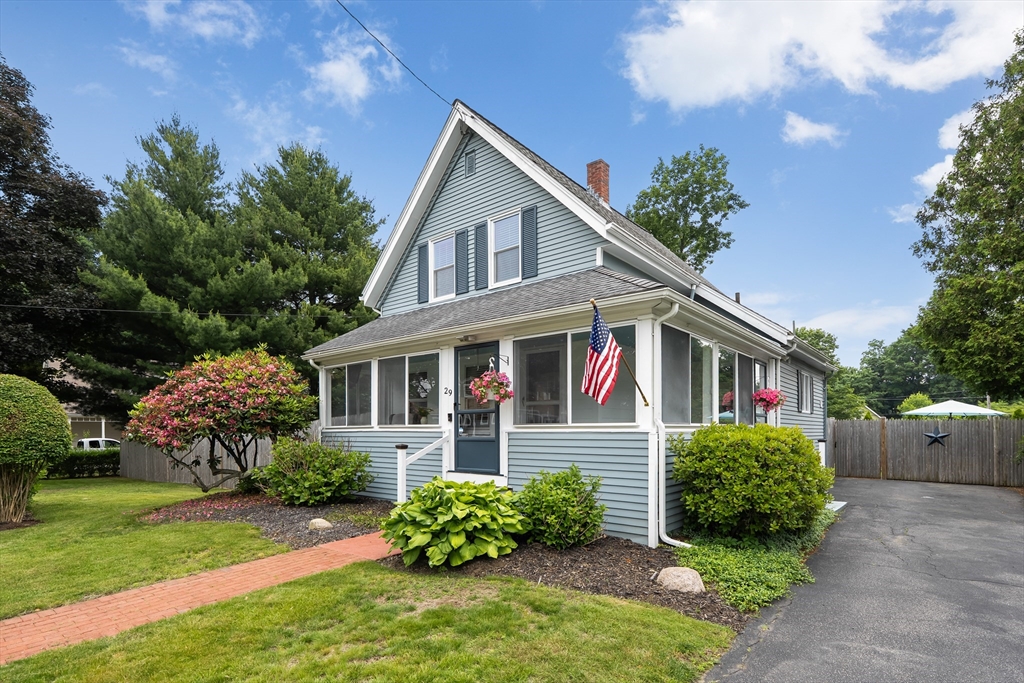
Active
$639,000
2
bds
|
2
ba
|
1,058
sqft
|
built
1878
29 Huntington Ave, Weymouth, MA 02190
$-1,768
Cash flow
-14.4%
Cash-on-Cash Return
3.0%
Cap rate
0.5%
Rent to Value Ratio
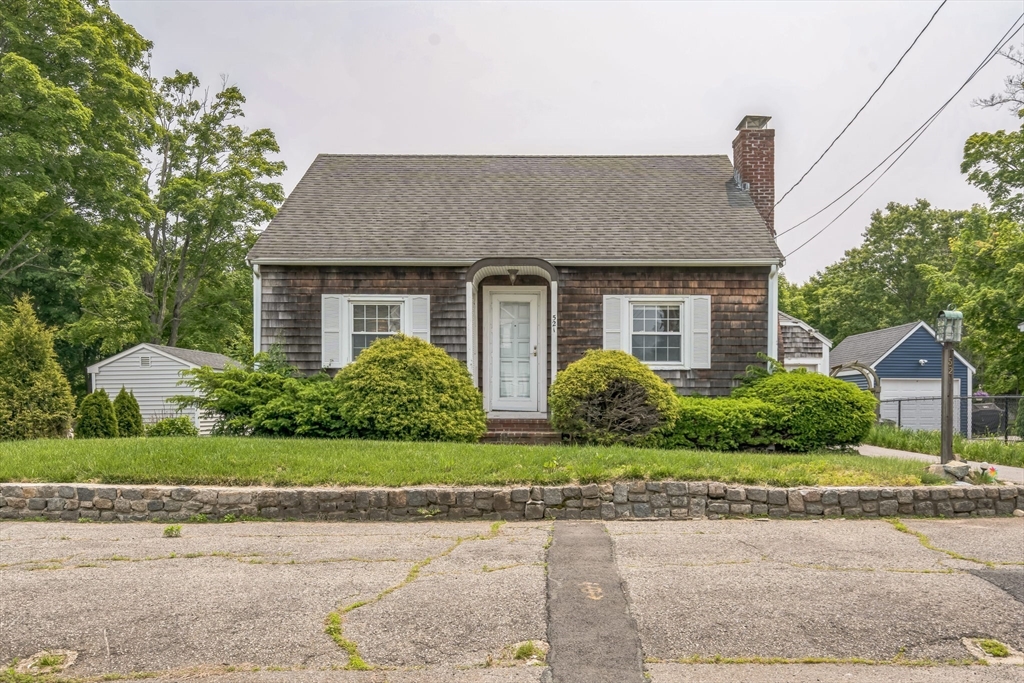
Active
$520,000
3
bds
|
2
ba
|
1,260
sqft
|
built
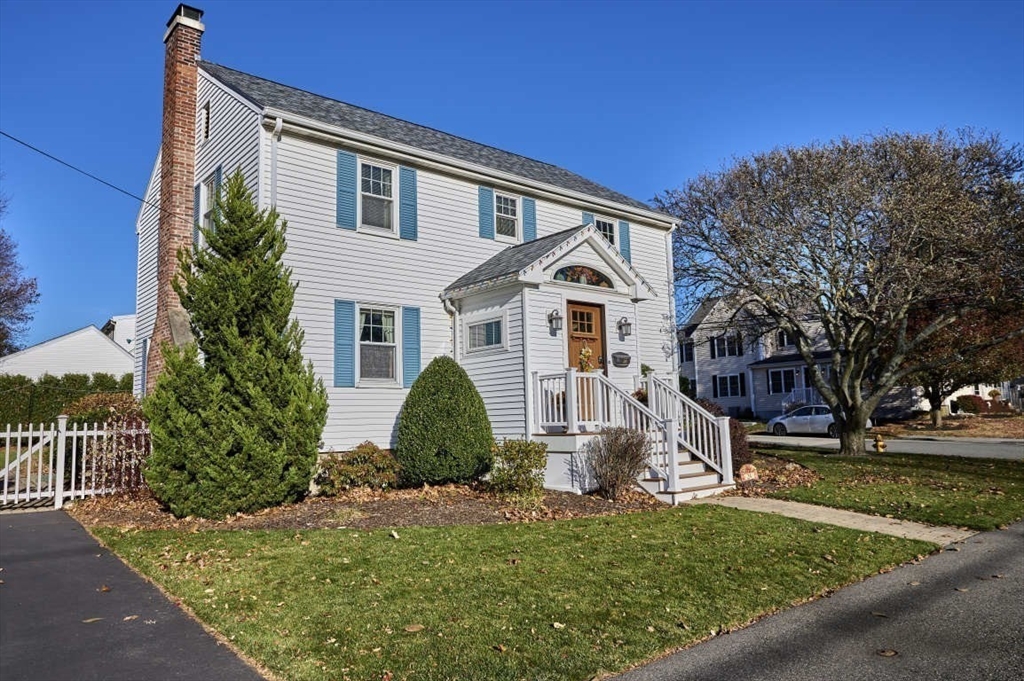
1938
521 Pleasant St, Weymouth, MA 02190
$-683
Cash flow
-6.9%
Cash-on-Cash Return
4.7%
Cap rate
0.7%
Rent to Value Ratio

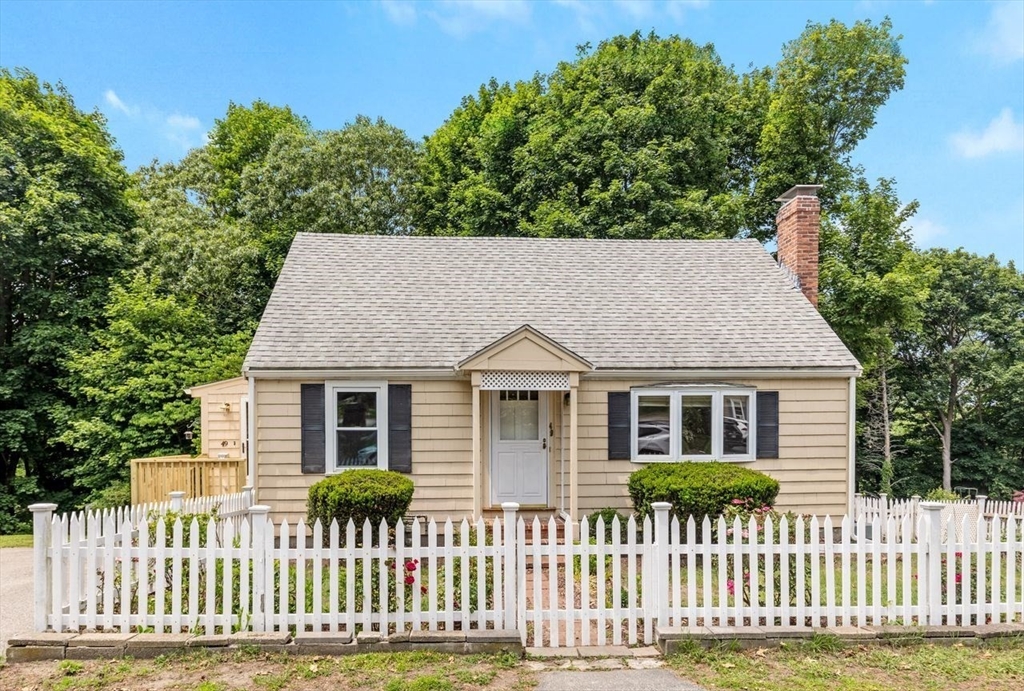
Active
$574,900
3
bds
|
1
ba
|
1,088
sqft
|
built
1943
23 Whipple St, Weymouth, MA 02190
$-1,106
Cash flow
-10.0%
Cash-on-Cash Return
4.0%
Cap rate
0.6%
Rent to Value Ratio
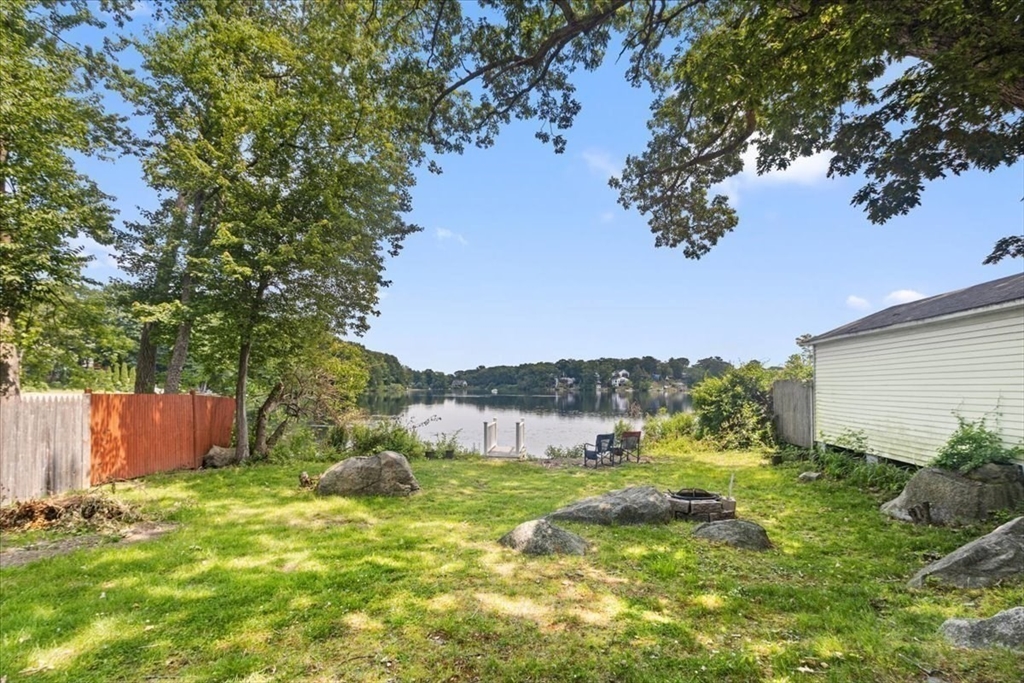
Active
$599,000
3
bds
|
2
ba
|
1,344
sqft
|
built
1958
49 Whitman St, Weymouth, MA 02189
$-1,138
Cash flow
-9.9%
Cash-on-Cash Return
4.0%
Cap rate
0.6%
Rent to Value Ratio
Active
$695,000
3
bds
|
2
ba
|
1,592
sqft
|
built
2014
14 Carlson Cv, Weymouth, MA 02189
$-1,775
Cash flow
-13.3%
Cash-on-Cash Return
3.2%
Cap rate
0.5%
Rent to Value Ratio
Active
$450,000
2
bds
|
2
ba
|
1,564
sqft
|
built
1968
188 Summer St, Weymouth, MA 02188
$-756
Cash flow
-8.8%
Cash-on-Cash Return
4.3%
Cap rate
0.6%
Rent to Value Ratio
Active
$768,888
4
bds
|
3
ba
|
1,936
sqft
|
built
1928
26 Weybosset St, Weymouth, MA 02191
$-1,965
Cash flow
-13.3%
Cash-on-Cash Return
3.2%
Cap rate
0.5%
Rent to Value Ratio
Active
$999,000
3
bds
|
3
ba
|
2,784
sqft
|
built
2016
14 Dorset Park Ln, Weymouth, MA 02190
$-2,492
Cash flow
-13.0%
Cash-on-Cash Return
3.3%
Cap rate
0.5%
Rent to Value Ratio
Active
$375,000
2
bds
|
1
ba
|
954
sqft
|
built
1975
269 Lake St, Weymouth, MA 02189
$-1,054
Cash flow
-14.7%
Cash-on-Cash Return
2.9%
Cap rate
0.6%
Rent to Value Ratio
Active
$559,000
3
bds
|
2
ba
|
1,380
sqft
|
built
1868
65 Cedar St, Weymouth, MA 02189
$-1,086
Cash flow
-10.1%
Cash-on-Cash Return
4.0%
Cap rate
0.6%
Rent to Value Ratio
Active
$829,900
5
bds
|
3
ba
|
2,609
sqft
|
built
1898
68 Putnam St, Weymouth, MA 02189
$-2,334
Cash flow
-14.7%
Cash-on-Cash Return
2.9%
Cap rate
0.4%
Rent to Value Ratio

Active
$979,000
3
bds
|
3
ba
|
3,388
sqft
|
built
2025
16 Oak Cliff Rd, Weymouth, MA 02189
$-2,980
Cash flow
-15.9%
Cash-on-Cash Return
2.6%
Cap rate
0.4%
Rent to Value Ratio
Active
$449,900
2
bds
|
2
ba
|
1,500
sqft
|
built
1984
159 Tall Oaks Dr, Weymouth, MA 02190
$-1,318
Cash flow
-15.3%
Cash-on-Cash Return
2.8%
Cap rate
0.6%
Rent to Value Ratio
Active
$565,000
2
bds
|
2
ba
|
1,216
sqft
|
built
1923
16 Orlando Ave, Weymouth, MA 02191
$-933
Cash flow
-8.6%
Cash-on-Cash Return
4.3%
Cap rate
0.6%
Rent to Value Ratio
Active under contract
$650,000
3
bds
|
2
ba
|
1,544
sqft
|
built
1910
458 Pleasant St, Weymouth, MA 02190
$-1,364
Cash flow
-10.9%
Cash-on-Cash Return
3.8%
Cap rate
0.6%
Rent to Value Ratio
Active
$629,000
5
bds
|
2
ba
|
2,112
sqft
|
built
1868
14 Mutton Ln, Weymouth, MA 02189
$-1,651
Cash flow
-13.7%
Cash-on-Cash Return
3.1%
Cap rate
0.5%
Rent to Value Ratio
Active
$925,000
2
bds
|
2
ba
|
1,248
sqft
|
built
2019
130 Broad Reach, Weymouth, MA 02191
$-2,895
Cash flow
-16.3%
Cash-on-Cash Return
2.5%
Cap rate
0.5%
Rent to Value Ratio
Active
$745,000
3
bds
|
2
ba
|
1,960
sqft
|
built
1985
19 K St, Weymouth, MA 02189
$-2,112
Cash flow
-14.8%
Cash-on-Cash Return
2.9%
Cap rate
0.5%
Rent to Value Ratio
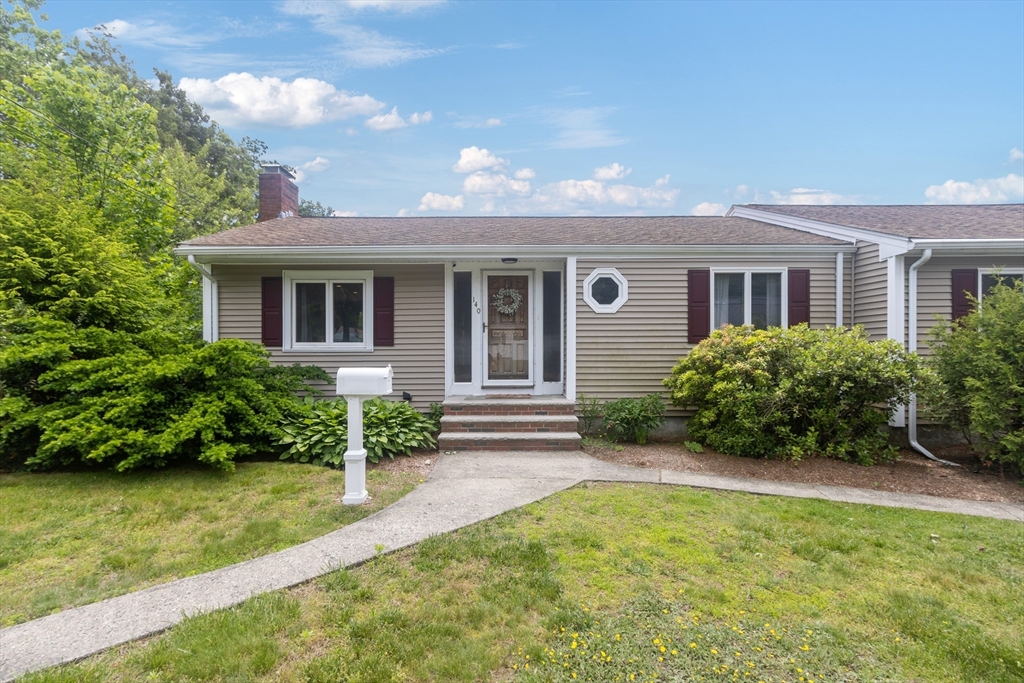
Active
$899,000
5
bds
|
5
ba
|
3,634
sqft
|
built
1958
140 West St, Weymouth, MA 02188
$-2,180
Cash flow
-12.7%
Cash-on-Cash Return
3.4%
Cap rate
0.5%
Rent to Value Ratio
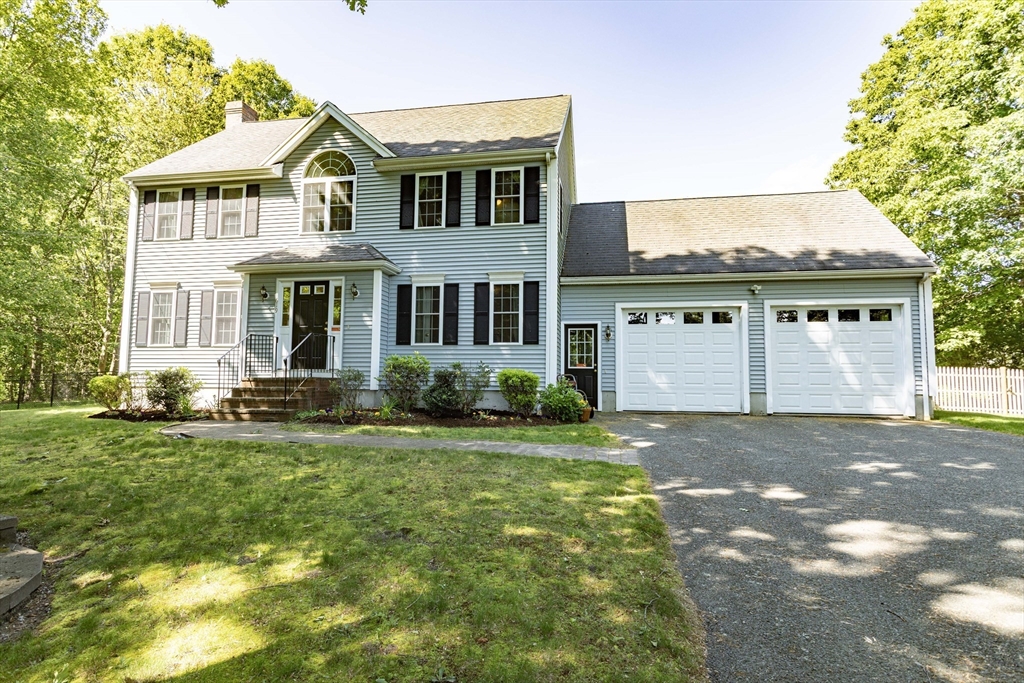
Active
$799,900
3
bds
|
3
ba
|
1,898
sqft
|
built
2003
619 Pond St, Weymouth, MA 02190
$-2,156
Cash flow
-14.1%
Cash-on-Cash Return
3.0%
Cap rate
0.5%
Rent to Value Ratio
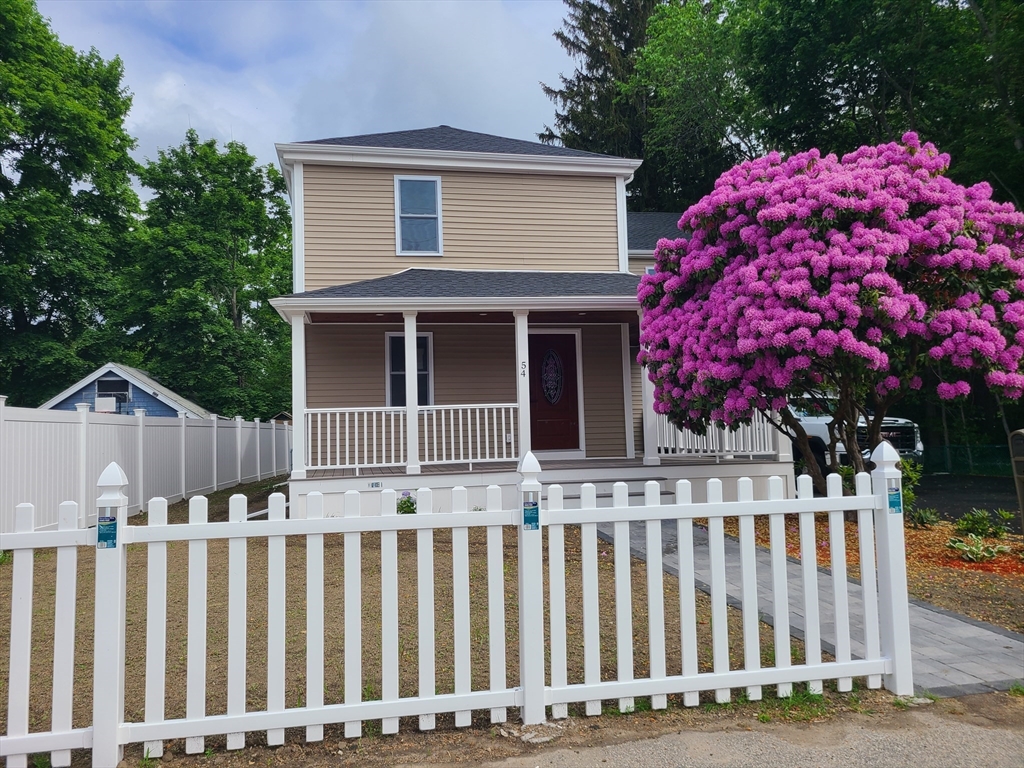
Active
$879,900
4
bds
|
4
ba
|
2,537
sqft
|
built
1912
54 Federal St, Weymouth, MA 02188
$-3,428
Cash flow
-20.3%
Cash-on-Cash Return
1.6%
Cap rate
0.3%
Rent to Value Ratio
Active under contract
$419,900
3
bds
|
1
ba
|
1,148
sqft
|
built
1922
96 Manzanetta Ave, Weymouth, MA 02188
$-349
Cash flow
-4.3%
Cash-on-Cash Return
5.3%
Cap rate
0.8%
Rent to Value Ratio
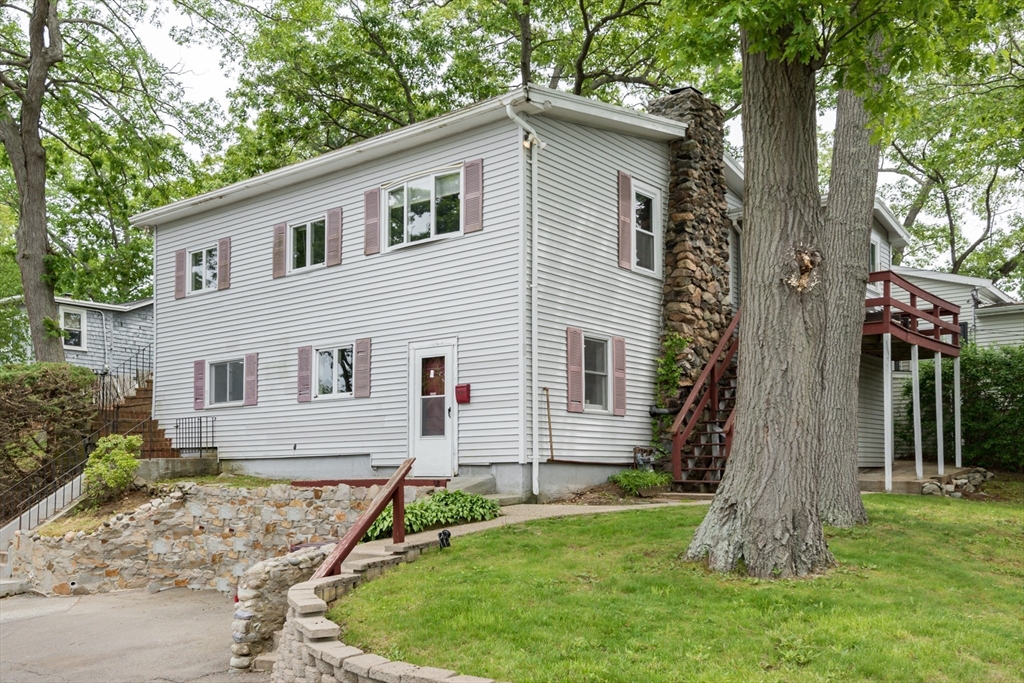
Active
$624,900
4
bds
|
2
ba
|
1,180
sqft
|
built
1928
38 Colonial Rd, Weymouth, MA 02191
$-1,445
Cash flow
-12.1%
Cash-on-Cash Return
3.5%
Cap rate
0.5%
Rent to Value Ratio
Active
$799,900
4
bds
|
2
ba
|
2,300
sqft
|
built
1893
225 Pleasant St, Weymouth, MA 02190
$-2,590
Cash flow
-16.9%
Cash-on-Cash Return
2.4%
Cap rate
0.4%
Rent to Value Ratio
Active
$325,000
2
bds
|
1
ba
|
765
sqft
|
built
1986
10 Woodcrest Ct, Weymouth, MA 02190
$-763
Cash flow
-12.2%
Cash-on-Cash Return
3.5%
Cap rate
0.7%
Rent to Value Ratio
Active
$929,000
8
bds
|
3
ba
|
2,550
sqft
|
built
1953
59 Katherine St, Weymouth, MA 02191
$-2,309
Cash flow
-13.0%
Cash-on-Cash Return
3.3%
Cap rate
0.5%
Rent to Value Ratio
Active
$474,900
3
bds
|
3
ba
|
1,576
sqft
|
built
1986
61 Broad Reach, Weymouth, MA 02191
$-1,401
Cash flow
-15.4%
Cash-on-Cash Return
2.7%
Cap rate
0.8%
Rent to Value Ratio
Active
$910,000
4
bds
|
3
ba
|
2,880
sqft
|
built
1976
29 Wituwamat Rd, Weymouth, MA 02191
$-1,895
Cash flow
-10.9%
Cash-on-Cash Return
3.8%
Cap rate
0.5%
Rent to Value Ratio
Active
$639,900
4
bds
|
1
ba
|
1,536
sqft
|
built
1923
18 Genevieve Rd, Weymouth, MA 02189
$-1,342
Cash flow
-10.9%
Cash-on-Cash Return
3.8%
Cap rate
0.5%
Rent to Value Ratio

Pending
$649,900
4
bds
|
2
ba
|
2,417
sqft
|
built
1898
73 Webb St, Weymouth, MA 02188
$-1,369
Cash flow
-11.0%
Cash-on-Cash Return
3.8%
Cap rate
0.6%
Rent to Value Ratio
Active
$499,900
3
bds
|
1
ba
|
972
sqft
|
built
1958
460 Front St, Weymouth, MA 02188
$-891
Cash flow
-9.3%
Cash-on-Cash Return
4.1%
Cap rate
0.6%
Rent to Value Ratio
Active
$769,999
3
bds
|
3
ba
|
1,850
sqft
|
built
2025
77 Lake Shore Dr, Weymouth, MA 02189
$-2,169
Cash flow
-14.7%
Cash-on-Cash Return
2.9%
Cap rate
0.4%
Rent to Value Ratio

Active
$879,900
4
bds
|
3
ba
|
2,596
sqft
|
built
1913
203 Pond St, Weymouth, MA 02190
$-2,799
Cash flow
-16.6%
Cash-on-Cash Return
2.5%
Cap rate
0.4%
Rent to Value Ratio