Wisconsin Investment Properties for Sale
Browse homes for sale and investment properties in Wisconsin. Refine your search by price, property type, or more.
Best cash flowing properties in Wisconsin
Active
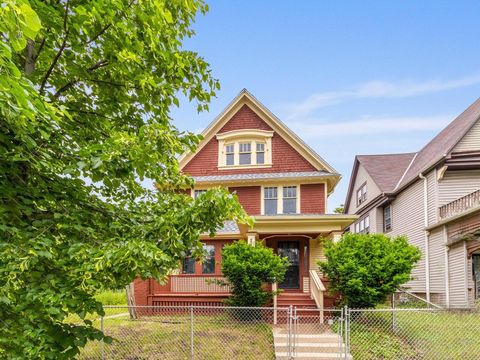
$180,000
5
bds
|
0
ba
|
2,161
sqft
|
built
1914
2647 N 21st St, Milwaukee, WI 53206
$147
Cash flow
4.3%
Cash-on-Cash Return
7.1%
Cap rate
1.0%
Rent to Value Ratio
Active
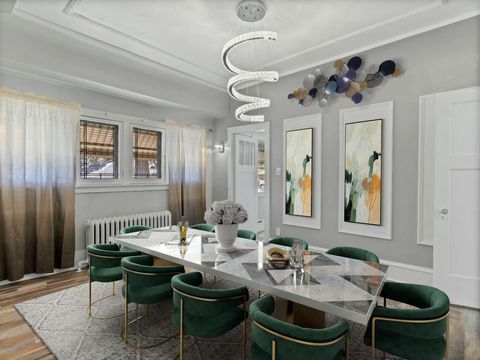
$215,000
5
bds
|
0
ba
|
1,482
sqft
|
built
1927
4101 N 14th St, Milwaukee, WI 53209
$136
Cash flow
3.3%
Cash-on-Cash Return
7.0%
Cap rate
1.0%
Rent to Value Ratio
3,248 out of 12,739 properties for sale in Wisconsin
Limited Results Shown
Create a free account, or log in to reveal all property listings and enjoy the complete experience.
Active
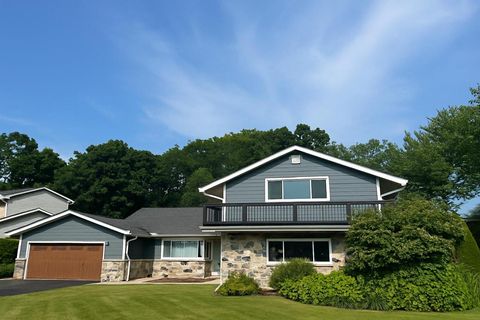
$524,900
3
bds
|
0
ba
|
2,554
sqft
|
built
1957
3460 N 169th St, Brookfield, WI 53005
$-840
Cash flow
-8.3%
Cash-on-Cash Return
4.2%
Cap rate
0.6%
Rent to Value Ratio
Active
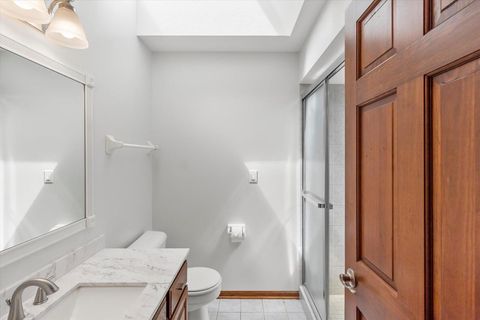
$315,000
2
bds
|
0
ba
|
1,864
sqft
|
built
1995
2975 River Birch Dr, Brookfield, WI 53045
$-509
Cash flow
-8.4%
Cash-on-Cash Return
4.2%
Cap rate
0.6%
Rent to Value Ratio
Active
$445,000
5
bds
|
0
ba
|
1,872
sqft
|
built
1892
2427 S Wentworth Ave, Milwaukee, WI 53207
$-1,731
Cash flow
-20.3%
Cash-on-Cash Return
1.5%
Cap rate
0.4%
Rent to Value Ratio
Active
$224,900
4
bds
|
0
ba
|
1,971
sqft
|
built
1926
4515 N 28th St, Milwaukee, WI 53209
$-65
Cash flow
-1.5%
Cash-on-Cash Return
5.8%
Cap rate
0.9%
Rent to Value Ratio
Active
$1,995,000
4
bds
|
0
ba
|
6,104
sqft
|
built
1999
904 N Ponderosa Dr, Hartland, WI 53029
$-8,432
Cash flow
-22.1%
Cash-on-Cash Return
1.2%
Cap rate
0.2%
Rent to Value Ratio
Active
$699,000
3
bds
|
0
ba
|
3,236
sqft
|
built
1996
566 Amber Ct, Colgate, WI 53017
$-2,954
Cash flow
-22.0%
Cash-on-Cash Return
1.2%
Cap rate
0.3%
Rent to Value Ratio
Active
$549,900
4
bds
|
0
ba
|
2,358
sqft
|
built
1979
W365N7134 Mc Mahon Rd, Oconomowoc, WI 53066
$-1,215
Cash flow
-11.5%
Cash-on-Cash Return
3.5%
Cap rate
0.5%
Rent to Value Ratio
Active
$195,000
2
bds
|
0
ba
|
824
sqft
|
built
1952
332 Oak Ridge Dr, Twin Lakes, WI 53181
$74
Cash flow
2.0%
Cash-on-Cash Return
6.7%
Cap rate
0.9%
Rent to Value Ratio
Active
$540,000
3
bds
|
0
ba
|
1,864
sqft
|
built
2022
727 Fairway Dr, Twin Lakes, WI 53181
$-1,229
Cash flow
-11.9%
Cash-on-Cash Return
3.5%
Cap rate
0.6%
Rent to Value Ratio
Active
$299,900
2
bds
|
0
ba
|
1,715
sqft
|
built
1949
8929 359th Ave, Twin Lakes, WI 53181
$-226
Cash flow
-3.9%
Cash-on-Cash Return
5.3%
Cap rate
0.7%
Rent to Value Ratio
Active
$449,900
4
bds
|
0
ba
|
2,128
sqft
|
built
1979
W330S7517 Split Rail Dr, Mukwonago, WI 53149
$-1,289
Cash flow
-14.9%
Cash-on-Cash Return
2.8%
Cap rate
0.4%
Rent to Value Ratio
Active
$374,900
3
bds
|
0
ba
|
1,628
sqft
|
built
1936
7008 N Rockledge Ave, Glendale, WI 53209
$-731
Cash flow
-10.2%
Cash-on-Cash Return
3.9%
Cap rate
0.7%
Rent to Value Ratio
Active
$149,900
2
bds
|
0
ba
|
1,177
sqft
|
built
1972
2200 W Good Hope Rd, Glendale, WI 53209
$-2
Cash flow
-0.1%
Cash-on-Cash Return
6.2%
Cap rate
0.9%
Rent to Value Ratio
Active
$225,000
2
bds
|
0
ba
|
1,103
sqft
|
built
1952
N1240 S Lake Shore Dr, Genoa City, WI 53128
$-592
Cash flow
-13.7%
Cash-on-Cash Return
3.1%
Cap rate
0.5%
Rent to Value Ratio
Active
$339,000
3
bds
|
0
ba
|
1,240
sqft
|
built
1998
1014 Pheasant Dr, Genoa City, WI 53128
$-852
Cash flow
-13.1%
Cash-on-Cash Return
3.2%
Cap rate
0.5%
Rent to Value Ratio
Active
$525,000
4
bds
|
0
ba
|
1,826
sqft
|
built
2015
1549 E Monroe Ave, Hartford, WI 53027
$-1,282
Cash flow
-12.7%
Cash-on-Cash Return
3.2%
Cap rate
0.5%
Rent to Value Ratio
Active
$319,000
3
bds
|
0
ba
|
1,678
sqft
|
built
2009
1831 New Port Vista Dr, Grafton, WI 53024
$-462
Cash flow
-7.6%
Cash-on-Cash Return
4.5%
Cap rate
0.7%
Rent to Value Ratio
Active
$249,900
2
bds
|
0
ba
|
980
sqft
|
built
1919
2447 S 84th St, West Allis, WI 53227
$-415
Cash flow
-8.7%
Cash-on-Cash Return
4.2%
Cap rate
0.7%
Rent to Value Ratio
Active
$270,000
3
bds
|
0
ba
|
1,320
sqft
|
built
1956
7820 N 46th St, Brown Deer, WI 53223
$-685
Cash flow
-13.2%
Cash-on-Cash Return
3.2%
Cap rate
0.6%
Rent to Value Ratio
Active
$359,900
4
bds
|
0
ba
|
1,712
sqft
|
built
1935
3436 S 38th St, Milwaukee, WI 53215
$-960
Cash flow
-13.9%
Cash-on-Cash Return
2.9%
Cap rate
0.6%
Rent to Value Ratio
Active
$299,900
5
bds
|
0
ba
|
2,934
sqft
|
built
1920
2715 N 76th St, Milwaukee, WI 53222
$-1,080
Cash flow
-18.8%
Cash-on-Cash Return
1.8%
Cap rate
0.4%
Rent to Value Ratio

Active
$339,900
4
bds
|
0
ba
|
1,878
sqft
|
built
1949
2745 S 45th St, Milwaukee, WI 53219
$-882
Cash flow
-13.5%
Cash-on-Cash Return
3.0%
Cap rate
0.6%
Rent to Value Ratio
Active
$474,900
8
bds
|
0
ba
|
3,092
sqft
|
built
1912
2856 N Frederick Ave, Milwaukee, WI 53211
$-2,027
Cash flow
-22.3%
Cash-on-Cash Return
1.0%
Cap rate
0.4%
Rent to Value Ratio
Active
$189,900
3
bds
|
0
ba
|
1,633
sqft
|
built
1890
6352 N 104th St, Milwaukee, WI 53225
$15
Cash flow
0.4%
Cash-on-Cash Return
6.2%
Cap rate
0.9%
Rent to Value Ratio
Active
$262,000
3
bds
|
0
ba
|
1,456
sqft
|
built
1953
8808 W Burleigh St, Milwaukee, WI 53222
$-616
Cash flow
-12.3%
Cash-on-Cash Return
3.3%
Cap rate
0.6%
Rent to Value Ratio
Active
$249,900
1
bds
|
0
ba
|
864
sqft
|
built
1945
1924 N Hubbard St, Milwaukee, WI 53212
$-811
Cash flow
-16.9%
Cash-on-Cash Return
2.3%
Cap rate
0.5%
Rent to Value Ratio
Active
$639,999
4
bds
|
0
ba
|
2,406
sqft
|
built
1939
4318 N Ardmore Ave, Milwaukee, WI 53211
$-2,030
Cash flow
-16.5%
Cash-on-Cash Return
2.3%
Cap rate
0.5%
Rent to Value Ratio
Active
$159,900
3
bds
|
0
ba
|
889
sqft
|
built
1945
4958 S 20th St, Milwaukee, WI 53221
$-157
Cash flow
-5.1%
Cash-on-Cash Return
5.0%
Cap rate
0.8%
Rent to Value Ratio
Active
$335,000
1
bds
|
0
ba
|
1,262
sqft
|
built
2003
1925 N Water St, Milwaukee, WI 53202
$-1,120
Cash flow
-17.4%
Cash-on-Cash Return
2.1%
Cap rate
0.5%
Rent to Value Ratio
Active
$359,900
4
bds
|
0
ba
|
1,758
sqft
|
built
1954
6619 W Fremont Pl, Milwaukee, WI 53219
$-1,101
Cash flow
-16.0%
Cash-on-Cash Return
2.5%
Cap rate
0.4%
Rent to Value Ratio
Active
$195,900
3
bds
|
0
ba
|
1,006
sqft
|
built
1963
6217 W Spokane St, Milwaukee, WI 53223
$-177
Cash flow
-4.7%
Cash-on-Cash Return
5.1%
Cap rate
0.8%
Rent to Value Ratio
Active
$469,900
4
bds
|
0
ba
|
3,112
sqft
|
built
2010
1814 Lynnette Ct, Eau Claire, WI 54703
$-1,480
Cash flow
-16.4%
Cash-on-Cash Return
2.5%
Cap rate
0.5%
Rent to Value Ratio
Active
$300,000
4
bds
|
0
ba
|
1,988
sqft
|
built
1959
1216 E Lexington Blvd, Eau Claire, WI 54701
$-887
Cash flow
-15.4%
Cash-on-Cash Return
2.7%
Cap rate
0.5%
Rent to Value Ratio
Active
$660,000
4
bds
|
0
ba
|
4,168
sqft
|
built
1996
8103 W Folsom St, Eau Claire, WI 54703
$-2,886
Cash flow
-22.8%
Cash-on-Cash Return
1.0%
Cap rate
0.2%
Rent to Value Ratio
Active
$309,000
3
bds
|
0
ba
|
1,216
sqft
|
built
1977
2025 Severson St, Eau Claire, WI 54703
$-891
Cash flow
-15.0%
Cash-on-Cash Return
2.8%
Cap rate
0.5%
Rent to Value Ratio
Active
$240,000
3
bds
|
0
ba
|
1,650
sqft
|
built
1927
904 Romayne Ave, Racine, WI 53402
$-301
Cash flow
-6.5%
Cash-on-Cash Return
4.8%
Cap rate
0.8%
Rent to Value Ratio
Active
$524,900
4
bds
|
0
ba
|
3,015
sqft
|
built
1959
4729 James Ave, Racine, WI 53402
$-1,494
Cash flow
-14.9%
Cash-on-Cash Return
2.8%
Cap rate
0.5%
Rent to Value Ratio
Active
$245,000
3
bds
|
0
ba
|
1,147
sqft
|
built
1967
4415 Olive St, Racine, WI 53405
$-525
Cash flow
-11.2%
Cash-on-Cash Return
3.7%
Cap rate
0.7%
Rent to Value Ratio