Worcester, MA Investment Properties for Sale
Browse homes for sale and investment properties in Worcester, MA. Refine your search by price, property type, or more.
Best cash flowing properties in Worcester, MA

Pending
$259,900
2
bds
|
2
ba
|
1,328
sqft
|
built
1893
98 Eastern Ave, Worcester, MA 01605
$-293
Cash flow
-5.9%
Cash-on-Cash Return
4.9%
Cap rate
0.9%
Rent to Value Ratio
Active under contract
$204,900
2
bds
|
1
ba
|
649
sqft
|
built
1896
926 Southbridge St, Worcester, MA 01610
$-324
Cash flow
-8.3%
Cash-on-Cash Return
4.4%
Cap rate
0.9%
Rent to Value Ratio
15 out of 29 properties for sale in Worcester, MA
Limited Results Shown
Create a free account, or log in to reveal all property listings and enjoy the complete experience.
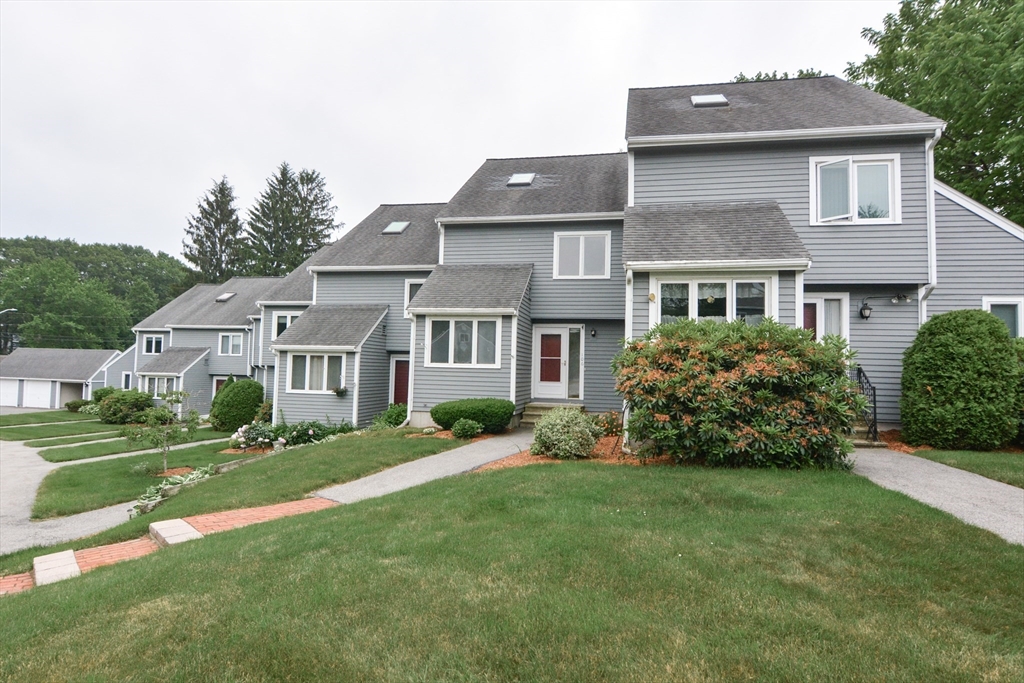
Active
$379,900
2
bds
|
2
ba
|
1,475
sqft
|
built
1984
31 Blithewood Ave, Worcester, MA 01604
$-1,058
Cash flow
-14.5%
Cash-on-Cash Return
2.9%
Cap rate
0.7%
Rent to Value Ratio
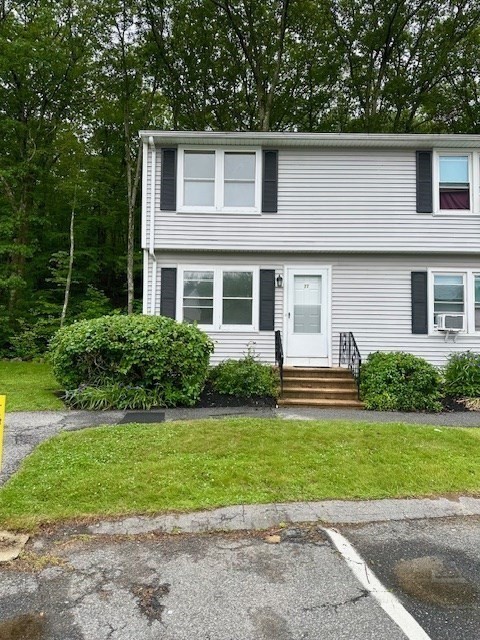
Active
$317,500
2
bds
|
2
ba
|
900
sqft
|
built
1985
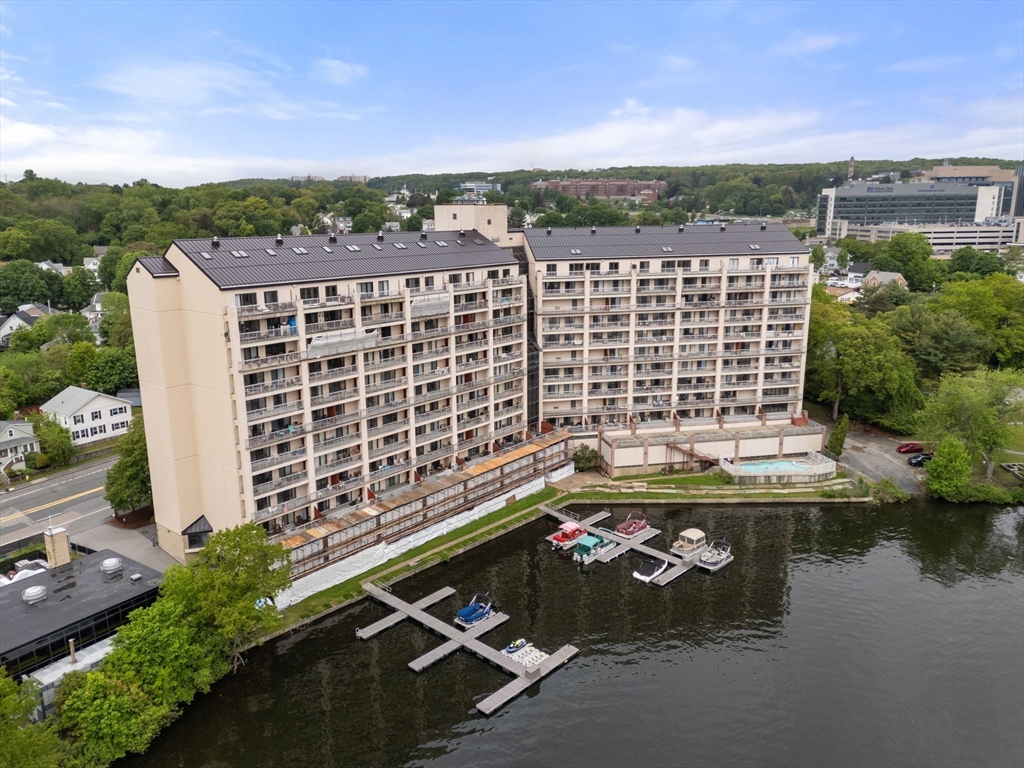
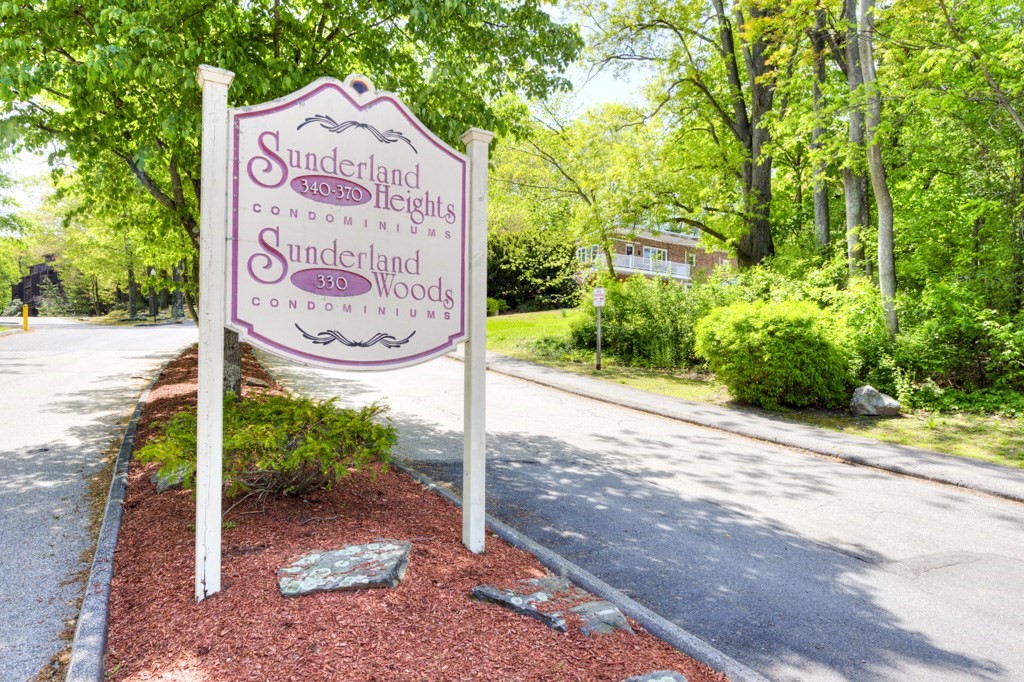
270 Sunderland Rd, Worcester, MA 01604
$-759
Cash flow
-12.5%
Cash-on-Cash Return
3.4%
Cap rate
0.7%
Rent to Value Ratio
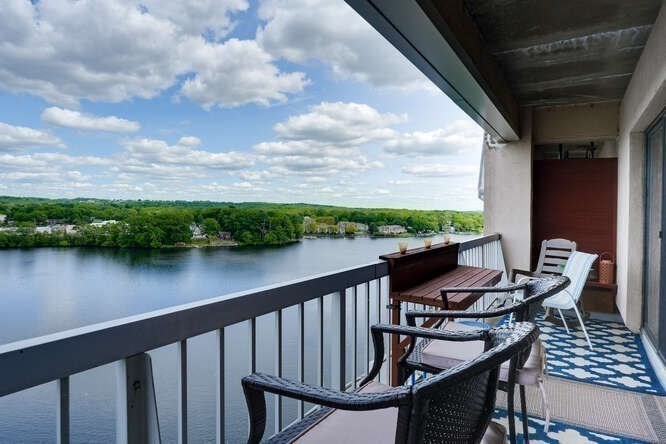
Active
$469,900
2
bds
|
2
ba
|
1,526
sqft
|
built
1988
65 Lake Ave, Worcester, MA 01604
$-1,344
Cash flow
-14.9%
Cash-on-Cash Return
2.9%
Cap rate
0.7%
Rent to Value Ratio

Active
$325,000
2
bds
|
2
ba
|
900
sqft
|
built
1985
270 Sunderland Rd, Worcester, MA 01604
$-797
Cash flow
-12.8%
Cash-on-Cash Return
3.3%
Cap rate
0.7%
Rent to Value Ratio
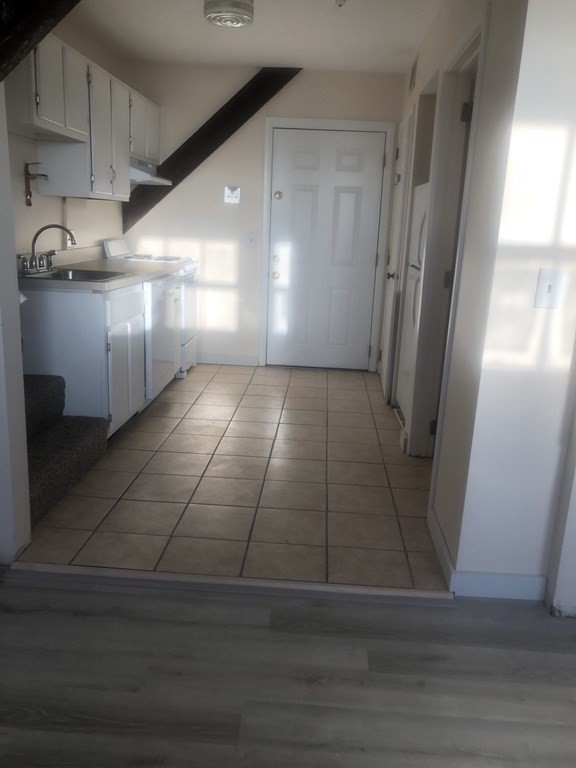
Pending
$259,900
2
bds
|
2
ba
|
1,328
sqft
|
built
1893
98 Eastern Ave, Worcester, MA 01605
$-293
Cash flow
-5.9%
Cash-on-Cash Return
4.9%
Cap rate
0.9%
Rent to Value Ratio
Active
$525,000
2
bds
|
2
ba
|
1,738
sqft
|
built
1988
65 Lake Ave, Worcester, MA 01604
$-2,212
Cash flow
-22.0%
Cash-on-Cash Return
1.2%
Cap rate
0.7%
Rent to Value Ratio
Active under contract
$299,000
2
bds
|
2
ba
|
992
sqft
|
built
1982
340 Sunderland Rd, Worcester, MA 01604
$-705
Cash flow
-12.3%
Cash-on-Cash Return
3.5%
Cap rate
0.7%
Rent to Value Ratio

Active
$310,000
2
bds
|
2
ba
|
1,119
sqft
|
built
1986
330 Sunderland Rd, Worcester, MA 01604
$-744
Cash flow
-12.5%
Cash-on-Cash Return
3.4%
Cap rate
0.7%
Rent to Value Ratio
Active
$465,000
2
bds
|
2
ba
|
1,527
sqft
|
built
1988
65 Lake Ave, Worcester, MA 01604
$-985
Cash flow
-11.1%
Cash-on-Cash Return
3.7%
Cap rate
0.8%
Rent to Value Ratio
Active
$205,000
1
bds
|
1
ba
|
575
sqft
|
built
1979
70 Southbridge St, Worcester, MA 01608
$-808
Cash flow
-20.6%
Cash-on-Cash Return
1.6%
Cap rate
0.8%
Rent to Value Ratio

Active
$564,000
3
bds
|
3
ba
|
3,438
sqft
|
built
1988
65 Lake Ave, Worcester, MA 01604
$-2,095
Cash flow
-19.4%
Cash-on-Cash Return
1.8%
Cap rate
1.1%
Rent to Value Ratio
Active under contract
$204,900
2
bds
|
1
ba
|
649
sqft
|
built
1896
926 Southbridge St, Worcester, MA 01610
$-324
Cash flow
-8.3%
Cash-on-Cash Return
4.4%
Cap rate
0.9%
Rent to Value Ratio
Active
$282,500
2
bds
|
2
ba
|
992
sqft
|
built
1982
340 Sunderland Rd, Worcester, MA 01604
$-607
Cash flow
-11.2%
Cash-on-Cash Return
3.7%
Cap rate
0.8%
Rent to Value Ratio

Active
$272,000
2
bds
|
1
ba
|
994
sqft
|
built
1940
31 Chestnut St, Worcester, MA 01609
$-775
Cash flow
-14.9%
Cash-on-Cash Return
2.9%
Cap rate
0.7%
Rent to Value Ratio
Active
$599,000
4
bds
|
3
ba
|
3,393
sqft
|
built
1988
65 Lake Ave, Worcester, MA 01604
$-3,719
Cash flow
-32.4%
Cash-on-Cash Return
-1.2%
Cap rate
0.7%
Rent to Value Ratio