01420 Investment Properties for Sale
Browse homes for sale and investment properties in 01420. Refine your search by price, property type, or more.
Best cash flowing properties in 01420
Active
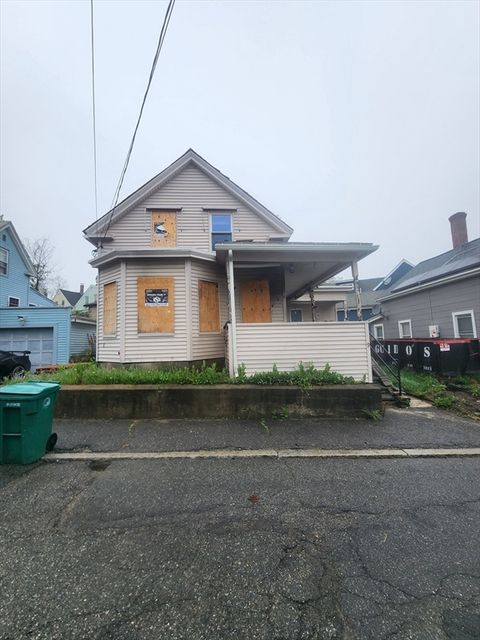
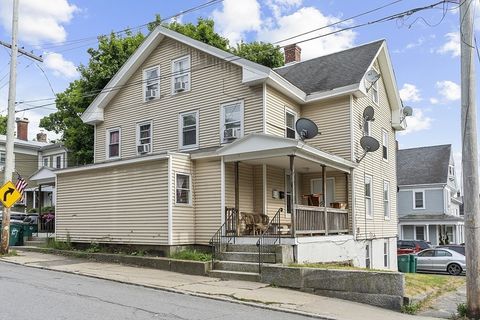
$199,000
3
bds
|
1
ba
|
1,060
sqft
|
built
1900
9 Brigham St, Fitchburg, MA 01420
$416
Cash flow
10.9%
Cash-on-Cash Return
8.2%
Cap rate
1.2%
Rent to Value Ratio

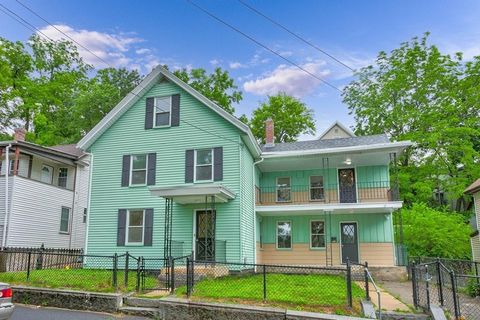
Active
$190,000
2
bds
|
1
ba
|
920
sqft
|
built
1987
33 Huron St, Fitchburg, MA 01420
$-178
Cash flow
-4.9%
Cash-on-Cash Return
4.6%
Cap rate
0.9%
Rent to Value Ratio
24 out of 67 properties for sale in 01420
Limited Results Shown
Create a free account, or log in to reveal all property listings and enjoy the complete experience.
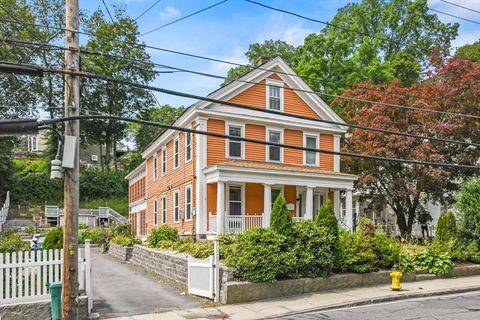
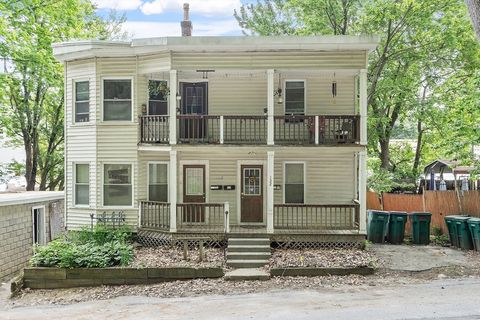
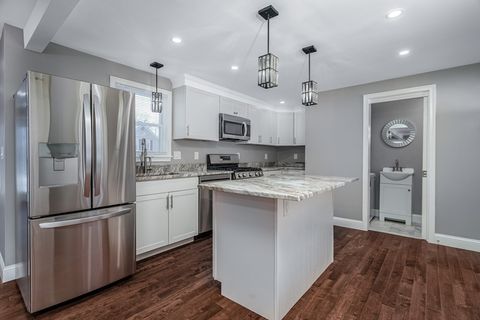
Active
$599,000
4
bds
|
2
ba
|
3,550
sqft
|
built
1835
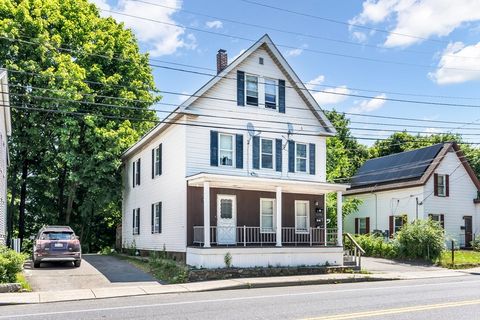
90 Mechanic St, Fitchburg, MA 01420
$-506
Cash flow
-4.4%
Cash-on-Cash Return
4.7%
Cap rate
0.7%
Rent to Value Ratio
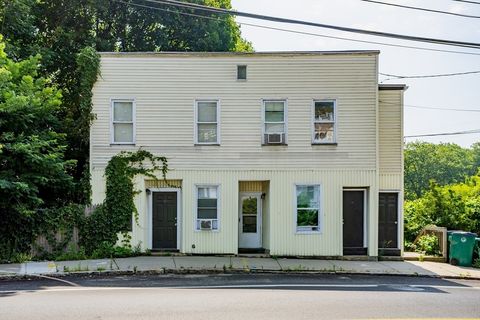
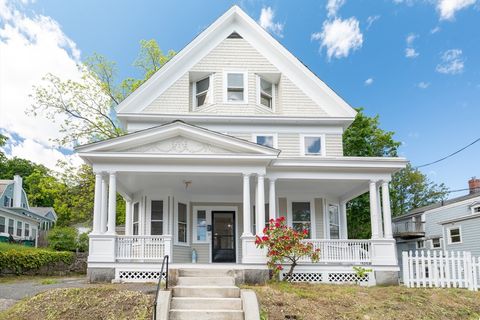
Active
$599,000
7
bds
|
4
ba
|
3,344
sqft
|
built
1900
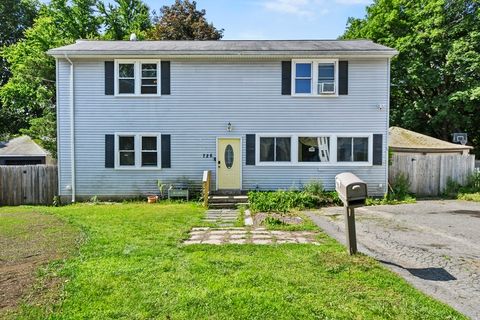
13-17 Westminster St, Fitchburg, MA 01420
$-1,985
Cash flow
-17.3%
Cash-on-Cash Return
1.7%
Cap rate
0.3%
Rent to Value Ratio
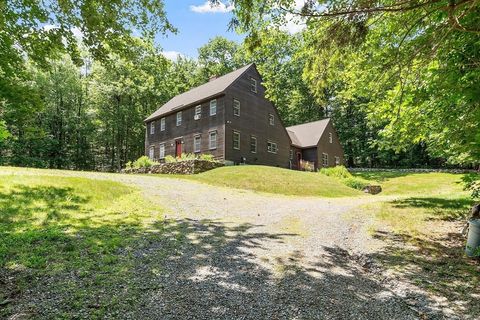
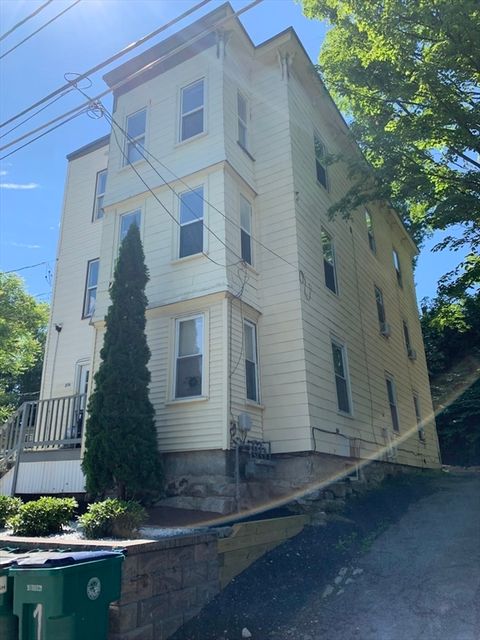
Active
$698,000
4
bds
|
3
ba
|
3,120
sqft
|
built
1992
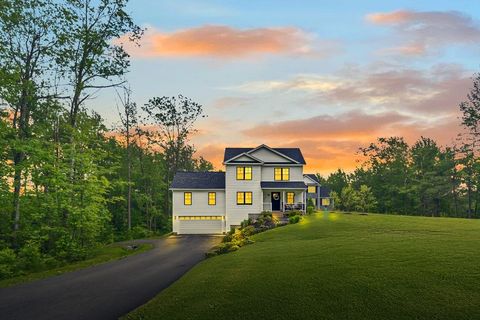
794 Ashburnham Hill Rd, Fitchburg, MA 01420
$-1,265
Cash flow
-9.5%
Cash-on-Cash Return
3.5%
Cap rate
0.6%
Rent to Value Ratio
Active
$509,900
5
bds
|
3
ba
|
2,088
sqft
|
built
1931
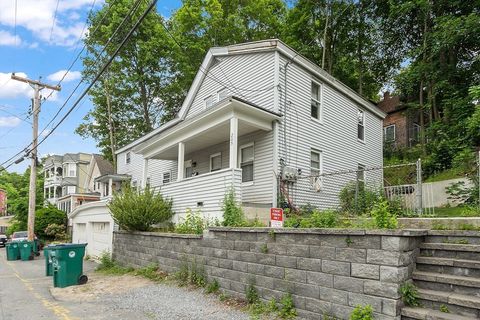
1130 Water St, Fitchburg, MA 01420
$-968
Cash flow
-9.9%
Cash-on-Cash Return
3.4%
Cap rate
0.5%
Rent to Value Ratio

Active
$610,000
3
bds
|
3
ba
|
2,312
sqft
|
built
2001
505 Old South St, Fitchburg, MA 01420
$-940
Cash flow
-8.0%
Cash-on-Cash Return
3.8%
Cap rate
0.6%
Rent to Value Ratio
Active
$425,000
6
bds
|
3
ba
|
2,584
sqft
|
built
1929
726 Blossom St, Fitchburg, MA 01420
$-837
Cash flow
-10.3%
Cash-on-Cash Return
3.3%
Cap rate
0.5%
Rent to Value Ratio
Active
$579,400
3
bds
|
3
ba
|
1,836
sqft
|
built
2023
182 Sheldon Rd, Fitchburg, MA 01420
$-862
Cash flow
-7.8%
Cash-on-Cash Return
3.9%
Cap rate
0.6%
Rent to Value Ratio
Active
$385,000
5
bds
|
2
ba
|
2,115
sqft
|
built
1900
205-207 High St, Fitchburg, MA 01420
$-510
Cash flow
-6.9%
Cash-on-Cash Return
4.1%
Cap rate
0.6%
Rent to Value Ratio

Active
$479,777
4
bds
|
2
ba
|
2,244
sqft
|
built
1895
14 Felton St, Fitchburg, MA 01420
$-973
Cash flow
-10.6%
Cash-on-Cash Return
3.2%
Cap rate
0.5%
Rent to Value Ratio
Active
$650,000
3
bds
|
2
ba
|
2,360
sqft
|
built
1930
840 Fisher Rd, Fitchburg, MA 01420
$-1,177
Cash flow
-9.4%
Cash-on-Cash Return
3.5%
Cap rate
0.5%
Rent to Value Ratio
Active
$724,900
12
bds
|
5
ba
|
3,947
sqft
|
built
1910
107-109 Prichard St, Fitchburg, MA 01420
$-2,639
Cash flow
-19.0%
Cash-on-Cash Return
1.3%
Cap rate
0.3%
Rent to Value Ratio
Active
$510,000
4
bds
|
2
ba
|
2,195
sqft
|
built
1917
108 Walton St, Fitchburg, MA 01420
$-677
Cash flow
-6.9%
Cash-on-Cash Return
4.1%
Cap rate
0.6%
Rent to Value Ratio
Active
$499,000
8
bds
|
2
ba
|
2,408
sqft
|
built
1910
29 Goddard St, Fitchburg, MA 01420
$-920
Cash flow
-9.6%
Cash-on-Cash Return
3.5%
Cap rate
0.5%
Rent to Value Ratio
Active
$500,000
5
bds
|
3
ba
|
1,937
sqft
|
built
1937
132 Hazel St, Fitchburg, MA 01420
$-1,051
Cash flow
-11.0%
Cash-on-Cash Return
3.2%
Cap rate
0.5%
Rent to Value Ratio
Active
$491,900
4
bds
|
3
ba
|
1,800
sqft
|
built
1890
70 Sanborn St, Fitchburg, MA 01420
$-441
Cash flow
-4.7%
Cash-on-Cash Return
4.6%
Cap rate
0.7%
Rent to Value Ratio
Active
$536,000
5
bds
|
2
ba
|
3,422
sqft
|
built
1910
59 Arlington St, Fitchburg, MA 01420
$-426
Cash flow
-4.1%
Cash-on-Cash Return
4.7%
Cap rate
0.7%
Rent to Value Ratio
Active
$629,000
9
bds
|
3
ba
|
3,264
sqft
|
built
1920
276 Fairmount St, Fitchburg, MA 01420
$-1,756
Cash flow
-14.6%
Cash-on-Cash Return
2.3%
Cap rate
0.4%
Rent to Value Ratio
Active
$549,900
5
bds
|
2
ba
|
2,123
sqft
|
built
1900
351 Lunenburg St, Fitchburg, MA 01420
$-1,450
Cash flow
-13.8%
Cash-on-Cash Return
2.5%
Cap rate
0.5%
Rent to Value Ratio
Active
$515,000
4
bds
|
3
ba
|
3,021
sqft
|
built
1926
224 Blossom St, Fitchburg, MA 01420
$-470
Cash flow
-4.8%
Cash-on-Cash Return
4.6%
Cap rate
0.7%
Rent to Value Ratio

Active
$639,000
5
bds
|
5
ba
|
2,430
sqft
|
built
1940
44-46 Oliver St, Fitchburg, MA 01420
$-1,563
Cash flow
-12.8%
Cash-on-Cash Return
2.7%
Cap rate
0.4%
Rent to Value Ratio

Active
$708,675
8
bds
|
4
ba
|
4,564
sqft
|
built
1900
156 Summer St, Fitchburg, MA 01420
$-2,156
Cash flow
-15.9%
Cash-on-Cash Return
2.0%
Cap rate
0.4%
Rent to Value Ratio

Active
$799,000
5
bds
|
3
ba
|
3,461
sqft
|
built
1988
72 Rinnock Rd, Fitchburg, MA 01420
$-908
Cash flow
-5.9%
Cash-on-Cash Return
4.3%
Cap rate
0.6%
Rent to Value Ratio