01475 Investment Properties for Sale
Browse homes for sale and investment properties in 01475. Refine your search by price, property type, or more.
Best cash flowing properties in 01475
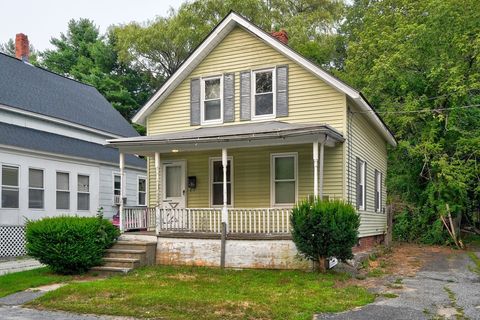
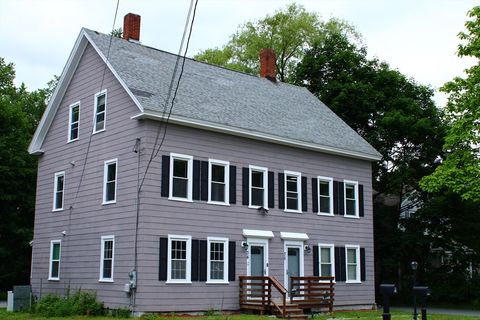
Active
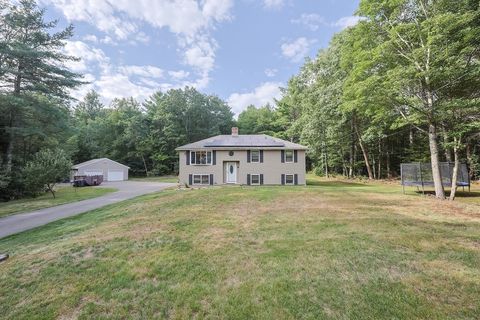
$189,900
2
bds
|
1
ba
|
919
sqft
|
built
1900
31 Webster St, Winchendon, MA 01475
$167
Cash flow
4.6%
Cash-on-Cash Return
6.7%
Cap rate
0.9%
Rent to Value Ratio
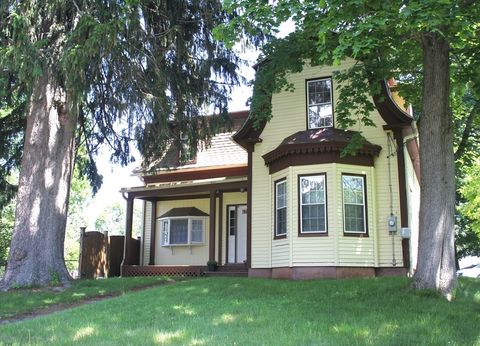
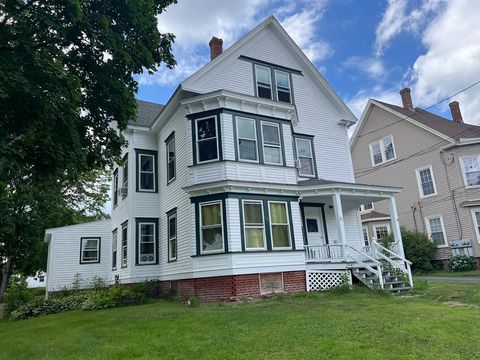
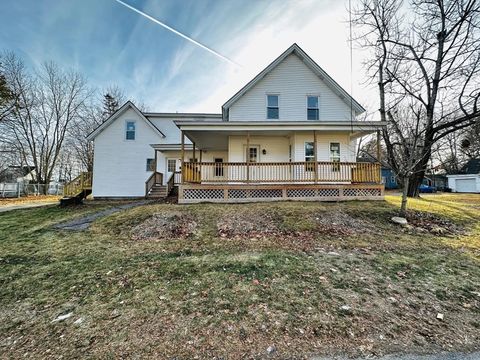
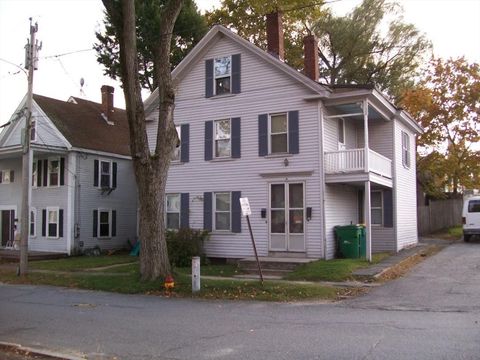
Active
$440,000
3
bds
|
2
ba
|
2,151
sqft
|
built
1854
32 Ash St, Winchendon, MA 01475
$10
Cash flow
0.1%
Cash-on-Cash Return
5.7%
Cap rate
0.8%
Rent to Value Ratio
18 out of 23 properties for sale in 01475
Limited Results Shown
Create a free account, or log in to reveal all property listings and enjoy the complete experience.
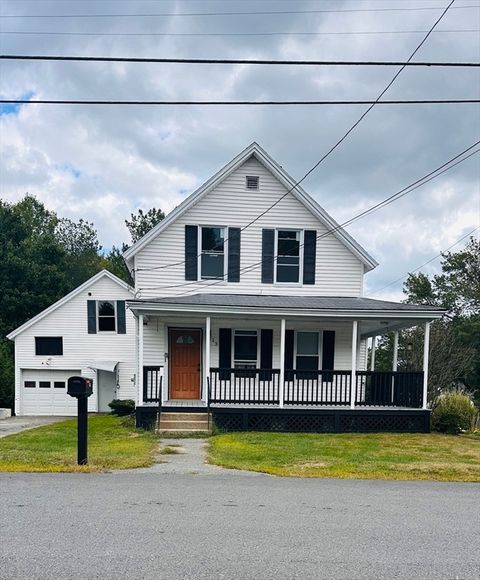
Active
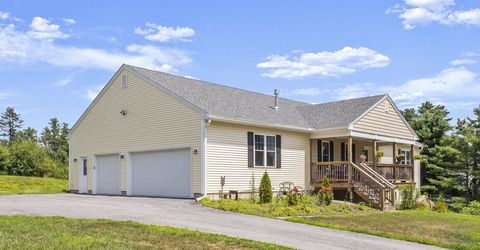
$375,000
3
bds
|
2
ba
|
1,567
sqft
|
built
1900
13 Woodlawn St, Winchendon, MA 01475
$-481
Cash flow
-6.7%
Cash-on-Cash Return
4.1%
Cap rate
0.6%
Rent to Value Ratio
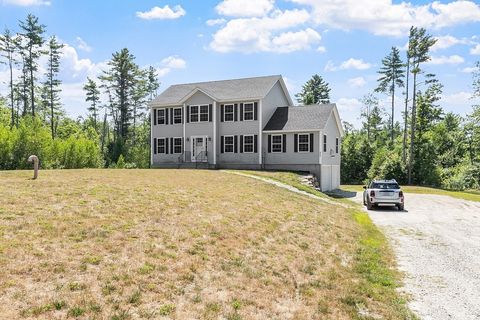
Active
$425,000
5
bds
|
2
ba
|
2,544
sqft
|
built
1980
150-152 Mill Cir, Winchendon, MA 01475
$-913
Cash flow
-11.2%
Cash-on-Cash Return
3.1%
Cap rate
0.5%
Rent to Value Ratio
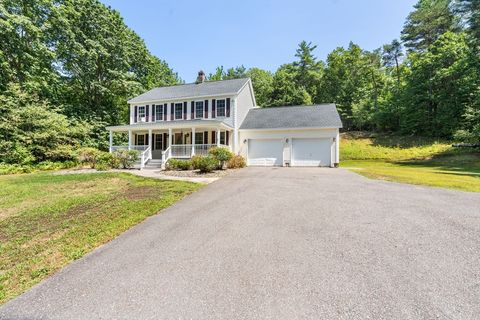
Active
$449,900
3
bds
|
2
ba
|
1,698
sqft
|
built
1987
11 Independence Dr, Winchendon, MA 01475
$-666
Cash flow
-7.7%
Cash-on-Cash Return
3.9%
Cap rate
0.6%
Rent to Value Ratio
Active
$500,000
8
bds
|
3
ba
|
3,044
sqft
|
built
1890
90 Linden St, Winchendon, MA 01475
$-1,216
Cash flow
-12.7%
Cash-on-Cash Return
2.8%
Cap rate
0.4%
Rent to Value Ratio
Active
$489,900
3
bds
|
2
ba
|
1,568
sqft
|
built
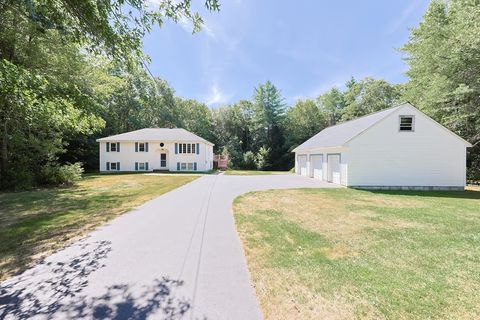
2005
32 Old County Rd, Winchendon, MA 01475
$-717
Cash flow
-7.6%
Cash-on-Cash Return
3.9%
Cap rate
0.6%
Rent to Value Ratio
Active
$450,000
3
bds
|
3
ba
|
1,666
sqft
|
built
1999
160 Lakeshore Dr, Winchendon, MA 01475
$-609
Cash flow
-7.1%
Cash-on-Cash Return
4.1%
Cap rate
0.6%
Rent to Value Ratio
Active
$575,000
3
bds
|
3
ba
|
2,120
sqft
|
built
2020
405 Hale St, Winchendon, MA 01475
$-1,013
Cash flow
-9.2%
Cash-on-Cash Return
3.6%
Cap rate
0.6%
Rent to Value Ratio
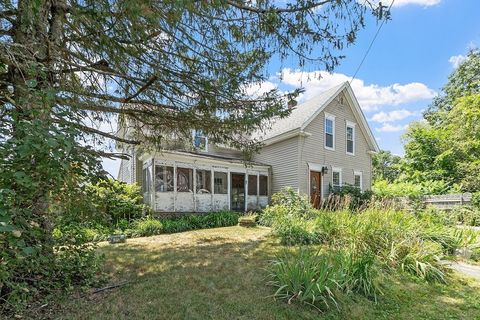
Active
$349,900
3
bds
|
2
ba
|
1,750
sqft
|
built
1870
18 Pearl St, Winchendon, MA 01475
$-176
Cash flow
-2.6%
Cash-on-Cash Return
5.1%
Cap rate
0.7%
Rent to Value Ratio
Active
$560,000
3
bds
|
2
ba
|
2,648
sqft
|
built
2004
21 Sibley Rd, Winchendon, MA 01475
$-727
Cash flow
-6.8%
Cash-on-Cash Return
4.1%
Cap rate
0.6%
Rent to Value Ratio
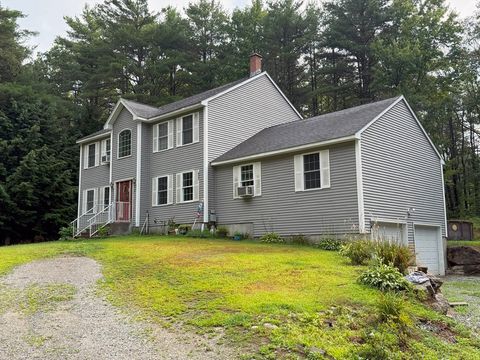
Active
$414,900
6
bds
|
3
ba
|
2,400
sqft
|
built
1880
176 Mill St, Winchendon, MA 01475
$-559
Cash flow
-7.0%
Cash-on-Cash Return
4.1%
Cap rate
0.6%
Rent to Value Ratio
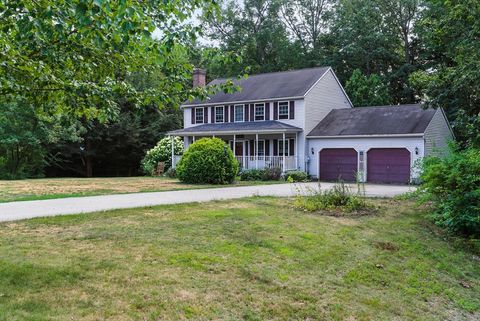
Active
$485,000
4
bds
|
2
ba
|
1,698
sqft
|
built
1987
10 Independence Dr, Winchendon, MA 01475
$-1,123
Cash flow
-12.1%
Cash-on-Cash Return
2.9%
Cap rate
0.5%
Rent to Value Ratio
Active
$549,000
3
bds
|
2
ba
|
1,634
sqft
|
built
2022
675 River St, Winchendon, MA 01475
$-1,159
Cash flow
-11.0%
Cash-on-Cash Return
3.1%
Cap rate
0.5%
Rent to Value Ratio
Active
$489,000
3
bds
|
2
ba
|
1,958
sqft
|
built
2003
421 School St, Winchendon, MA 01475
$-862
Cash flow
-9.2%
Cash-on-Cash Return
3.6%
Cap rate
0.5%
Rent to Value Ratio
Active
$569,000
4
bds
|
3
ba
|
2,866
sqft
|
built
1986
19 Otter River Rd, Winchendon, MA 01475
$-1,011
Cash flow
-9.3%
Cash-on-Cash Return
3.5%
Cap rate
0.6%
Rent to Value Ratio
Active
$425,000
6
bds
|
2
ba
|
2,204
sqft
|
built
1900
34-36 Glenallen St, Winchendon, MA 01475
$-738
Cash flow
-9.1%
Cash-on-Cash Return
3.6%
Cap rate
0.5%
Rent to Value Ratio
Active
$390,000
4
bds
|
2
ba
|
2,242
sqft
|
built
1900
19 Chestnut St, Winchendon, MA 01475
$-521
Cash flow
-7.0%
Cash-on-Cash Return
4.1%
Cap rate
0.6%
Rent to Value Ratio