01602 Investment Properties for Sale
Browse homes for sale and investment properties in 01602. Refine your search by price, property type, or more.
Best cash flowing properties in 01602
Active
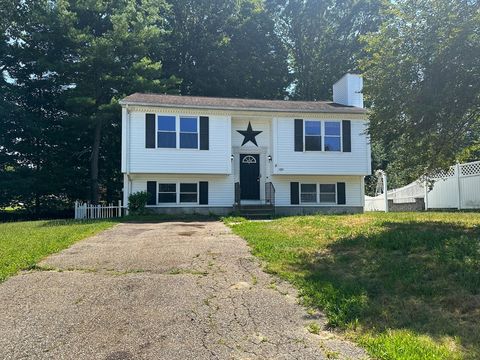
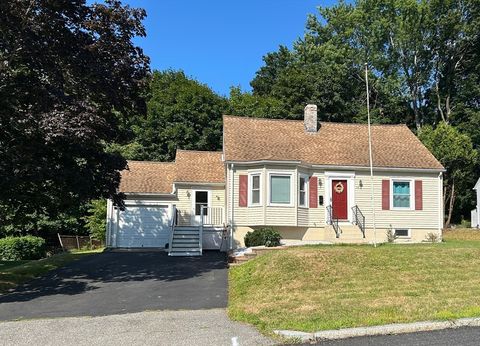
$380,000
2
bds
|
2
ba
|
1,200
sqft
|
built
1987
14 4th St, Worcester, MA 01602
$-316
Cash flow
-4.3%
Cash-on-Cash Return
4.7%
Cap rate
0.7%
Rent to Value Ratio
Active
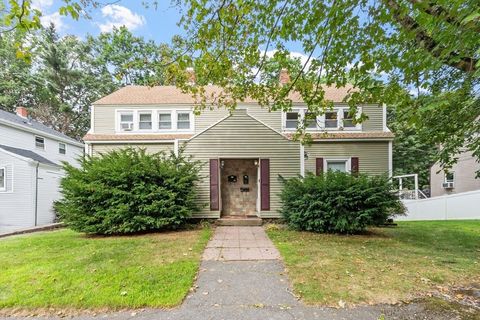
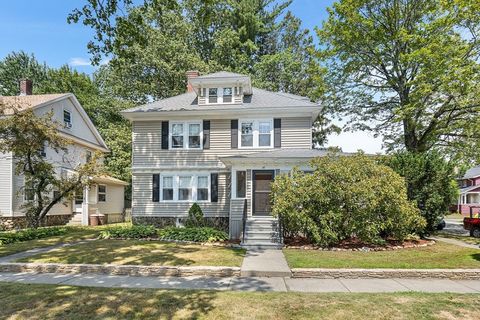
$499,900
3
bds
|
3
ba
|
1,620
sqft
|
built
1941
7 Longworth Rd, Worcester, MA 01602
$-387
Cash flow
-4.0%
Cash-on-Cash Return
4.8%
Cap rate
0.7%
Rent to Value Ratio
16 out of 21 properties for sale in 01602
Limited Results Shown
Create a free account, or log in to reveal all property listings and enjoy the complete experience.
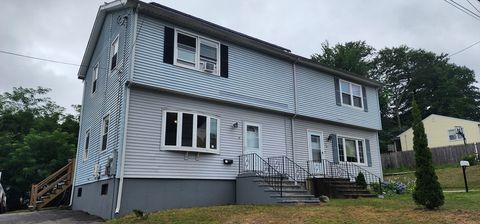
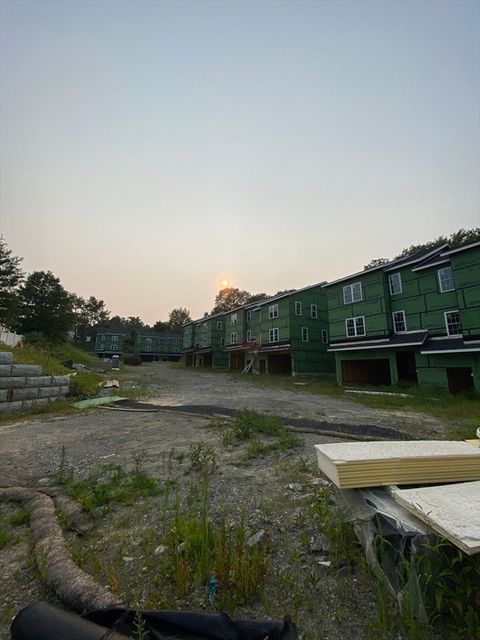
Active
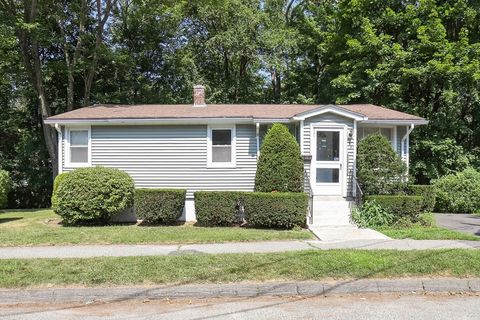
$549,900
3
bds
|
2
ba
|
1,570
sqft
|
built
2002
10 Joppa Rd, Worcester, MA 01602
$-1,101
Cash flow
-10.4%
Cash-on-Cash Return
3.3%
Cap rate
0.5%
Rent to Value Ratio
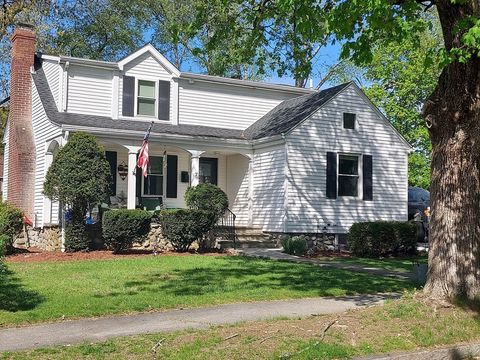
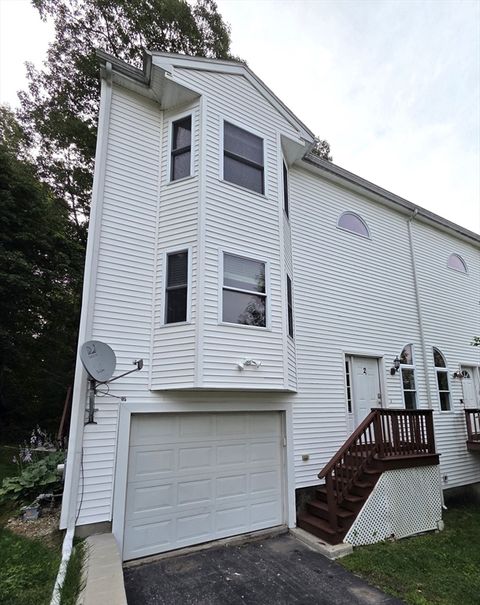
Active
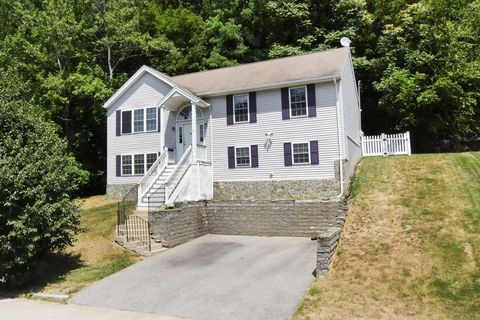
$399,000
3
bds
|
2
ba
|
1,232
sqft
|
built
1957
16 Zenith Dr, Worcester, MA 01602
$-421
Cash flow
-5.5%
Cash-on-Cash Return
4.4%
Cap rate
0.7%
Rent to Value Ratio
Active
$399,000
2
bds
|
1
ba
|
872
sqft
|
built
1999
82 4th St, Worcester, MA 01602
$-536
Cash flow
-7.0%
Cash-on-Cash Return
4.1%
Cap rate
0.6%
Rent to Value Ratio
Active
$695,000
4
bds
|
4
ba
|
2,958
sqft
|
built
1930
29 Rockrimmon Rd, Worcester, MA 01602
$-1,703
Cash flow
-12.8%
Cash-on-Cash Return
2.7%
Cap rate
0.5%
Rent to Value Ratio
Active
$6,000,000
3
bds
|
0
ba
|
0
sqft
|
built
1987
47 4th St, Worcester, MA 01602
$-26,914
Cash flow
-23.4%
Cash-on-Cash Return
0.3%
Cap rate
0.0%
Rent to Value Ratio
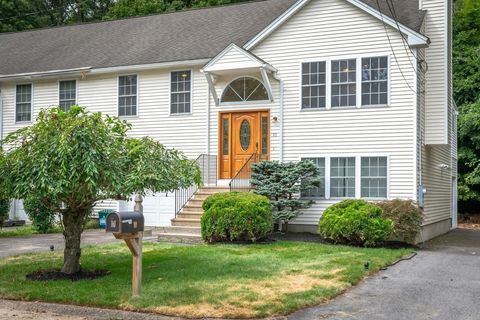
Active
$419,000
3
bds
|
2
ba
|
1,536
sqft
|
built
2004
23 Fenton Dr, Worcester, MA 01602
$-488
Cash flow
-6.1%
Cash-on-Cash Return
4.3%
Cap rate
0.7%
Rent to Value Ratio
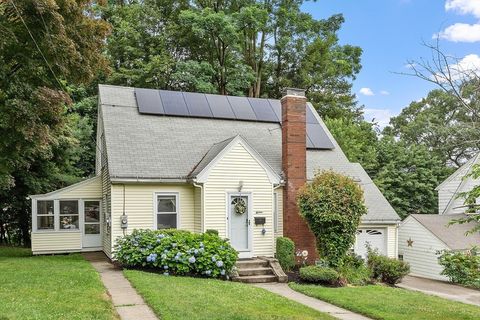
Active
$459,000
3
bds
|
2
ba
|
1,147
sqft
|
built
1943
15 Sunny Hill Dr, Worcester, MA 01602
$-555
Cash flow
-6.3%
Cash-on-Cash Return
4.2%
Cap rate
0.6%
Rent to Value Ratio
Active
$499,000
4
bds
|
2
ba
|
1,806
sqft
|
built
1920
34 Monroe Ave, Worcester, MA 01602
$-691
Cash flow
-7.2%
Cash-on-Cash Return
4.0%
Cap rate
0.6%
Rent to Value Ratio
Active
$409,000
3
bds
|
1
ba
|
1,620
sqft
|
built
1957
24 Greybert Ln, Worcester, MA 01602
$-408
Cash flow
-5.2%
Cash-on-Cash Return
4.5%
Cap rate
0.7%
Rent to Value Ratio
Active
$524,900
3
bds
|
2
ba
|
2,118
sqft
|
built
2002
16 Sherwood Rd, Worcester, MA 01602
$-779
Cash flow
-7.7%
Cash-on-Cash Return
3.9%
Cap rate
0.6%
Rent to Value Ratio
Active
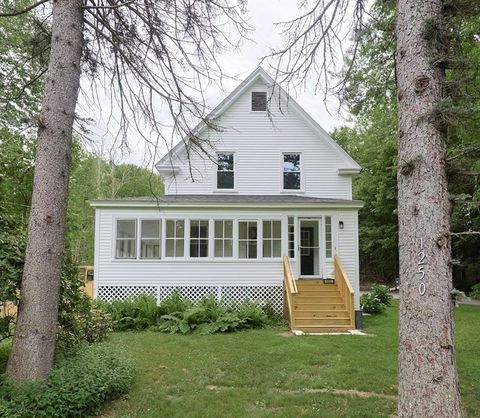
$559,999
3
bds
|
2
ba
|
1,906
sqft
|
built
1910
1250 Pleasant St, Worcester, MA 01602
$-1,265
Cash flow
-11.8%
Cash-on-Cash Return
3.0%
Cap rate
0.5%
Rent to Value Ratio
Active
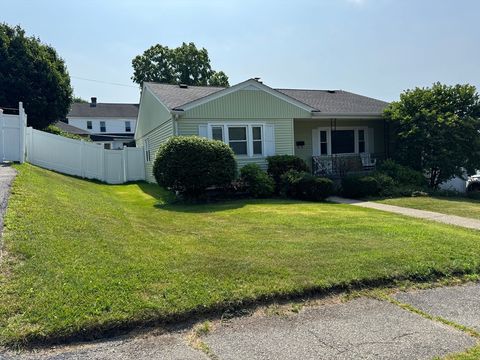
$479,000
3
bds
|
1
ba
|
1,382
sqft
|
built
1952
89 Westview Rd, Worcester, MA 01602
$-574
Cash flow
-6.3%
Cash-on-Cash Return
4.2%
Cap rate
0.6%
Rent to Value Ratio
Active
$670,000
6
bds
|
2
ba
|
2,200
sqft
|
built
1973
371 Mill St, Worcester, MA 01602
$-1,492
Cash flow
-11.6%
Cash-on-Cash Return
3.0%
Cap rate
0.5%
Rent to Value Ratio
Active
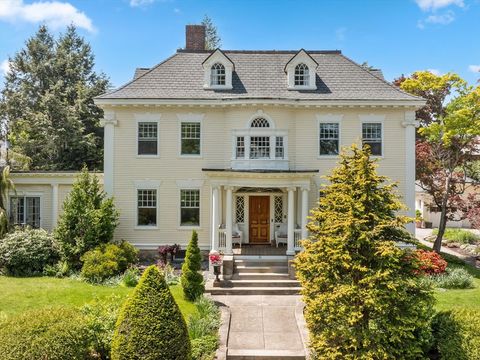
$1,345,000
7
bds
|
5
ba
|
4,868
sqft
|
built
1897
31 Lenox St, Worcester, MA 01602
$-3,384
Cash flow
-13.1%
Cash-on-Cash Return
2.7%
Cap rate
0.4%
Rent to Value Ratio