01801 Investment Properties for Sale
Browse homes for sale and investment properties in 01801. Refine your search by price, property type, or more.
Best cash flowing properties in 01801
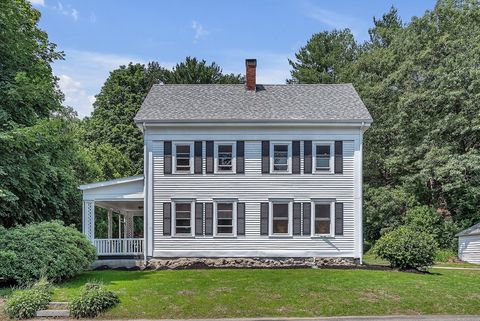
Active
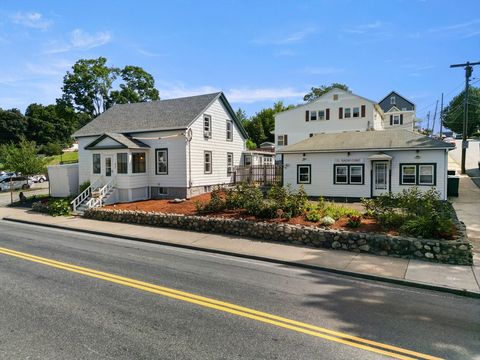
$299,900
1
bds
|
1
ba
|
630
sqft
|
built
1987
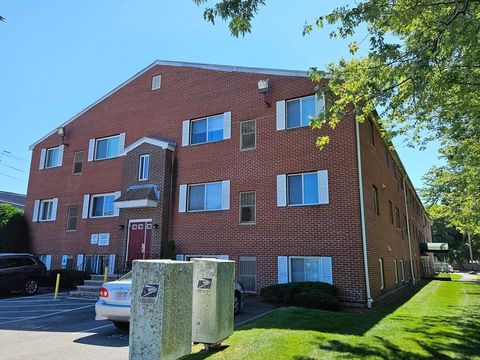
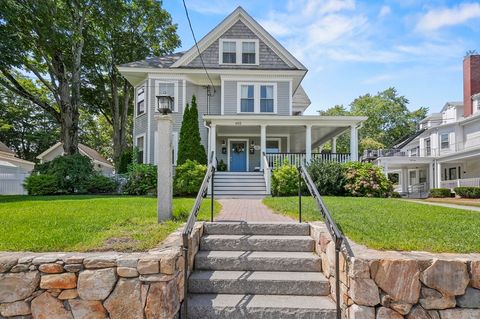
35 Prospect St, Woburn, MA 01801
$-414
Cash flow
-7.2%
Cash-on-Cash Return
4.0%
Cap rate
0.7%
Rent to Value Ratio
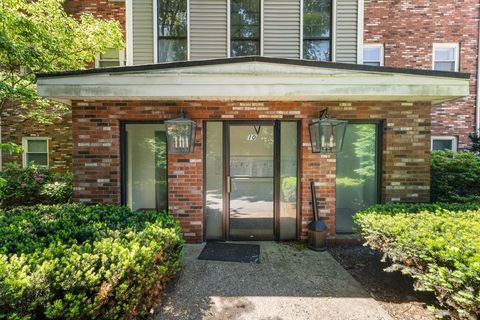
Active
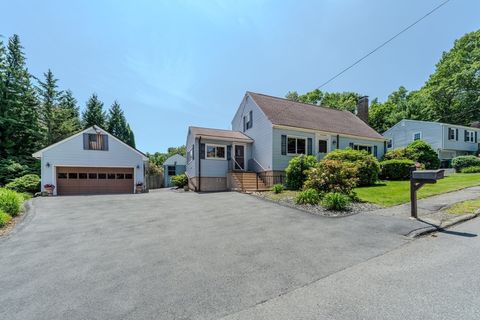
$449,900
2
bds
|
1
ba
|
1,005
sqft
|
built
1947
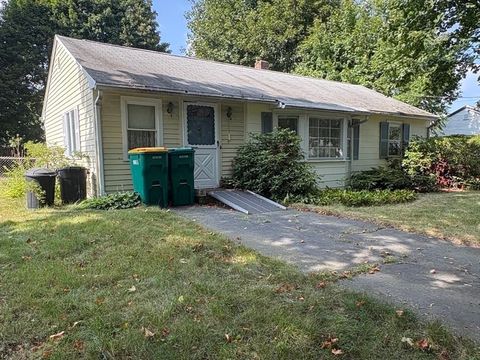
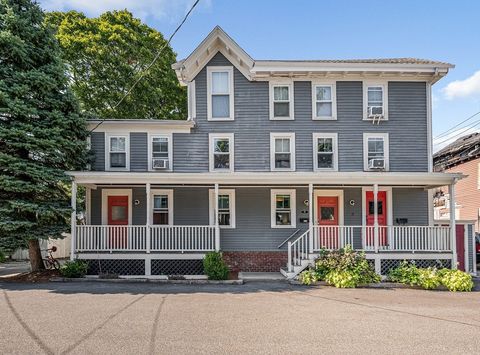
8 Boyd Rd, Woburn, MA 01801
$-561
Cash flow
-6.5%
Cash-on-Cash Return
4.2%
Cap rate
0.6%
Rent to Value Ratio
16 out of 30 properties for sale in 01801
Limited Results Shown
Create a free account, or log in to reveal all property listings and enjoy the complete experience.
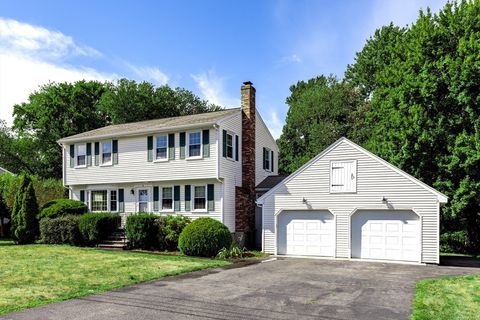
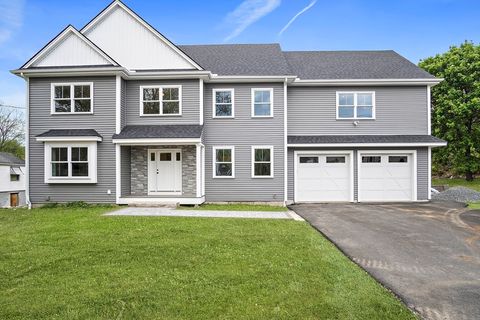
Active
$879,000
4
bds
|
2
ba
|
2,100
sqft
|
built
1980
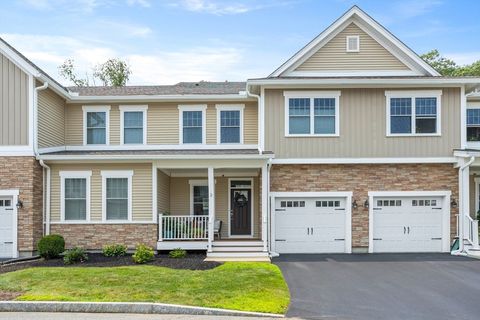
20 Barbara Cir, Woburn, MA 01801
$-1,956
Cash flow
-11.6%
Cash-on-Cash Return
3.0%
Cap rate
0.5%
Rent to Value Ratio
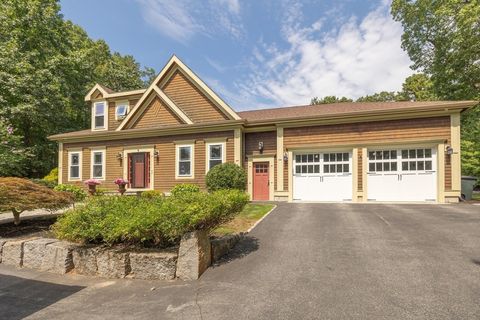
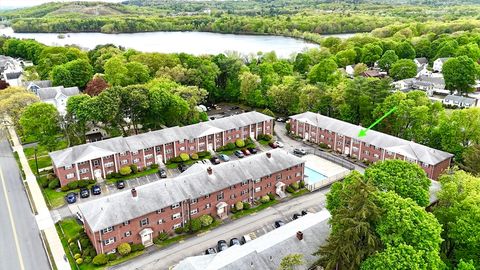
Active
$1,575,000
5
bds
|
4
ba
|
4,578
sqft
|
built
2014
9 Washington Ave, Woburn, MA 01801
$-2,357
Cash flow
-7.8%
Cash-on-Cash Return
3.9%
Cap rate
0.6%
Rent to Value Ratio
Active
$679,000
3
bds
|
2
ba
|
1,075
sqft
|
built
1895
602 Main St, Woburn, MA 01801
$-1,594
Cash flow
-12.2%
Cash-on-Cash Return
2.9%
Cap rate
0.5%
Rent to Value Ratio
Active
$549,949
2
bds
|
3
ba
|
1,528
sqft
|
built
1930
3 Richmond Park, Woburn, MA 01801
$-983
Cash flow
-9.3%
Cash-on-Cash Return
3.5%
Cap rate
0.6%
Rent to Value Ratio
Active
$865,000
3
bds
|
3
ba
|
1,800
sqft
|
built
2017
100 Baldwin Ave, Woburn, MA 01801
$-2,094
Cash flow
-12.6%
Cash-on-Cash Return
2.8%
Cap rate
0.5%
Rent to Value Ratio
Active
$599,778
3
bds
|
2
ba
|
1,703
sqft
|
built
1957
15 Seneca Rd, Woburn, MA 01801
$-802
Cash flow
-7.0%
Cash-on-Cash Return
4.1%
Cap rate
0.6%
Rent to Value Ratio
Active
$1,195,000
3
bds
|
2
ba
|
2,485
sqft
|
built
1850
92 Arlington Rd, Woburn, MA 01801
$-2,302
Cash flow
-10.1%
Cash-on-Cash Return
3.4%
Cap rate
0.5%
Rent to Value Ratio
Active
$839,000
4
bds
|
2
ba
|
2,198
sqft
|
built
1968
2 Otis St, Woburn, MA 01801
$-1,540
Cash flow
-9.6%
Cash-on-Cash Return
3.5%
Cap rate
0.5%
Rent to Value Ratio
Active
$929,000
5
bds
|
3
ba
|
2,474
sqft
|
built
1981
35 Sylvanus Wood Ln, Woburn, MA 01801
$-1,463
Cash flow
-8.2%
Cash-on-Cash Return
3.8%
Cap rate
0.5%
Rent to Value Ratio
Active
$799,000
3
bds
|
1
ba
|
1,800
sqft
|
built
1964
212 Cambridge Rd, Woburn, MA 01801
$-1,973
Cash flow
-12.9%
Cash-on-Cash Return
2.7%
Cap rate
0.4%
Rent to Value Ratio
Active
$999,000
5
bds
|
3
ba
|
2,732
sqft
|
built
1840
30 Forest Park Rd, Woburn, MA 01801
$-2,216
Cash flow
-11.6%
Cash-on-Cash Return
3.0%
Cap rate
0.4%
Rent to Value Ratio
Active
$295,000
1
bds
|
1
ba
|
410
sqft
|
built
1984
10 Beacon St, Woburn, MA 01801
$-601
Cash flow
-10.6%
Cash-on-Cash Return
3.2%
Cap rate
0.5%
Rent to Value Ratio
Active
$1,499,000
5
bds
|
4
ba
|
3,556
sqft
|
built
2025
7 Locust St, Woburn, MA 01801
$-5,231
Cash flow
-18.2%
Cash-on-Cash Return
1.5%
Cap rate
0.2%
Rent to Value Ratio
Active
$452,000
2
bds
|
1
ba
|
856
sqft
|
built
1965
31 Arlington Rd, Woburn, MA 01801
$-1,112
Cash flow
-12.8%
Cash-on-Cash Return
2.7%
Cap rate
0.6%
Rent to Value Ratio