01801 Investment Properties for Sale
Browse homes for sale and investment properties in 01801. Refine your search by price, property type, or more.
Best cash flowing properties in 01801
Active
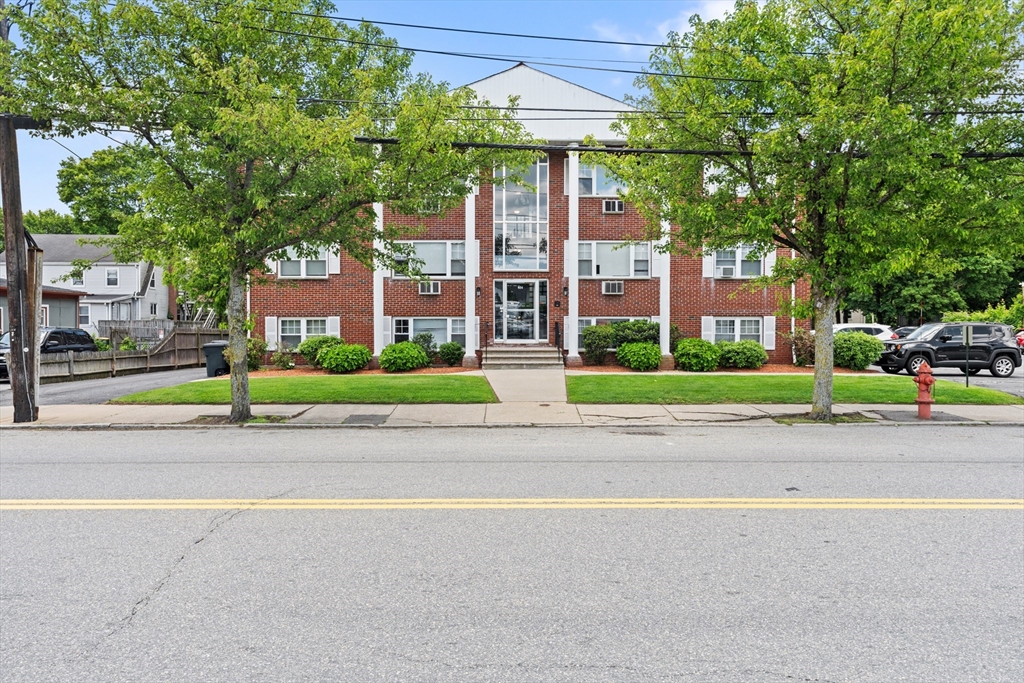
$294,900
1
bds
|
1
ba
|
627
sqft
|
built
1970
924 Main St, Woburn, MA 01801
$-411
Cash flow
-7.3%
Cash-on-Cash Return
4.0%
Cap rate
0.7%
Rent to Value Ratio
Active
$299,900
1
bds
|
1
ba
|
630
sqft
|
built
1987
35 Prospect St, Woburn, MA 01801
$-510
Cash flow
-8.9%
Cash-on-Cash Return
3.6%
Cap rate
0.7%
Rent to Value Ratio
33 out of 47 properties for sale in 01801
Limited Results Shown
Create a free account, or log in to reveal all property listings and enjoy the complete experience.

Active
$1,199,000
4
bds
|
3
ba
|
3,840
sqft
|
built
2012
8 Garden St, Woburn, MA 01801
$-2,520
Cash flow
-11.0%
Cash-on-Cash Return
3.2%
Cap rate
0.5%
Rent to Value Ratio
Active
$1,499,900
5
bds
|
4
ba
|
4,100
sqft
|
built
1955
9 Robert Ave, Woburn, MA 01801
$-4,959
Cash flow
-17.2%
Cash-on-Cash Return
1.7%
Cap rate
0.2%
Rent to Value Ratio

Active
$549,900
3
bds
|
1
ba
|
1,232
sqft
|
built
1850
30 Everett St, Woburn, MA 01801
$-998
Cash flow
-9.5%
Cash-on-Cash Return
3.5%
Cap rate
0.5%
Rent to Value Ratio
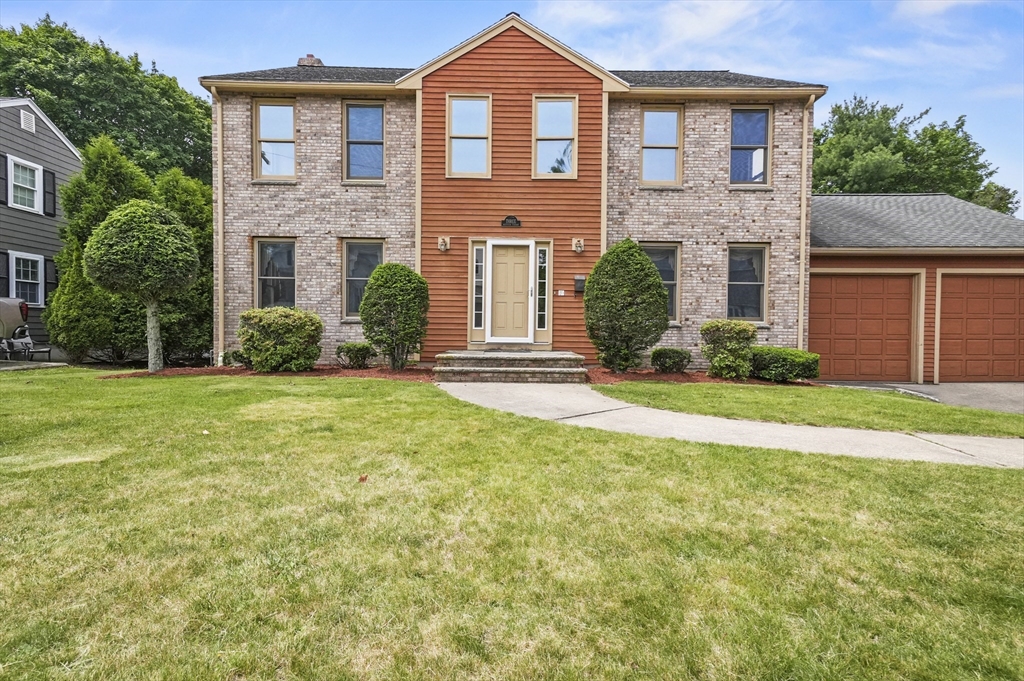
Active
$899,000
4
bds
|
2
ba
|
2,140
sqft
|
built
1962
46 Arlington Rd, Woburn, MA 01801
$-1,907
Cash flow
-11.1%
Cash-on-Cash Return
3.1%
Cap rate
0.5%
Rent to Value Ratio
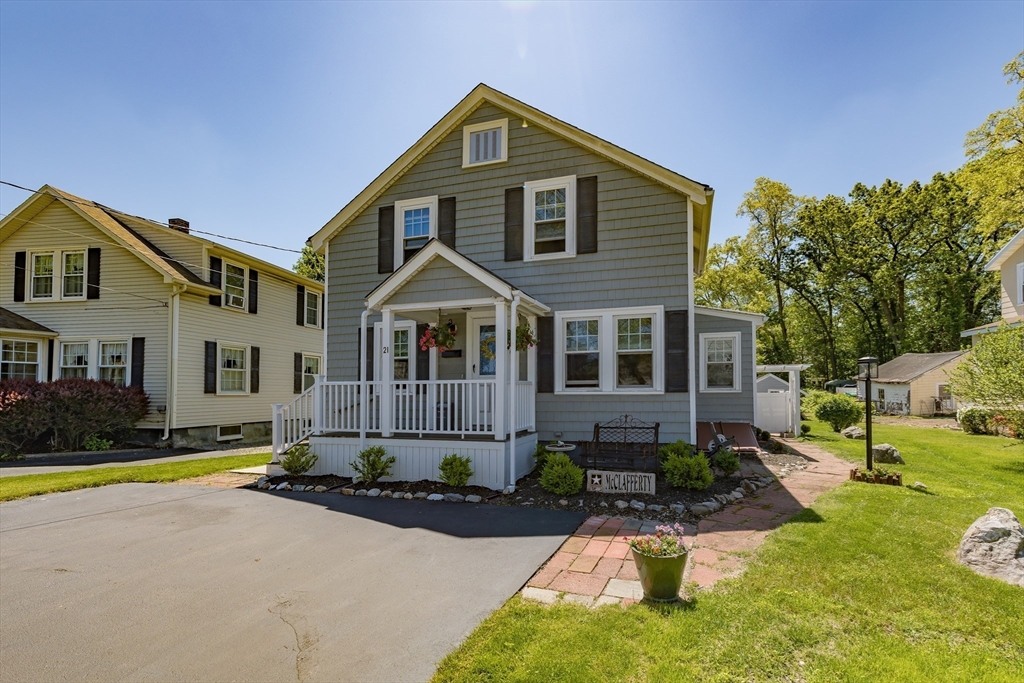
Active
$639,900
3
bds
|
2
ba
|
1,290
sqft
|
built
1920
21 Alfred St, Woburn, MA 01801
$-1,027
Cash flow
-8.4%
Cash-on-Cash Return
3.8%
Cap rate
0.5%
Rent to Value Ratio
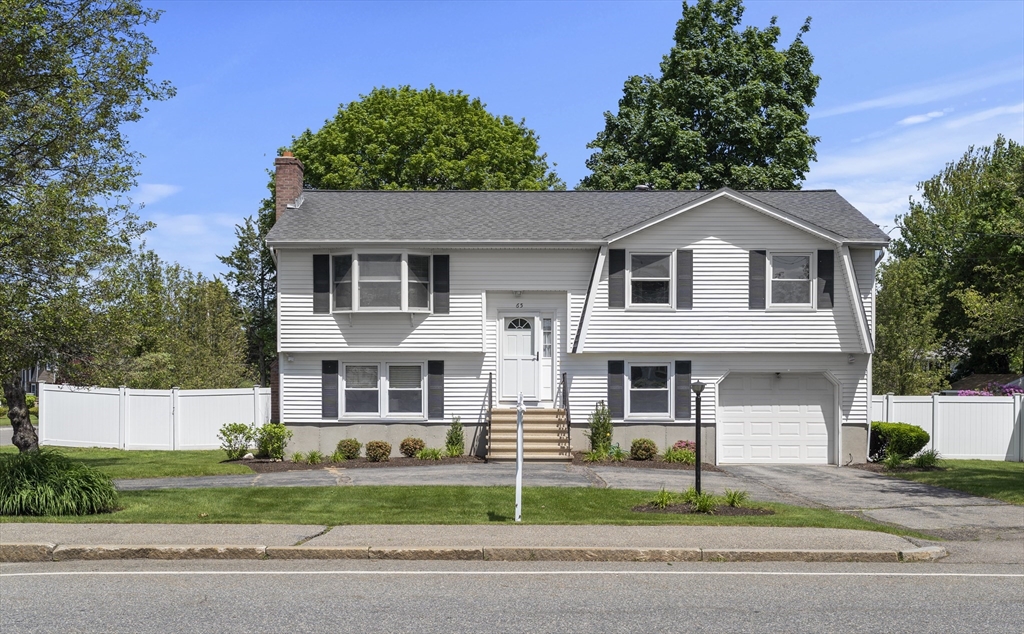
Active
$899,900
4
bds
|
2
ba
|
1,888
sqft
|
built
1976
65 Wyman St, Woburn, MA 01801
$-2,031
Cash flow
-11.8%
Cash-on-Cash Return
3.0%
Cap rate
0.4%
Rent to Value Ratio
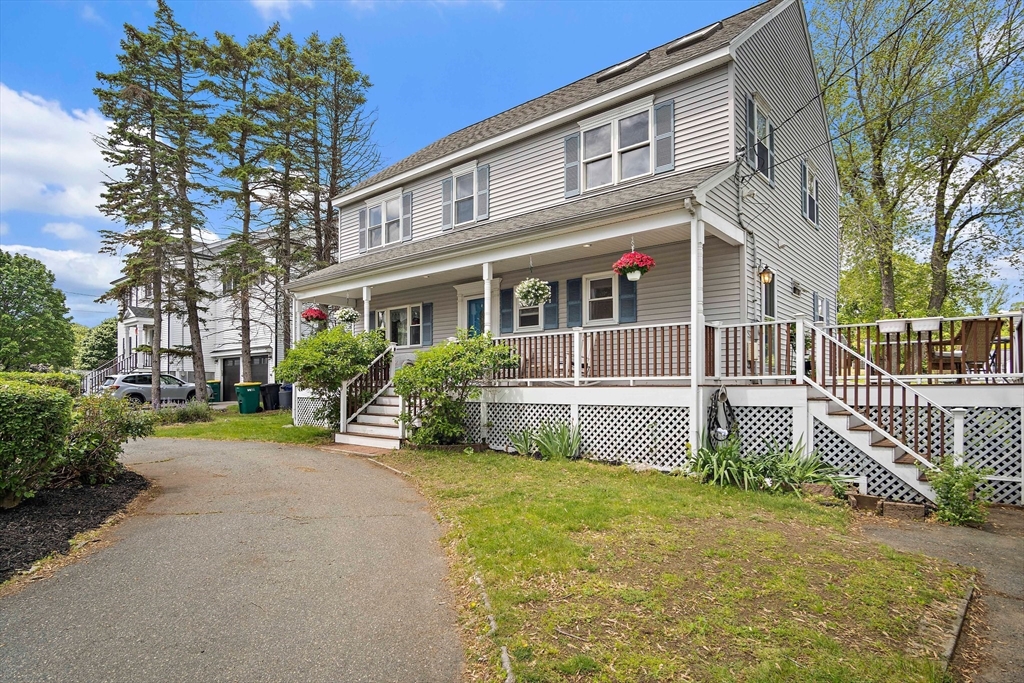
Active
$924,900
5
bds
|
3
ba
|
2,682
sqft
|
built
1955
3 Manomet Rd, Woburn, MA 01801
$-1,751
Cash flow
-9.9%
Cash-on-Cash Return
3.4%
Cap rate
0.5%
Rent to Value Ratio
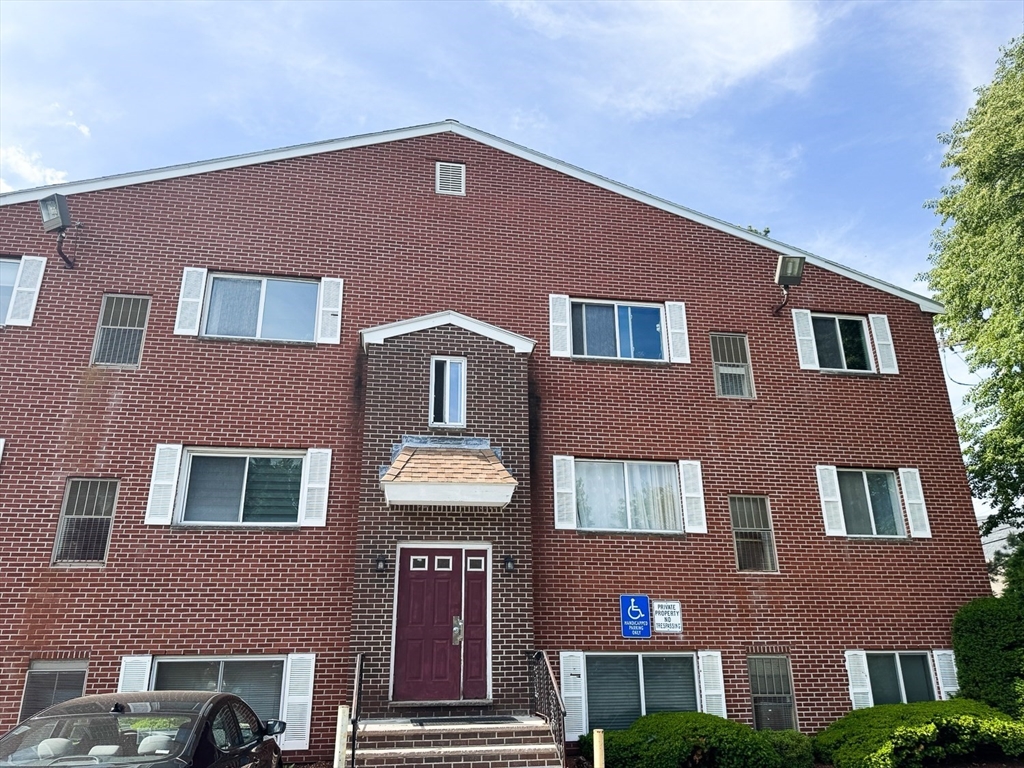
Active
$299,900
1
bds
|
1
ba
|
575
sqft
|
built
1987
35 Prospect St, Woburn, MA 01801
$-657
Cash flow
-11.4%
Cash-on-Cash Return
3.0%
Cap rate
0.6%
Rent to Value Ratio
Active
$919,900
4
bds
|
3
ba
|
2,300
sqft
|
built
1990
3 Westview Ter, Woburn, MA 01801
$-1,888
Cash flow
-10.7%
Cash-on-Cash Return
3.2%
Cap rate
0.5%
Rent to Value Ratio
Active
$499,900
3
bds
|
1
ba
|
1,128
sqft
|
built
1928
64 Garfield Ave, Woburn, MA 01801
$-569
Cash flow
-5.9%
Cash-on-Cash Return
4.3%
Cap rate
0.6%
Rent to Value Ratio
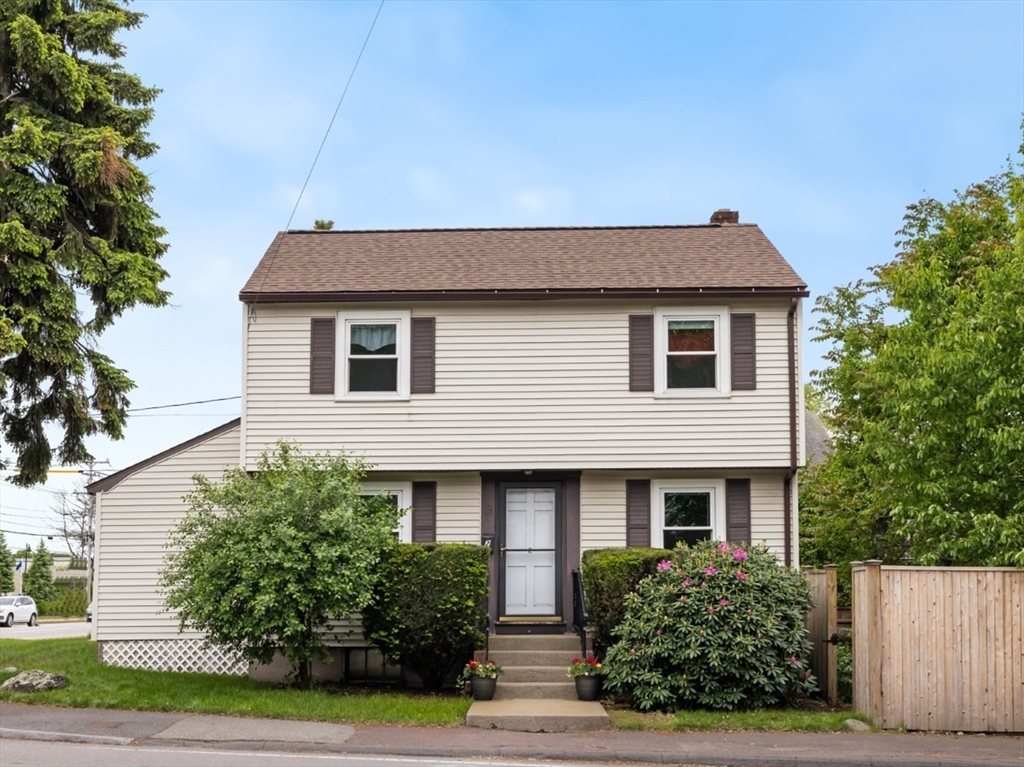
Active
$579,000
3
bds
|
1
ba
|
1,108
sqft
|
built
1950
2 Olympia Ave, Woburn, MA 01801
$-689
Cash flow
-6.2%
Cash-on-Cash Return
4.3%
Cap rate
0.6%
Rent to Value Ratio
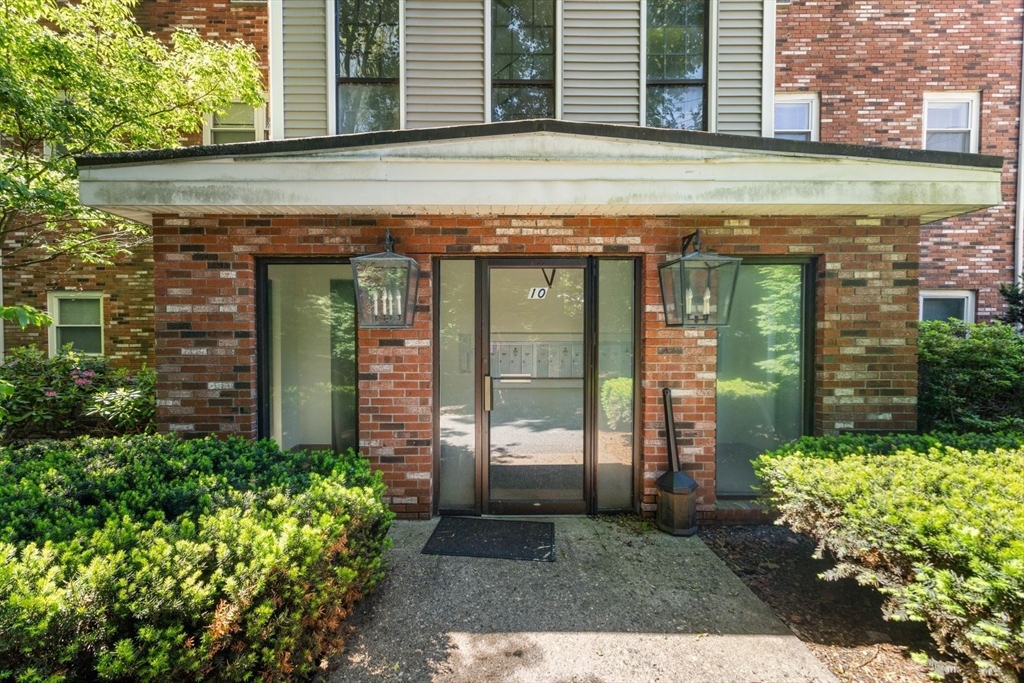
Active
$304,900
1
bds
|
1
ba
|
410
sqft
|
built
1984
10 Beacon St, Woburn, MA 01801
$-648
Cash flow
-11.1%
Cash-on-Cash Return
3.1%
Cap rate
0.5%
Rent to Value Ratio
Active
$685,000
2
bds
|
2
ba
|
1,436
sqft
|
built
2018
2 Inwood Dr, Woburn, MA 01801
$-1,731
Cash flow
-13.2%
Cash-on-Cash Return
2.6%
Cap rate
0.5%
Rent to Value Ratio
Active
$749,000
4
bds
|
2
ba
|
2,592
sqft
|
built
1880
19 Davis St, Woburn, MA 01801
$-1,758
Cash flow
-12.2%
Cash-on-Cash Return
2.9%
Cap rate
0.4%
Rent to Value Ratio
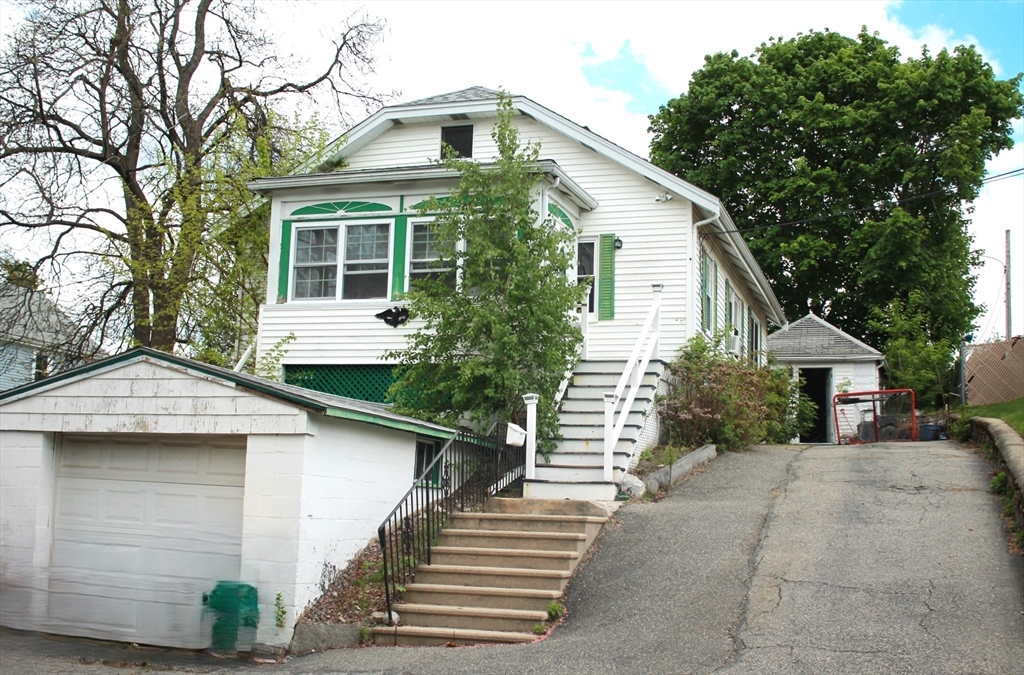
Active
$750,000
4
bds
|
2
ba
|
1,909
sqft
|
built
1900
30 Auburn St, Woburn, MA 01801
$-1,793
Cash flow
-12.5%
Cash-on-Cash Return
2.8%
Cap rate
0.4%
Rent to Value Ratio
Active
$294,900
1
bds
|
1
ba
|
627
sqft
|
built
1970
924 Main St, Woburn, MA 01801
$-411
Cash flow
-7.3%
Cash-on-Cash Return
4.0%
Cap rate
0.7%
Rent to Value Ratio
Active
$299,900
1
bds
|
1
ba
|
630
sqft
|
built
1987
35 Prospect St, Woburn, MA 01801
$-510
Cash flow
-8.9%
Cash-on-Cash Return
3.6%
Cap rate
0.7%
Rent to Value Ratio
Active
$799,900
3
bds
|
2
ba
|
1,973
sqft
|
built
2018
2 Inwood Dr, Woburn, MA 01801
$-1,826
Cash flow
-11.9%
Cash-on-Cash Return
2.9%
Cap rate
0.5%
Rent to Value Ratio
Active
$1,699,999
4
bds
|
4
ba
|
3,800
sqft
|
built
2025
28 Marlboro Rd, Woburn, MA 01801
$-6,238
Cash flow
-19.1%
Cash-on-Cash Return
1.3%
Cap rate
0.2%
Rent to Value Ratio
Active
$899,000
2
bds
|
3
ba
|
1,800
sqft
|
built
2014
960 Main St, Woburn, MA 01801
$-1,908
Cash flow
-11.1%
Cash-on-Cash Return
3.1%
Cap rate
0.5%
Rent to Value Ratio
Active
$670,000
2
bds
|
2
ba
|
1,824
sqft
|
built
1957
347 Lexington St, Woburn, MA 01801
$-1,105
Cash flow
-8.6%
Cash-on-Cash Return
3.7%
Cap rate
0.5%
Rent to Value Ratio
Active
$625,000
2
bds
|
1
ba
|
864
sqft
|
built
1980
10 Briarwood Rd, Woburn, MA 01801
$-1,309
Cash flow
-10.9%
Cash-on-Cash Return
3.2%
Cap rate
0.5%
Rent to Value Ratio
Active
$1,599,000
5
bds
|
4
ba
|
3,556
sqft
|
built
2025
7 Locust St, Woburn, MA 01801
$-5,704
Cash flow
-18.6%
Cash-on-Cash Return
1.4%
Cap rate
0.2%
Rent to Value Ratio
Active
$669,000
2
bds
|
1
ba
|
1,012
sqft
|
built
1959
22 Rumford Park Ave, Woburn, MA 01801
$-1,334
Cash flow
-10.4%
Cash-on-Cash Return
3.3%
Cap rate
0.5%
Rent to Value Ratio
Active
$1,399,900
5
bds
|
4
ba
|
3,000
sqft
|
built
2025
117 Montvale Ave, Woburn, MA 01801
$-4,386
Cash flow
-16.3%
Cash-on-Cash Return
1.9%
Cap rate
0.3%
Rent to Value Ratio
Active
$1,654,988
8
bds
|
6
ba
|
3,700
sqft
|
built
1880
22 James St, Woburn, MA 01801
$-6,642
Cash flow
-20.9%
Cash-on-Cash Return
0.9%
Cap rate
0.1%
Rent to Value Ratio
Active
$1,469,000
4
bds
|
3
ba
|
3,600
sqft
|
built
1963
8 Whispering Hill Rd, Woburn, MA 01801
$-4,114
Cash flow
-14.6%
Cash-on-Cash Return
2.3%
Cap rate
0.3%
Rent to Value Ratio

Active
$739,900
3
bds
|
2
ba
|
1,578
sqft
|
built
1900
61 Mishawum Rd, Woburn, MA 01801
$-1,215
Cash flow
-8.6%
Cash-on-Cash Return
3.7%
Cap rate
0.5%
Rent to Value Ratio
Active
$875,000
4
bds
|
2
ba
|
2,836
sqft
|
built
1900
69 Warren Ave, Woburn, MA 01801
$-2,748
Cash flow
-16.4%
Cash-on-Cash Return
1.9%
Cap rate
0.3%
Rent to Value Ratio
Active
$1,389,900
6
bds
|
4
ba
|
4,620
sqft
|
built
1900
6 Tidd Ave, Woburn, MA 01801
$-3,992
Cash flow
-15.0%
Cash-on-Cash Return
2.2%
Cap rate
0.3%
Rent to Value Ratio

Active
$468,000
2
bds
|
1
ba
|
856
sqft
|
built
1965
31 Arlington Rd, Woburn, MA 01801
$-1,188
Cash flow
-13.2%
Cash-on-Cash Return
2.6%
Cap rate
0.5%
Rent to Value Ratio
Active
$392,000
2
bds
|
1
ba
|
820
sqft
|
built
1965
1 Albert Dr, Woburn, MA 01801
$-706
Cash flow
-9.4%
Cash-on-Cash Return
3.5%
Cap rate
0.7%
Rent to Value Ratio

Active
$1,498,000
5
bds
|
4
ba
|
3,276
sqft
|
built
1900
14 Church Ave, Woburn, MA 01801
$-5,953
Cash flow
-20.7%
Cash-on-Cash Return
0.9%
Cap rate
0.2%
Rent to Value Ratio