01880 Investment Properties for Sale
Browse homes for sale and investment properties in 01880. Refine your search by price, property type, or more.
Best cash flowing properties in 01880
Active
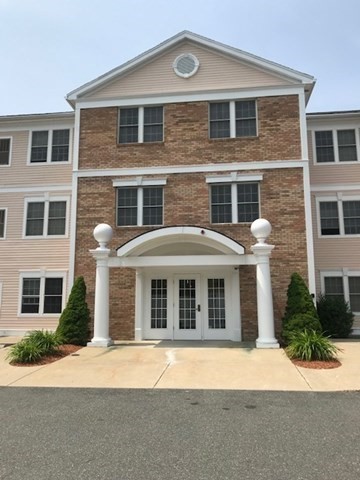
$479,000
2
bds
|
2
ba
|
960
sqft
|
built
2002
1 Millbrook Ln, Wakefield, MA 01880
$-1,626
Cash flow
-17.7%
Cash-on-Cash Return
2.2%
Cap rate
0.5%
Rent to Value Ratio
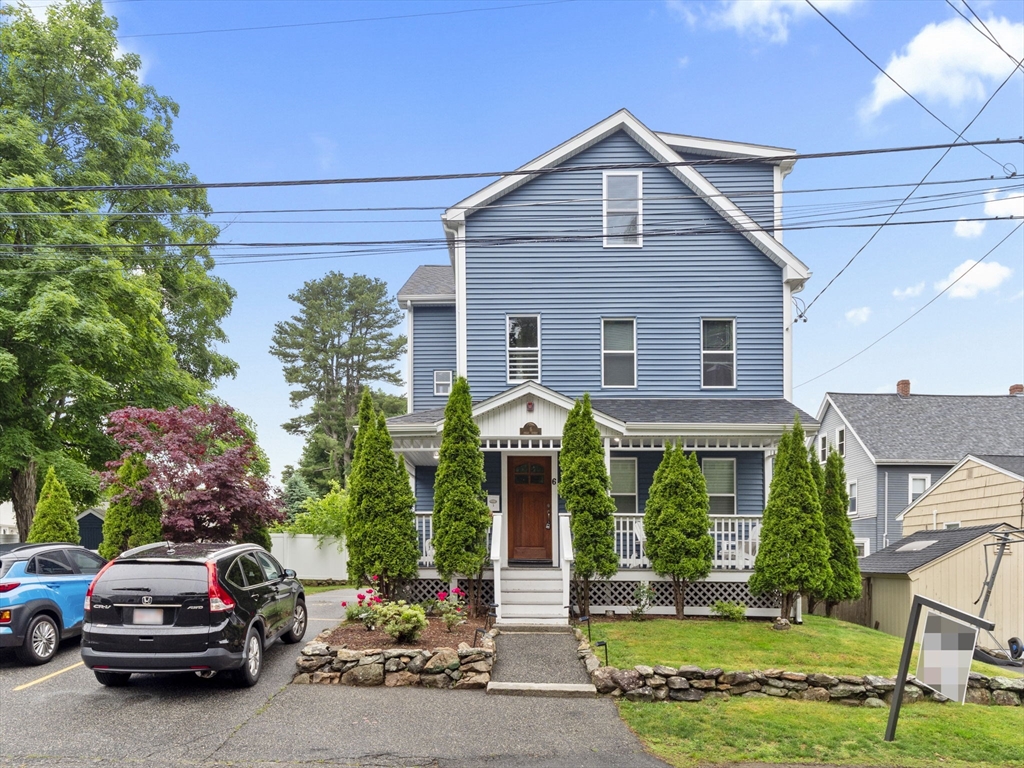
Active
$559,999
2
bds
|
1
ba
|
865
sqft
|
built
1930
6 Nelly St, Wakefield, MA 01880
$-1,690
Cash flow
-15.7%
Cash-on-Cash Return
2.7%
Cap rate
0.5%
Rent to Value Ratio
16 out of 26 properties for sale in 01880
Limited Results Shown
Create a free account, or log in to reveal all property listings and enjoy the complete experience.
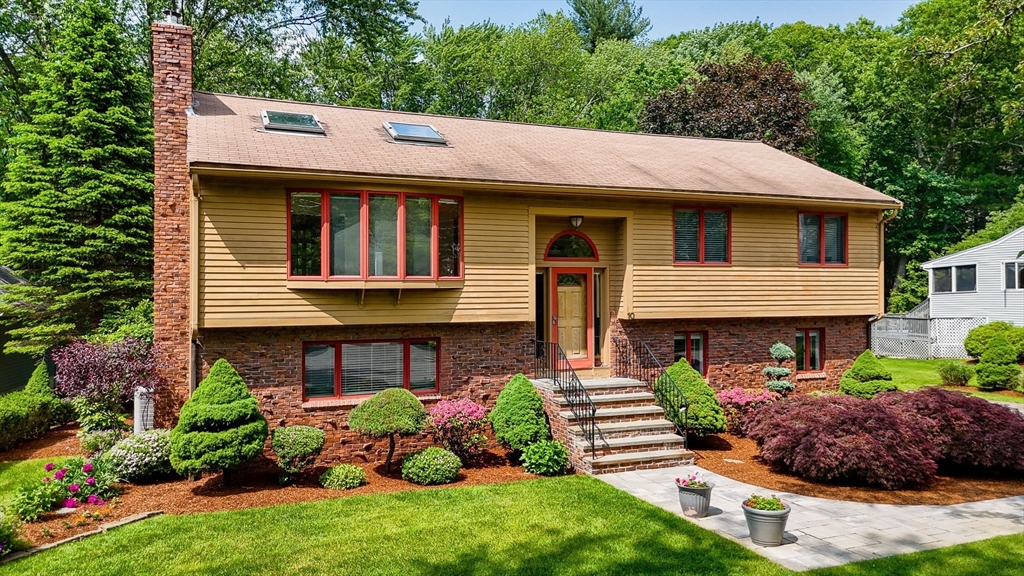
Active under contract
$899,900
3
bds
|
2
ba
|
2,079
sqft
|
built
1985
10 Briarwood Ln, Wakefield, MA 01880
$-2,628
Cash flow
-15.2%
Cash-on-Cash Return
2.8%
Cap rate
0.5%
Rent to Value Ratio
Active
$559,999
2
bds
|
1
ba
|
865
sqft
|
built
1930
6 Nelly St, Wakefield, MA 01880
$-1,690
Cash flow
-15.7%
Cash-on-Cash Return
2.7%
Cap rate
0.5%
Rent to Value Ratio
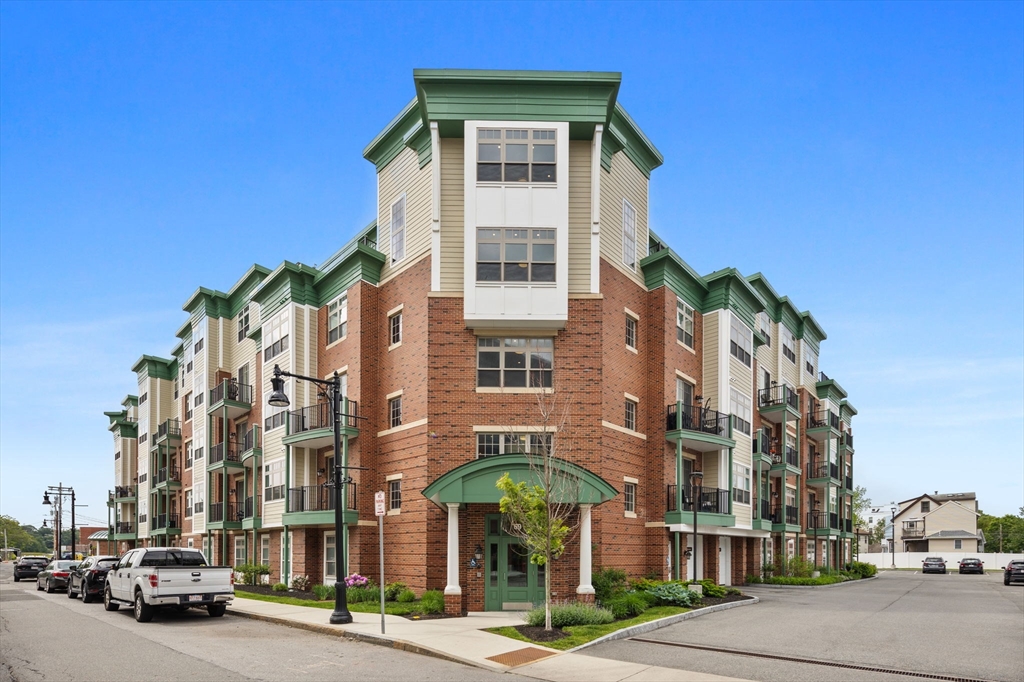
Active
$549,900
1
bds
|
1
ba
|
832
sqft
|
built
2019
69 Foundry St, Wakefield, MA 01880
$-1,864
Cash flow
-17.7%
Cash-on-Cash Return
2.2%
Cap rate
0.5%
Rent to Value Ratio
Active under contract
$929,000
4
bds
|
4
ba
|
2,361
sqft
|
built
1963
60 Morrison Rd W, Wakefield, MA 01880
$-2,543
Cash flow
-14.3%
Cash-on-Cash Return
3.0%
Cap rate
0.5%
Rent to Value Ratio
Active under contract
$719,900
3
bds
|
1
ba
|
1,236
sqft
|
built
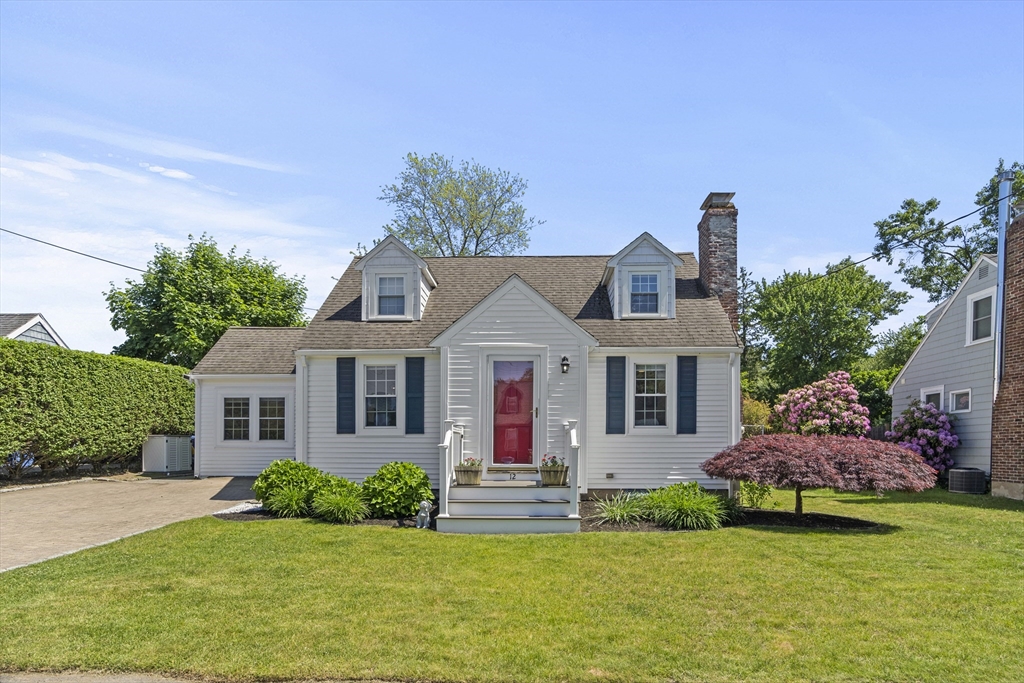
1942
12 Willow St, Wakefield, MA 01880
$-2,003
Cash flow
-14.5%
Cash-on-Cash Return
2.9%
Cap rate
0.5%
Rent to Value Ratio
Pending
$799,900
4
bds
|
2
ba
|
1,813
sqft
|
built
1900
6 Francis Ave, Wakefield, MA 01880
$-2,151
Cash flow
-14.0%
Cash-on-Cash Return
3.1%
Cap rate
0.5%
Rent to Value Ratio
Active
$1,399,900
4
bds
|
5
ba
|
4,758
sqft
|
built
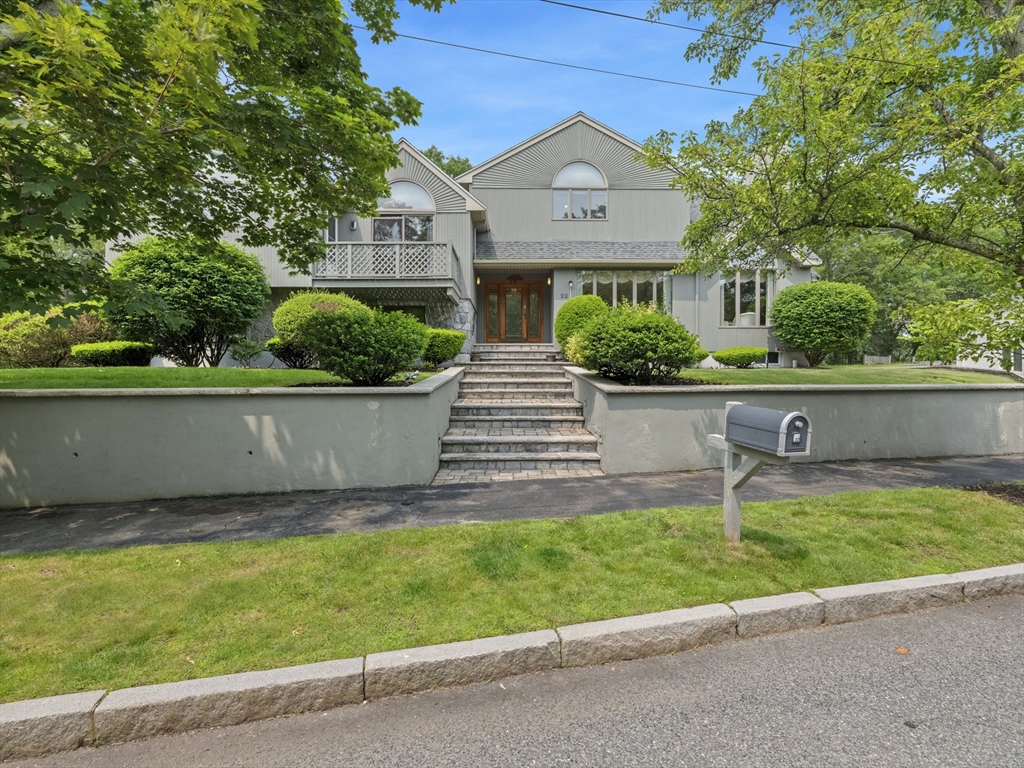
1987
22 Orsini Dr, Wakefield, MA 01880
$-4,628
Cash flow
-17.2%
Cash-on-Cash Return
2.3%
Cap rate
0.4%
Rent to Value Ratio
Active
$479,000
2
bds
|
2
ba
|
960
sqft
|
built
2002
1 Millbrook Ln, Wakefield, MA 01880
$-1,626
Cash flow
-17.7%
Cash-on-Cash Return
2.2%
Cap rate
0.5%
Rent to Value Ratio
Pending
$949,000
1
bds
|
6
ba
|
2,610
sqft
|
built
1900
16 Chestnut St, Wakefield, MA 01880
$-3,687
Cash flow
-20.3%
Cash-on-Cash Return
1.6%
Cap rate
0.3%
Rent to Value Ratio
Active
$1,200,000
8
bds
|
5
ba
|
3,613
sqft
|
built
1885
24 Park St, Wakefield, MA 01880
$-4,892
Cash flow
-21.3%
Cash-on-Cash Return
1.4%
Cap rate
0.3%
Rent to Value Ratio
Active
$975,000
4
bds
|
3
ba
|
2,385
sqft
|
built
2019
10 Wakefield Ave, Wakefield, MA 01880
$-2,763
Cash flow
-14.8%
Cash-on-Cash Return
2.9%
Cap rate
0.5%
Rent to Value Ratio
Active
$1,225,000
4
bds
|
5
ba
|
4,065
sqft
|
built
1987
142 Montrose Ave, Wakefield, MA 01880
$-3,515
Cash flow
-15.0%
Cash-on-Cash Return
2.8%
Cap rate
0.5%
Rent to Value Ratio
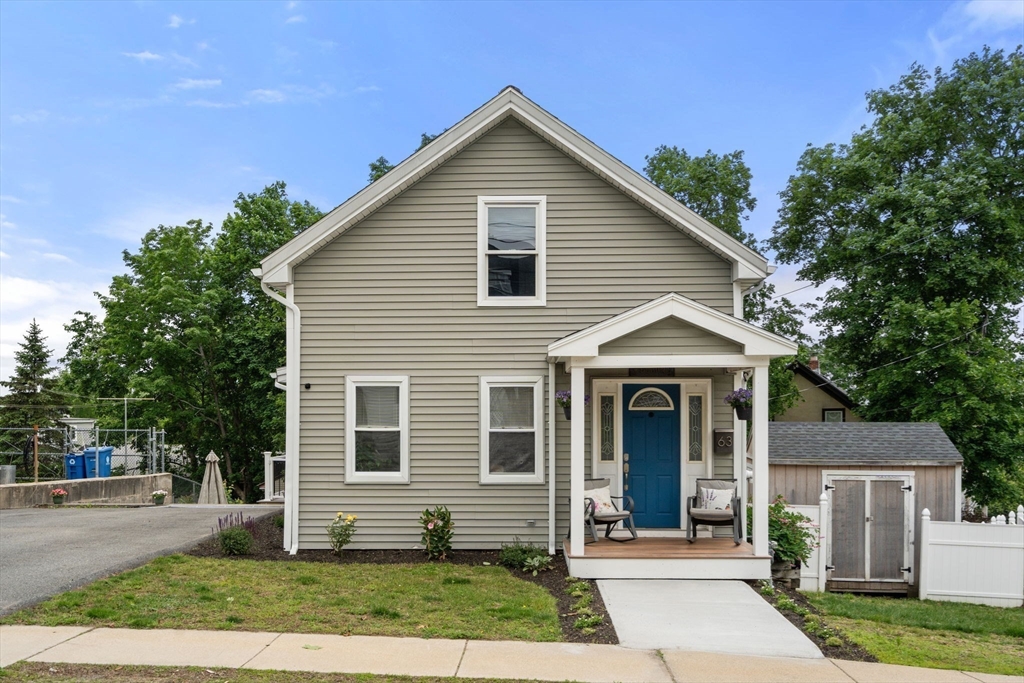
Active
$899,900
5
bds
|
3
ba
|
1,961
sqft
|
built
1900
63 Richardson St, Wakefield, MA 01880
$-2,895
Cash flow
-16.8%
Cash-on-Cash Return
2.4%
Cap rate
0.4%
Rent to Value Ratio
Active
$1,100,000
4
bds
|
4
ba
|
2,917
sqft
|
built
2008
22 Gates Ln, Wakefield, MA 01880
$-3,481
Cash flow
-16.5%
Cash-on-Cash Return
2.5%
Cap rate
0.4%
Rent to Value Ratio
Active
$1,419,000
4
bds
|
3
ba
|
3,200
sqft
|
built
1950
6 Lovis Ave, Wakefield, MA 01880
$-3,798
Cash flow
-14.0%
Cash-on-Cash Return
3.1%
Cap rate
0.4%
Rent to Value Ratio
Active
$1,299,900
4
bds
|
6
ba
|
4,264
sqft
|
built
2002
762 Main St, Wakefield, MA 01880
$-4,627
Cash flow
-18.6%
Cash-on-Cash Return
2.0%
Cap rate
0.3%
Rent to Value Ratio