01923 Investment Properties for Sale
Browse homes for sale and investment properties in 01923. Refine your search by price, property type, or more.
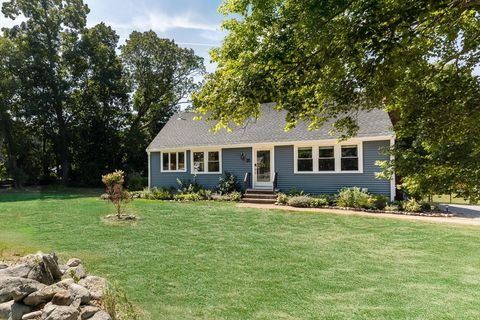
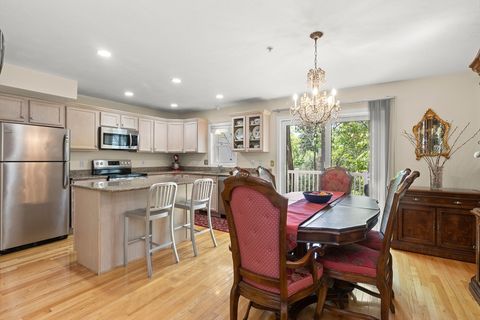
Best cash flowing properties in 01923
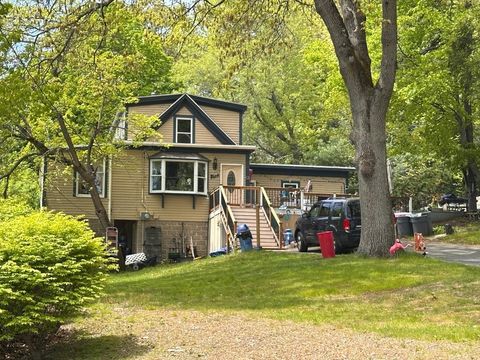
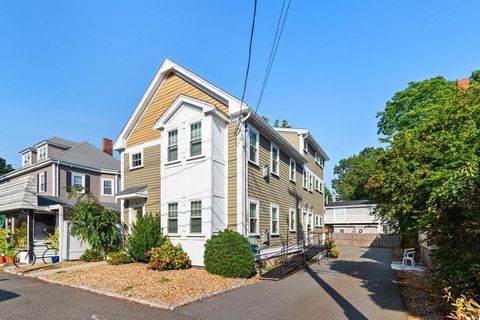
Active
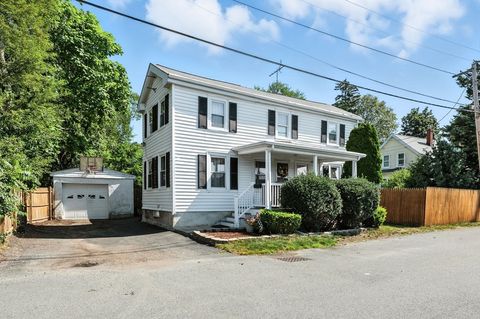
$550,000
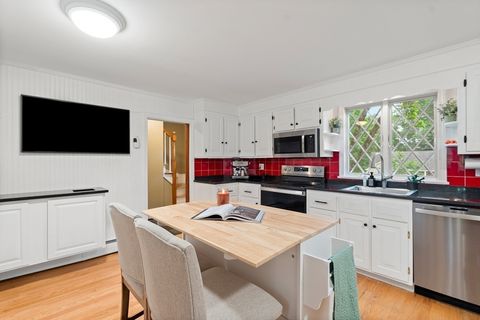
5
bds
|
2
ba
|
1,832
sqft
|
built
1900
12 Whipple St, Danvers, MA 01923
$-389
Cash flow
-3.7%
Cash-on-Cash Return
4.8%
Cap rate
0.7%
Rent to Value Ratio
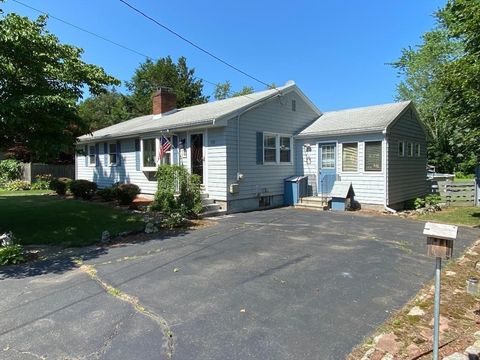
Active
$400,000
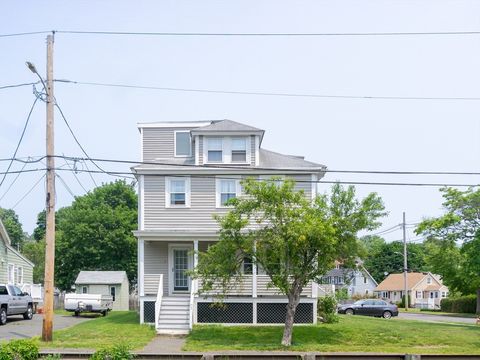
2
bds
|
1
ba
|
1,080
sqft
|
built
1900
8 Putnam St, Danvers, MA 01923
$-583
Cash flow
-7.6%
Cash-on-Cash Return
3.9%
Cap rate
0.6%
Rent to Value Ratio
16 out of 20 properties for sale in 01923
Limited Results Shown
Create a free account, or log in to reveal all property listings and enjoy the complete experience.
Active
$694,500
5
bds
|
3
ba
|
2,304
sqft
|
built
1880
15 Beacon St, Danvers, MA 01923
$-1,040
Cash flow
-7.8%
Cash-on-Cash Return
3.9%
Cap rate
0.6%
Rent to Value Ratio
Active
$350,000
2
bds
|
1
ba
|
855
sqft
|
built
1880
35 Locust St, Danvers, MA 01923
$-704
Cash flow
-10.5%
Cash-on-Cash Return
3.3%
Cap rate
0.7%
Rent to Value Ratio
Active
$674,900
3
bds
|
2
ba
|
1,700
sqft
|
built
1860
10 Mill St, Danvers, MA 01923
$-1,190
Cash flow
-9.2%
Cash-on-Cash Return
3.6%
Cap rate
0.5%
Rent to Value Ratio
Active
$719,900
3
bds
|
2
ba
|
1,700
sqft
|
built
1965
35 Preston St, Danvers, MA 01923
$-1,260
Cash flow
-9.1%
Cash-on-Cash Return
3.6%
Cap rate
0.6%
Rent to Value Ratio
Active
$599,900
2
bds
|
3
ba
|
1,909
sqft
|
built
2002
35 Collins St, Danvers, MA 01923
$-1,386
Cash flow
-12.1%
Cash-on-Cash Return
2.9%
Cap rate
0.6%
Rent to Value Ratio
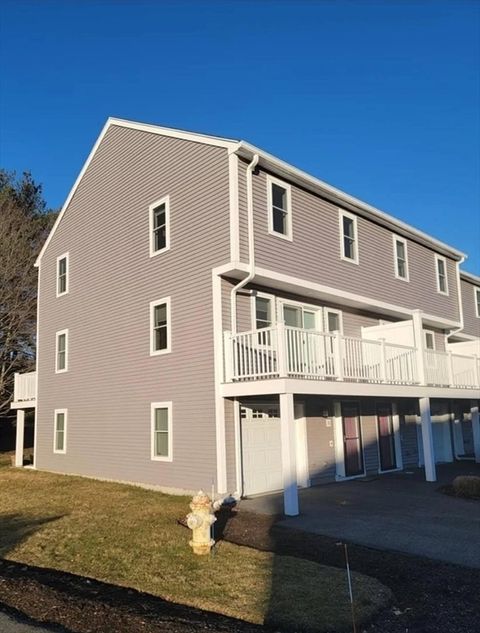
Active
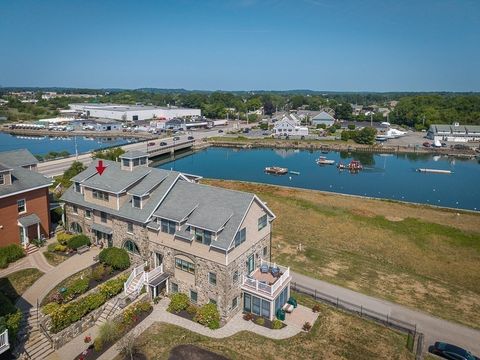
$869,900
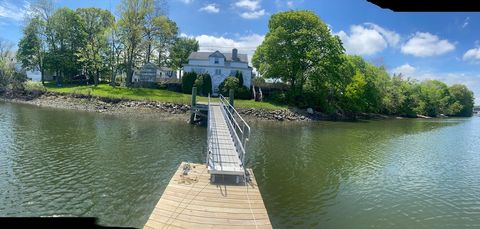
2
bds
|
3
ba
|
2,587
sqft
|
built
1900
152 Water St, Danvers, MA 01923
$-3,089
Cash flow
-18.5%
Cash-on-Cash Return
1.4%
Cap rate
0.5%
Rent to Value Ratio
Active
$589,900
3
bds
|
2
ba
|
1,548
sqft
|
built
1870
23 Locust St, Danvers, MA 01923
$-937
Cash flow
-8.3%
Cash-on-Cash Return
3.8%
Cap rate
0.7%
Rent to Value Ratio
Active
$659,000
3
bds
|
1
ba
|
1,284
sqft
|
built
1958
110 Forest St, Danvers, MA 01923
$-1,262
Cash flow
-10.0%
Cash-on-Cash Return
3.4%
Cap rate
0.5%
Rent to Value Ratio
Active
$545,000
2
bds
|
2
ba
|
1,622
sqft
|
built
1988
22 Collins St, Danvers, MA 01923
$-1,293
Cash flow
-12.4%
Cash-on-Cash Return
2.8%
Cap rate
0.6%
Rent to Value Ratio
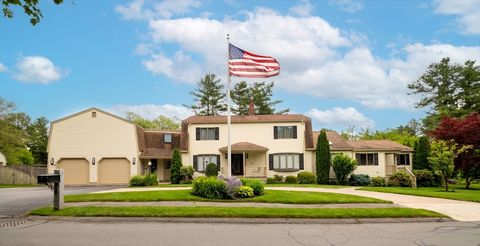
Active
$1,399,999
5
bds
|
4
ba
|
4,348
sqft
|
built
1988
7 Wildwood Rd, Danvers, MA 01923
$-4,300
Cash flow
-16.0%
Cash-on-Cash Return
2.0%
Cap rate
0.4%
Rent to Value Ratio
Active
$1,189,990
5
bds
|
3
ba
|
3,466
sqft
|
built
1965
16 Rockland Rd, Danvers, MA 01923
$-2,569
Cash flow
-11.3%
Cash-on-Cash Return
3.1%
Cap rate
0.5%
Rent to Value Ratio
Active
$429,000
2
bds
|
1
ba
|
1,034
sqft
|
built
1925
21 Brookside Ave, Danvers, MA 01923
$-789
Cash flow
-9.6%
Cash-on-Cash Return
3.5%
Cap rate
0.6%
Rent to Value Ratio
Active
$975,000
3
bds
|
2
ba
|
1,872
sqft
|
built
1930
90 Water St, Danvers, MA 01923
$-2,593
Cash flow
-13.9%
Cash-on-Cash Return
2.5%
Cap rate
0.4%
Rent to Value Ratio
Active
$1,395,000
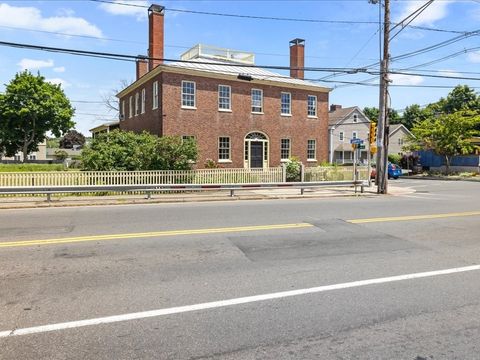
6
bds
|
8
ba
|
5,458
sqft
|
built
1810
166 High St, Danvers, MA 01923
$-4,321
Cash flow
-16.2%
Cash-on-Cash Return
2.0%
Cap rate
0.3%
Rent to Value Ratio