02019 Investment Properties for Sale
Browse homes for sale and investment properties in 02019. Refine your search by price, property type, or more.
Best cash flowing properties in 02019
Active
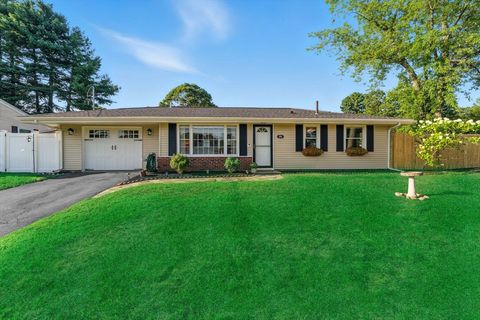
$469,900
3
bds
|
2
ba
|
1,652
sqft
|
built
1974
20 Bertine St, Bellingham, MA 02019
$-200
Cash flow
-2.2%
Cash-on-Cash Return
5.2%
Cap rate
0.8%
Rent to Value Ratio
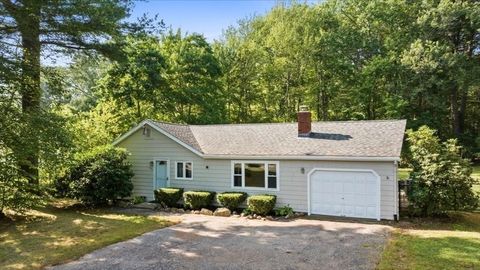
Active
$459,900
3
bds
|
1
ba
|
1,072
sqft
|
built
1965
180 Patricia Dr, Bellingham, MA 02019
$-401
Cash flow
-4.5%
Cash-on-Cash Return
4.6%
Cap rate
0.7%
Rent to Value Ratio
7 out of 13 properties for sale in 02019
Limited Results Shown
Create a free account, or log in to reveal all property listings and enjoy the complete experience.
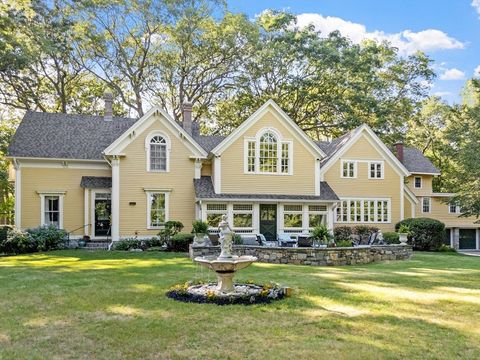
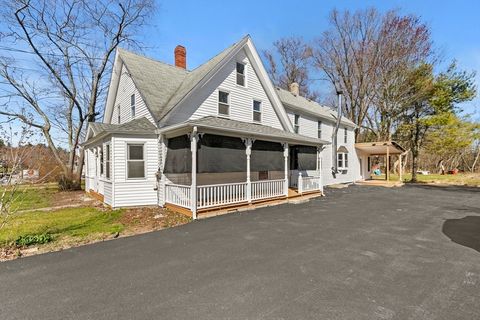
Active
$1,299,000
5
bds
|
5
ba
|
3,937
sqft
|
built
1885
202 Paine St, Bellingham, MA 02019
$-2,728
Cash flow
-11.0%
Cash-on-Cash Return
3.2%
Cap rate
0.5%
Rent to Value Ratio
Active
$459,000
2
bds
|
1
ba
|
816
sqft
|
built
1945
926 S Main St, Bellingham, MA 02019
$-646
Cash flow
-7.3%
Cash-on-Cash Return
4.0%
Cap rate
0.6%
Rent to Value Ratio
Active
$650,000
5
bds
|
3
ba
|
2,503
sqft
|
built
1900
359 Hartford Ave, Bellingham, MA 02019
$-554
Cash flow
-4.4%
Cash-on-Cash Return
4.7%
Cap rate
0.7%
Rent to Value Ratio
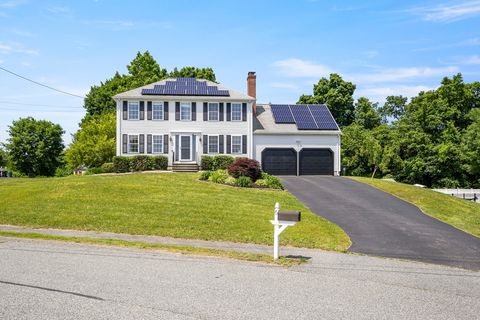
Active
$779,900
3
bds
|
3
ba
|
2,294
sqft
|
built
1997
6 Fleuette Dr, Bellingham, MA 02019
$-1,579
Cash flow
-10.6%
Cash-on-Cash Return
3.2%
Cap rate
0.5%
Rent to Value Ratio

Active
$490,000
3
bds
|
1
ba
|
1,296
sqft
|
built
1992
202 Hartford Ave, Bellingham, MA 02019
$-500
Cash flow
-5.3%
Cash-on-Cash Return
4.5%
Cap rate
0.7%
Rent to Value Ratio