02053 Investment Properties for Sale
Browse homes for sale and investment properties in 02053. Refine your search by price, property type, or more.
Best cash flowing properties in 02053
Active
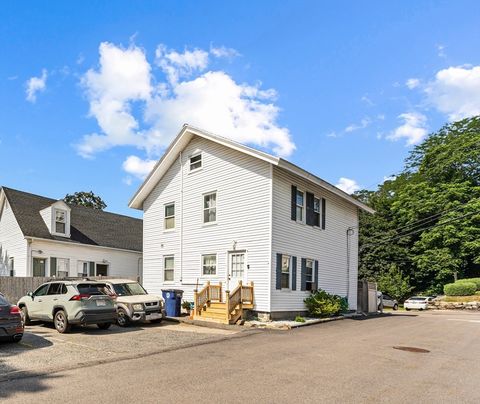
$445,000
3
bds
|
1
ba
|
1,232
sqft
|
built
1800
9 Sanford St, Medway, MA 02053
$-287
Cash flow
-3.4%
Cash-on-Cash Return
4.9%
Cap rate
0.7%
Rent to Value Ratio
Active
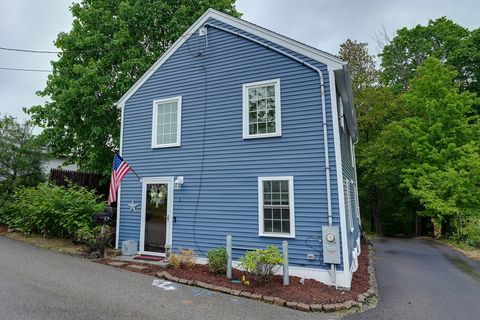
$499,900
3
bds
|
3
ba
|
1,400
sqft
|
built
1880
1 John St, Medway, MA 02053
$-523
Cash flow
-5.5%
Cash-on-Cash Return
4.4%
Cap rate
0.7%
Rent to Value Ratio
9 out of 12 properties for sale in 02053
Limited Results Shown
Create a free account, or log in to reveal all property listings and enjoy the complete experience.
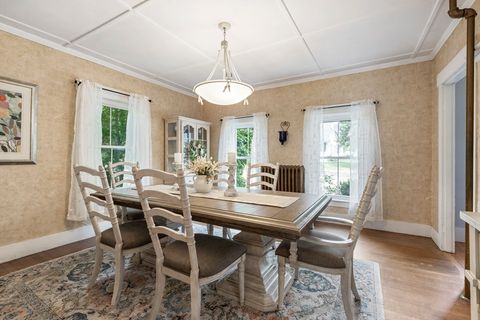
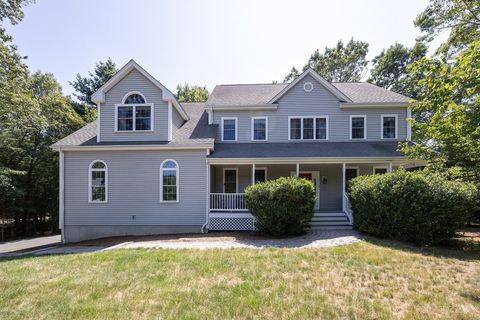
Active
$749,900
4
bds
|
2
ba
|
2,562
sqft
|
built
1870
329 Village St, Medway, MA 02053
$-1,441
Cash flow
-10.0%
Cash-on-Cash Return
3.4%
Cap rate
0.5%
Rent to Value Ratio
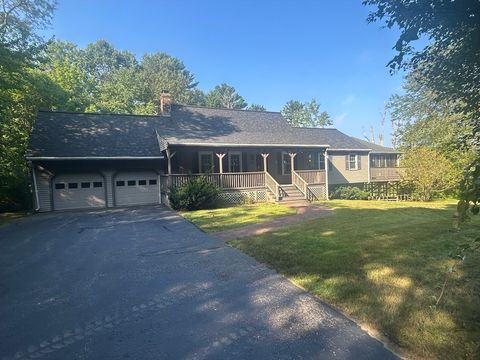
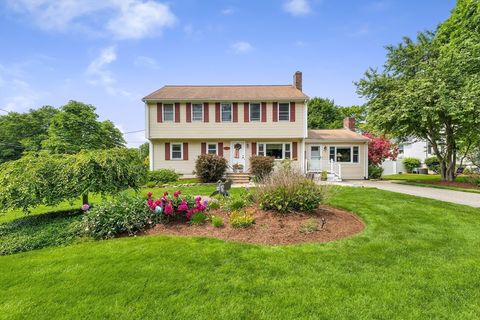
Active
$750,000
3
bds
|
2
ba
|
2,728
sqft
|
built
1966
85 Fisher St, Medway, MA 02053
$-1,499
Cash flow
-10.4%
Cash-on-Cash Return
3.3%
Cap rate
0.5%
Rent to Value Ratio
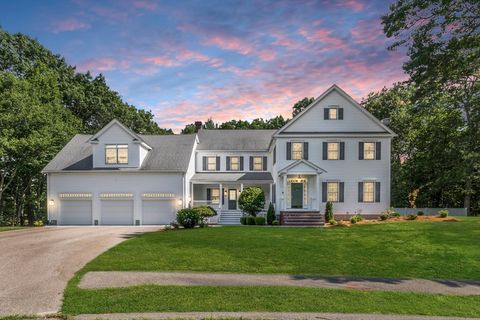
Active
$1,250,000
4
bds
|
4
ba
|
3,629
sqft
|
built
2006
6 Freedom Trl, Medway, MA 02053
$-3,177
Cash flow
-13.3%
Cash-on-Cash Return
2.6%
Cap rate
0.4%
Rent to Value Ratio
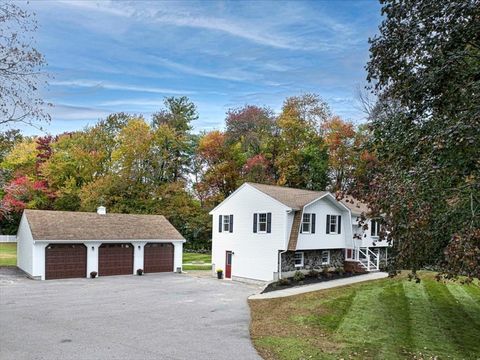
Active
$799,900
5
bds
|
3
ba
|
2,622
sqft
|
built
1957
37 Maple St, Medway, MA 02053
$-1,410
Cash flow
-9.2%
Cash-on-Cash Return
3.6%
Cap rate
0.6%
Rent to Value Ratio
Active
$1,279,900
4
bds
|
4
ba
|
5,600
sqft
|
built
2001
9 Tulip Way, Medway, MA 02053
$-2,867
Cash flow
-11.7%
Cash-on-Cash Return
3.0%
Cap rate
0.5%
Rent to Value Ratio
Active
$819,000
3
bds
|
3
ba
|
2,188
sqft
|
built
1978
4 Bullard Cir, Medway, MA 02053
$-1,705
Cash flow
-10.9%
Cash-on-Cash Return
3.2%
Cap rate
0.5%
Rent to Value Ratio
Active
$839,000
4
bds
|
4
ba
|
2,840
sqft
|
built
1992
123 Summer St, Medway, MA 02053
$-1,574
Cash flow
-9.8%
Cash-on-Cash Return
3.4%
Cap rate
0.5%
Rent to Value Ratio