02130 Investment Properties for Sale
Browse homes for sale and investment properties in 02130. Refine your search by price, property type, or more.
Best cash flowing properties in 02130
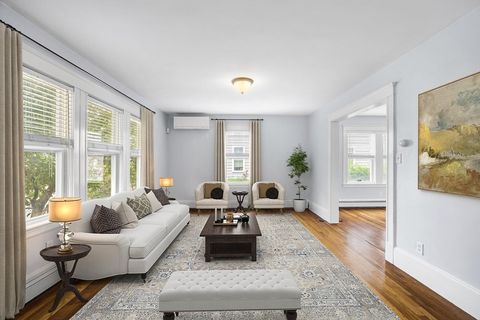
Active
$450,000
1
bds
|
1
ba
|
628
sqft
|
built
1910
55 Mozart St, Boston, MA 02130
$-410
Cash flow
-4.8%
Cash-on-Cash Return
4.6%
Cap rate
0.6%
Rent to Value Ratio
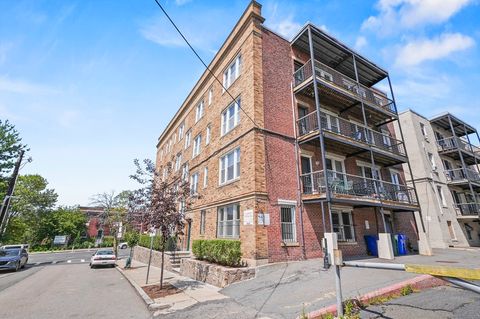
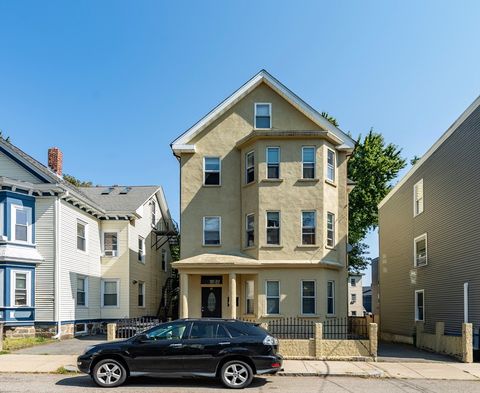
Active
$349,000
1
bds
|
1
ba
|
470
sqft
|
built
1935
246 S Huntington Ave, Boston, MA 02130
$-642
Cash flow
-9.6%
Cash-on-Cash Return
3.5%
Cap rate
0.7%
Rent to Value Ratio
22 out of 45 properties for sale in 02130
Limited Results Shown
Create a free account, or log in to reveal all property listings and enjoy the complete experience.

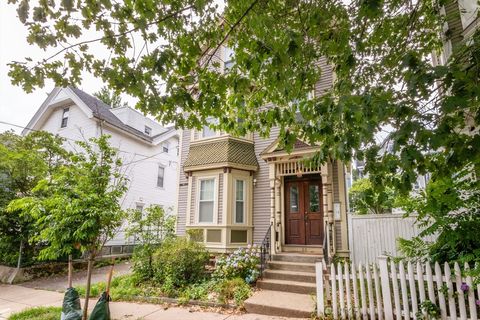
Active
$649,000
2
bds
|
1
ba
|
932
sqft
|
built
1905
81 Child St, Boston, MA 02130
$-1,738
Cash flow
-14.0%
Cash-on-Cash Return
2.5%
Cap rate
0.5%
Rent to Value Ratio
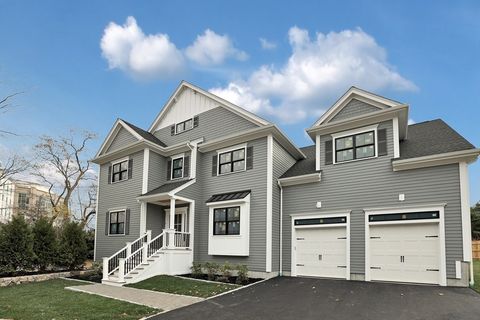
Active
$2,400,000
4
bds
|
4
ba
|
3,200
sqft
|
built
2025
2 Brownson Ter, Boston, MA 02130
$-5,512
Cash flow
-12.0%
Cash-on-Cash Return
2.9%
Cap rate
0.4%
Rent to Value Ratio
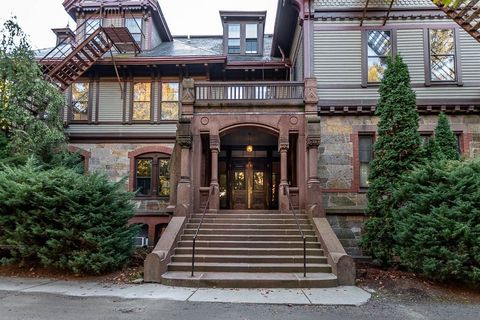
Active
$675,000
2
bds
|
1
ba
|
988
sqft
|
built
1920
76-78 Brookley Rd, Boston, MA 02130
$-1,799
Cash flow
-13.9%
Cash-on-Cash Return
2.5%
Cap rate
0.5%
Rent to Value Ratio
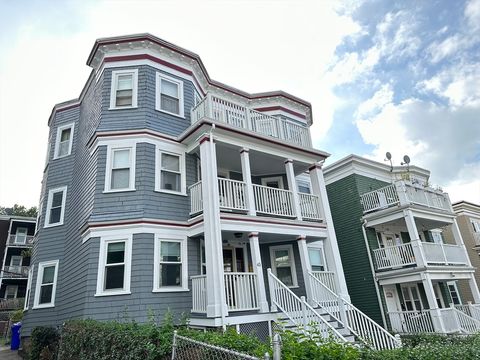
Active
$1,499,900
9
bds
|
3
ba
|
3,663
sqft
|
built
1921
43 Iffley Rd, Boston, MA 02130
$-5,260
Cash flow
-18.3%
Cash-on-Cash Return
1.5%
Cap rate
0.3%
Rent to Value Ratio
Active
$2,150,000
12
bds
|
7
ba
|
4,267
sqft
|
built
1905
66 Mozart St, Boston, MA 02130
$-9,646
Cash flow
-23.4%
Cash-on-Cash Return
0.3%
Cap rate
0.1%
Rent to Value Ratio
Active
$1,795,000
4
bds
|
2
ba
|
3,078
sqft
|
built
1928
6 Aldworth St, Boston, MA 02130
$-6,653
Cash flow
-19.3%
Cash-on-Cash Return
1.2%
Cap rate
0.3%
Rent to Value Ratio
Active
$499,000
1
bds
|
1
ba
|
832
sqft
|
built
1885
1000 Centre St, Boston, MA 02130
$-1,218
Cash flow
-12.7%
Cash-on-Cash Return
2.7%
Cap rate
0.6%
Rent to Value Ratio
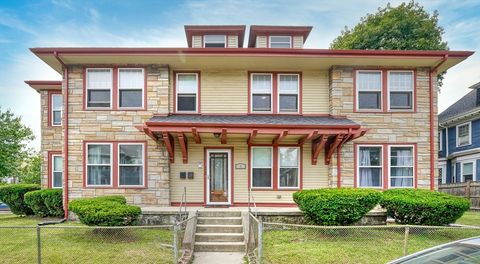
Active
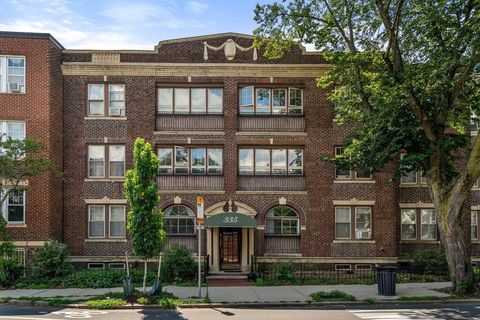
$534,900
2
bds
|
1
ba
|
839
sqft
|
built
1925
335 S Huntington Ave, Boston, MA 02130
$-1,257
Cash flow
-12.3%
Cash-on-Cash Return
2.9%
Cap rate
0.5%
Rent to Value Ratio
Active
$2,499,000
6
bds
|
4
ba
|
4,800
sqft
|
built
1920
12 Zamora St, Boston, MA 02130
$-7,935
Cash flow
-16.6%
Cash-on-Cash Return
1.9%
Cap rate
0.3%
Rent to Value Ratio
Active
$999,000
3
bds
|
2
ba
|
1,341
sqft
|
built
2019
3531 Washington St, Boston, MA 02130
$-2,177
Cash flow
-11.4%
Cash-on-Cash Return
3.1%
Cap rate
0.6%
Rent to Value Ratio
Active
$925,000
4
bds
|
3
ba
|
2,623
sqft
|
built
1982
241 Perkins St, Boston, MA 02130
$-5,535
Cash flow
-31.2%
Cash-on-Cash Return
-1.5%
Cap rate
0.5%
Rent to Value Ratio
Active
$549,000
2
bds
|
1
ba
|
970
sqft
|
built
1925
11 Goodway Rd, Boston, MA 02130
$-905
Cash flow
-8.6%
Cash-on-Cash Return
3.7%
Cap rate
0.6%
Rent to Value Ratio
Active
$1,150,000
4
bds
|
2
ba
|
1,953
sqft
|
built
1926
51 Southbourne Rd, Boston, MA 02130
$-2,871
Cash flow
-13.0%
Cash-on-Cash Return
2.7%
Cap rate
0.4%
Rent to Value Ratio

Active
$599,000
2
bds
|
1
ba
|
1,166
sqft
|
built
1925
11 Goodway Rd, Boston, MA 02130
$-1,217
Cash flow
-10.6%
Cash-on-Cash Return
3.2%
Cap rate
0.5%
Rent to Value Ratio

Active
$749,000
2
bds
|
3
ba
|
1,839
sqft
|
built
1976
241 Perkins St, Boston, MA 02130
$-2,579
Cash flow
-18.0%
Cash-on-Cash Return
1.5%
Cap rate
0.6%
Rent to Value Ratio

Active
$849,900
2
bds
|
2
ba
|
952
sqft
|
built
2019
3531 Washington St, Boston, MA 02130
$-2,384
Cash flow
-14.6%
Cash-on-Cash Return
2.3%
Cap rate
0.5%
Rent to Value Ratio
Active
$415,000
2
bds
|
1
ba
|
787
sqft
|
built
1971
18 Pond St, Boston, MA 02130
$-967
Cash flow
-12.2%
Cash-on-Cash Return
2.9%
Cap rate
0.6%
Rent to Value Ratio
Active
$799,000
3
bds
|
2
ba
|
1,493
sqft
|
built
1988
196 Chestnut Ave, Boston, MA 02130
$-2,522
Cash flow
-16.5%
Cash-on-Cash Return
1.9%
Cap rate
0.5%
Rent to Value Ratio
Active
$685,000
1
bds
|
1
ba
|
848
sqft
|
built
2019
3531 Washington St, Boston, MA 02130
$-1,890
Cash flow
-14.4%
Cash-on-Cash Return
2.4%
Cap rate
0.5%
Rent to Value Ratio
Active
$1,375,000
3
bds
|
3
ba
|
3,017
sqft
|
built
1982
241 Perkins St, Boston, MA 02130
$-8,496
Cash flow
-32.2%
Cash-on-Cash Return
-1.7%
Cap rate
0.4%
Rent to Value Ratio