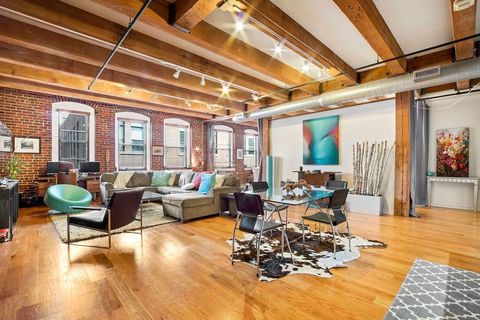
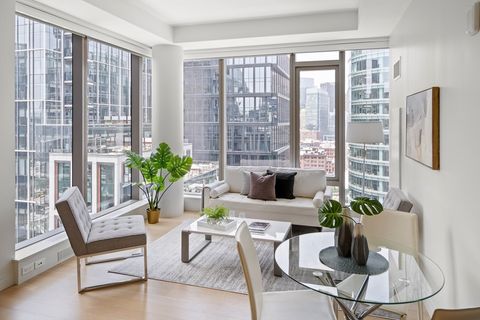
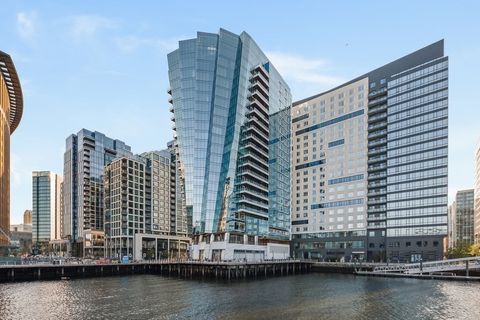
02210 Investment Properties for Sale
Browse homes for sale and investment properties in 02210. Refine your search by price, property type, or more.
Best cash flowing properties in 02210
Active
$750,000
1
bds
|
1
ba
|
783
sqft
|
built
1900
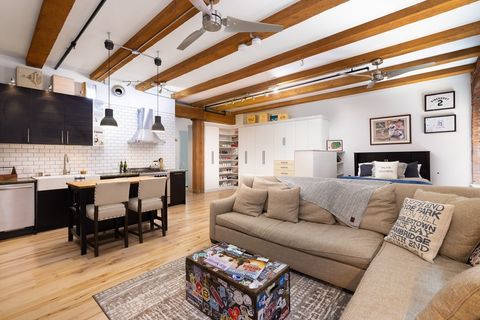
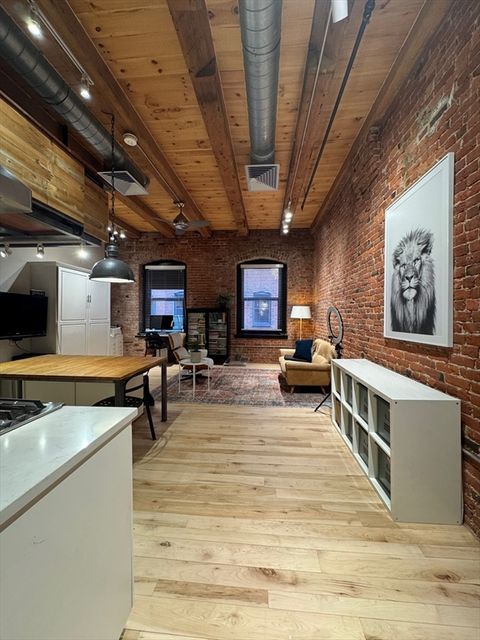
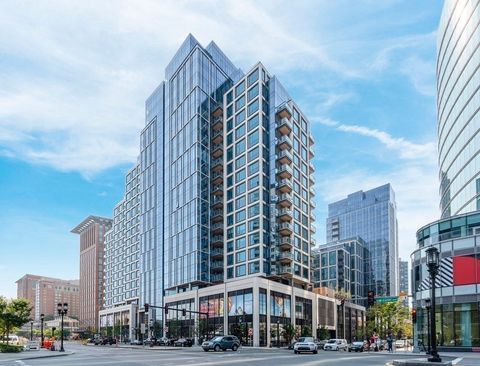
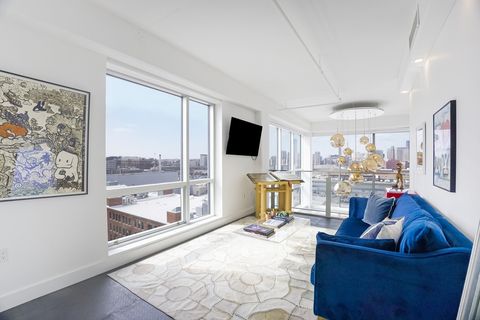
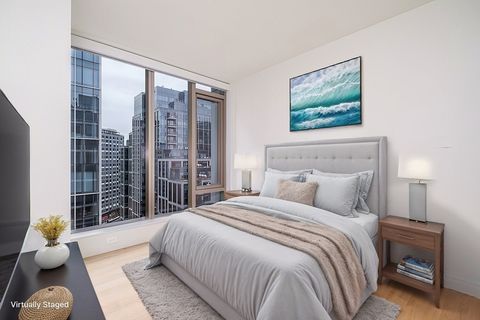
21 Wormwood St, Boston, MA 02210
$-1,801
Cash flow
-12.5%
Cash-on-Cash Return
2.8%
Cap rate
0.5%
Rent to Value Ratio
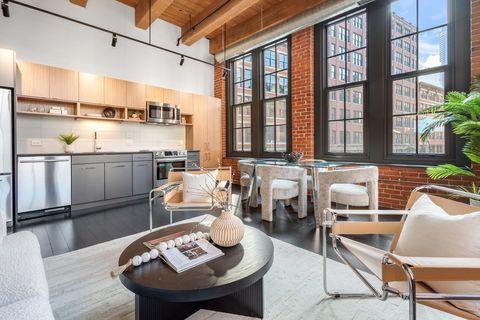
Active
$720,000
1
bds
|
1
ba
|
608
sqft
|
built
1900
21 Wormwood St, Boston, MA 02210
$-2,124
Cash flow
-15.4%
Cash-on-Cash Return
2.1%
Cap rate
0.4%
Rent to Value Ratio
35 out of 45 properties for sale in 02210
Limited Results Shown
Create a free account, or log in to reveal all property listings and enjoy the complete experience.

Active
$3,195,000
2
bds
|
3
ba
|
2,113
sqft
|
built
2018
10 Farnsworth St, Boston, MA 02210
$-11,690
Cash flow
-19.1%
Cash-on-Cash Return
1.3%
Cap rate
0.3%
Rent to Value Ratio
Active
$1,250,000
2
bds
|
2
ba
|
1,043
sqft
|
built
1913
319 A St, Boston, MA 02210
$-3,138
Cash flow
-13.1%
Cash-on-Cash Return
2.7%
Cap rate
0.6%
Rent to Value Ratio
Active
$1,749,000
2
bds
|
2
ba
|
1,024
sqft
|
built
2018
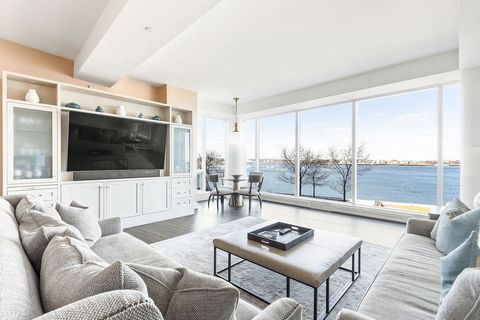
135 Seaport Blvd, Boston, MA 02210
$-6,057
Cash flow
-18.1%
Cash-on-Cash Return
1.5%
Cap rate
0.5%
Rent to Value Ratio
Active
$3,150,000
2
bds
|
2
ba
|
1,569
sqft
|
built
2019
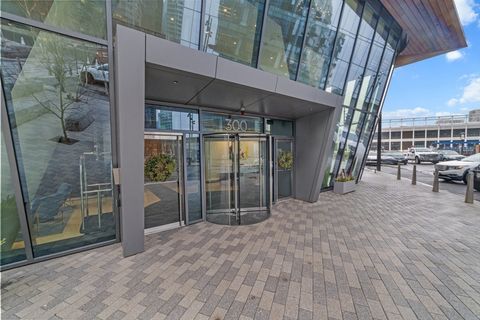
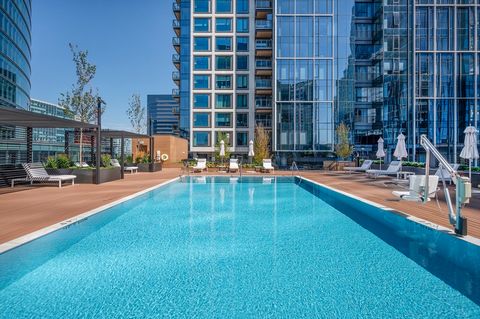
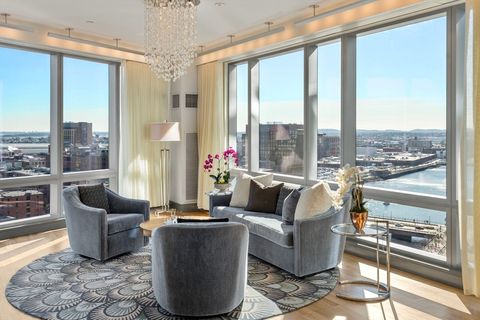
300 Pier 4 Blvd, Boston, MA 02210
$-13,264
Cash flow
-22.0%
Cash-on-Cash Return
0.6%
Cap rate
0.3%
Rent to Value Ratio
Active
$999,000
1
bds
|
1
ba
|
590
sqft
|
built
2019
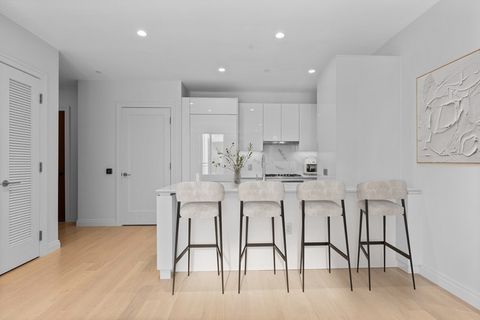
133 Seaport Blvd, Boston, MA 02210
$-4,404
Cash flow
-23.0%
Cash-on-Cash Return
0.4%
Cap rate
0.4%
Rent to Value Ratio
Active
$1,600,000
2
bds
|
2
ba
|
1,260
sqft
|
built
1911
33 Sleeper St, Boston, MA 02210
$-4,861
Cash flow
-15.9%
Cash-on-Cash Return
2.0%
Cap rate
0.4%
Rent to Value Ratio
Active
$6,995,000
3
bds
|
3
ba
|
2,020
sqft
|
built
2019
300 Pier 4 Blvd, Boston, MA 02210
$-36,114
Cash flow
-26.9%
Cash-on-Cash Return
-0.5%
Cap rate
0.1%
Rent to Value Ratio
Active
$1,100,000
1
bds
|
1
ba
|
686
sqft
|
built
2018
133 Seaport Blvd, Boston, MA 02210
$-3,803
Cash flow
-18.0%
Cash-on-Cash Return
1.5%
Cap rate
0.5%
Rent to Value Ratio
Active
$1,375,000
1
bds
|
1
ba
|
1,320
sqft
|
built
1911
33 Sleeper St, Boston, MA 02210
$-5,186
Cash flow
-19.7%
Cash-on-Cash Return
1.2%
Cap rate
0.3%
Rent to Value Ratio
Active
$1,876,250
2
bds
|
2
ba
|
1,044
sqft
|
built
2018
135 Seaport Blvd, Boston, MA 02210
$-7,152
Cash flow
-19.9%
Cash-on-Cash Return
1.1%
Cap rate
0.4%
Rent to Value Ratio
Active
$1,850,000
1
bds
|
1
ba
|
895
sqft
|
built
2022
150 Seaport Blvd, Boston, MA 02210
$-6,953
Cash flow
-19.6%
Cash-on-Cash Return
1.2%
Cap rate
0.4%
Rent to Value Ratio
Active
$1,200,000
1
bds
|
1
ba
|
700
sqft
|
built
2018
133 Seaport Blvd, Boston, MA 02210
$-4,590
Cash flow
-20.0%
Cash-on-Cash Return
1.1%
Cap rate
0.4%
Rent to Value Ratio

Active
$2,299,000
2
bds
|
3
ba
|
1,256
sqft
|
built
2018
133 Seaport Blvd, Boston, MA 02210
$-7,949
Cash flow
-18.0%
Cash-on-Cash Return
1.5%
Cap rate
0.4%
Rent to Value Ratio

Active
$2,700,000
2
bds
|
3
ba
|
1,338
sqft
|
built
2022
150 Seaport Blvd, Boston, MA 02210
$-12,948
Cash flow
-25.0%
Cash-on-Cash Return
-0.1%
Cap rate
0.3%
Rent to Value Ratio
Active
$1,999,000
1
bds
|
2
ba
|
1,046
sqft
|
built
2019
300 Pier 4 Blvd, Boston, MA 02210
$-6,627
Cash flow
-17.3%
Cash-on-Cash Return
1.7%
Cap rate
0.4%
Rent to Value Ratio

Active
$999,000
1
bds
|
1
ba
|
1,080
sqft
|
built
1911
33 Sleeper St, Boston, MA 02210
$-3,529
Cash flow
-18.4%
Cash-on-Cash Return
1.4%
Cap rate
0.4%
Rent to Value Ratio

Active
$5,990,000
3
bds
|
4
ba
|
4,002
sqft
|
built
2006
500 Atlantic Ave, Boston, MA 02210
$-34,055
Cash flow
-29.7%
Cash-on-Cash Return
-1.1%
Cap rate
0.2%
Rent to Value Ratio

Active
$1,795,000
2
bds
|
2
ba
|
1,719
sqft
|
built
1920
437 D St, Boston, MA 02210
$-6,290
Cash flow
-18.3%
Cash-on-Cash Return
1.5%
Cap rate
0.4%
Rent to Value Ratio
Active
$1,795,000
2
bds
|
3
ba
|
1,557
sqft
|
built
2006
500 Atlantic Ave, Boston, MA 02210
$-6,913
Cash flow
-20.1%
Cash-on-Cash Return
1.1%
Cap rate
0.5%
Rent to Value Ratio
Active
$1,100,000
1
bds
|
1
ba
|
670
sqft
|
built
2019
135 Seaport Blvd, Boston, MA 02210
$-4,313
Cash flow
-20.5%
Cash-on-Cash Return
1.0%
Cap rate
0.4%
Rent to Value Ratio
Active
$3,299,000
3
bds
|
3
ba
|
2,131
sqft
|
built
2004
25 Channel Ctr St, Boston, MA 02210
$-12,859
Cash flow
-20.3%
Cash-on-Cash Return
1.0%
Cap rate
0.3%
Rent to Value Ratio

Active
$2,210,000
2
bds
|
2
ba
|
1,249
sqft
|
built
2020
133 Seaport Blvd, Boston, MA 02210
$-7,074
Cash flow
-16.7%
Cash-on-Cash Return
1.8%
Cap rate
0.5%
Rent to Value Ratio
Active
$3,599,000
2
bds
|
3
ba
|
1,942
sqft
|
built
2022
150 Seaport Blvd, Boston, MA 02210
$-19,252
Cash flow
-27.9%
Cash-on-Cash Return
-0.7%
Cap rate
0.2%
Rent to Value Ratio
Active
$7,399,000
3
bds
|
4
ba
|
2,336
sqft
|
built
2022
150 Seaport Blvd, Boston, MA 02210
$-39,835
Cash flow
-28.1%
Cash-on-Cash Return
-0.8%
Cap rate
0.1%
Rent to Value Ratio
Active
$849,900
1
bds
|
1
ba
|
531
sqft
|
built
2020
135 Seaport Blvd, Boston, MA 02210
$-2,720
Cash flow
-16.7%
Cash-on-Cash Return
1.8%
Cap rate
0.5%
Rent to Value Ratio

Active
$2,895,000
2
bds
|
3
ba
|
1,374
sqft
|
built
2019
300 Pier 4 Blvd, Boston, MA 02210
$-11,354
Cash flow
-20.5%
Cash-on-Cash Return
1.0%
Cap rate
0.3%
Rent to Value Ratio
Active
$1,249,990
1
bds
|
1
ba
|
646
sqft
|
built
2018
133 Seaport Blvd, Boston, MA 02210
$-4,314
Cash flow
-18.0%
Cash-on-Cash Return
1.5%
Cap rate
0.4%
Rent to Value Ratio
Active
$4,595,000
2
bds
|
3
ba
|
1,859
sqft
|
built
2015
22 Liberty Dr, Boston, MA 02210
$-23,187
Cash flow
-26.3%
Cash-on-Cash Return
-0.4%
Cap rate
0.2%
Rent to Value Ratio

Active
$3,450,000
3
bds
|
3
ba
|
2,653
sqft
|
built
2006
500 Atlantic Ave, Boston, MA 02210
$-17,647
Cash flow
-26.7%
Cash-on-Cash Return
-0.5%
Cap rate
0.3%
Rent to Value Ratio

Active
$2,449,000
2
bds
|
3
ba
|
1,384
sqft
|
built
2018
135 Seaport Blvd, Boston, MA 02210
$-9,381
Cash flow
-20.0%
Cash-on-Cash Return
1.1%
Cap rate
0.4%
Rent to Value Ratio
Active
$3,650,000
3
bds
|
5
ba
|
3,385
sqft
|
built
2006
500 Atlantic Ave, Boston, MA 02210
$-18,818
Cash flow
-26.9%
Cash-on-Cash Return
-0.5%
Cap rate
0.3%
Rent to Value Ratio

Active
$1,795,000
2
bds
|
2
ba
|
1,068
sqft
|
built
2019
133 Seaport Blvd, Boston, MA 02210
$-7,067
Cash flow
-20.5%
Cash-on-Cash Return
1.0%
Cap rate
0.4%
Rent to Value Ratio
Active
$2,149,000
2
bds
|
2
ba
|
1,164
sqft
|
built
2020
135 Seaport Blvd, Boston, MA 02210
$-7,378
Cash flow
-17.9%
Cash-on-Cash Return
1.6%
Cap rate
0.5%
Rent to Value Ratio