02421 Investment Properties for Sale
Browse homes for sale and investment properties in 02421. Refine your search by price, property type, or more.
Best cash flowing properties in 02421
Active
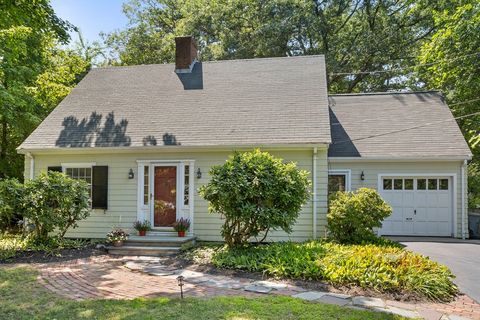
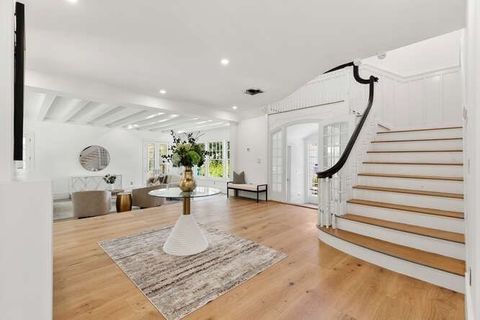
$1,265,000
3
bds
|
2
ba
|
2,467
sqft
|
built
1941
38 Wachusett Dr, Lexington, MA 02421
$-3,804
Cash flow
-15.7%
Cash-on-Cash Return
2.1%
Cap rate
0.4%
Rent to Value Ratio
Active
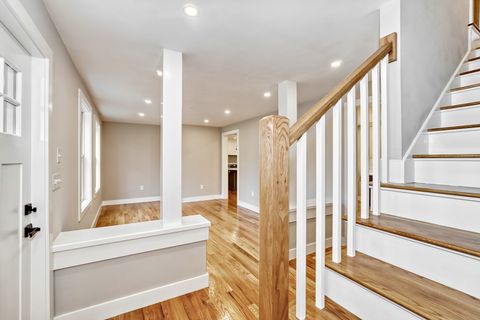
$2,299,000
5
bds
|
5
ba
|
4,835
sqft
|
built
2025
111 Cedar St, Lexington, MA 02421
$-4,849
Cash flow
-11.0%
Cash-on-Cash Return
3.1%
Cap rate
0.5%
Rent to Value Ratio
10 out of 16 properties for sale in 02421
Limited Results Shown
Create a free account, or log in to reveal all property listings and enjoy the complete experience.
Active
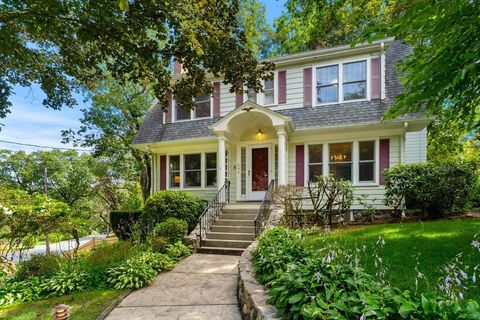
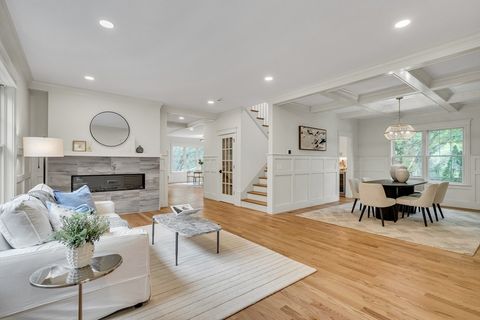
$1,695,000
4
bds
|
3
ba
|
3,033
sqft
|
built
1925
36 Independence Ave, Lexington, MA 02421
$-5,356
Cash flow
-16.5%
Cash-on-Cash Return
1.9%
Cap rate
0.4%
Rent to Value Ratio
Active
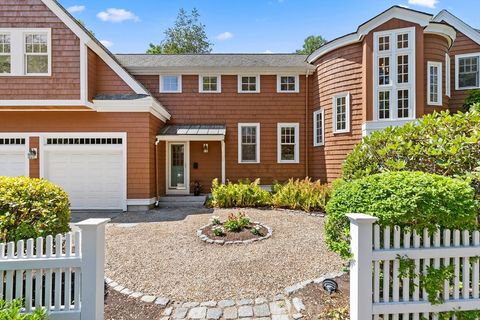
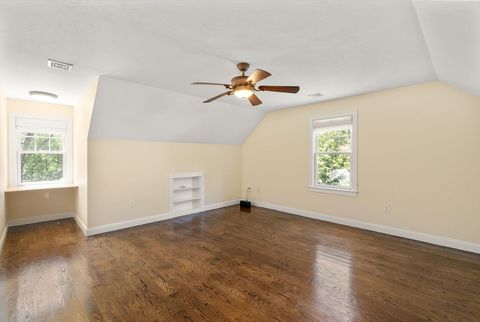
$2,385,000
6
bds
|
4
ba
|
4,500
sqft
|
built
1951
2380 Massachusetts Ave, Lexington, MA 02421
$-7,760
Cash flow
-17.0%
Cash-on-Cash Return
1.8%
Cap rate
0.3%
Rent to Value Ratio
Active
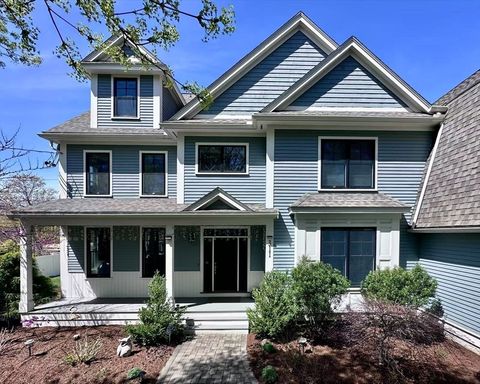
$3,600,000
6
bds
|
7
ba
|
7,049
sqft
|
built
1902
2 Effie Pl, Lexington, MA 02421
$-8,344,090
Cash flow
-12092.9%
Cash-on-Cash Return
-2775.7%
Cap rate
0.3%
Rent to Value Ratio
Active
$2,779,000
5
bds
|
5
ba
|
4,970
sqft
|
built
2025
70 Valleyfield St, Lexington, MA 02421
$-18,724
Cash flow
-35.2%
Cash-on-Cash Return
-2.4%
Cap rate
0.1%
Rent to Value Ratio
Active
$2,775,000
6
bds
|
5
ba
|
5,781
sqft
|
built
2006
127 Shade St, Lexington, MA 02421
$-10,077
Cash flow
-18.9%
Cash-on-Cash Return
1.3%
Cap rate
0.3%
Rent to Value Ratio
Active
$3,068,000
5
bds
|
6
ba
|
7,012
sqft
|
built
2018
311 Concord Ave, Lexington, MA 02421
$-11,949
Cash flow
-20.3%
Cash-on-Cash Return
1.0%
Cap rate
0.3%
Rent to Value Ratio
Active
$2,250,000
4
bds
|
5
ba
|
4,300
sqft
|
built
2025
383 Marrett Rd, Lexington, MA 02421
$-16,221
Cash flow
-37.6%
Cash-on-Cash Return
-3.0%
Cap rate
0.2%
Rent to Value Ratio
Active
$2,595,000
5
bds
|
6
ba
|
5,311
sqft
|
built
2025
12 Wilson Rd, Lexington, MA 02421
$-9,175
Cash flow
-18.4%
Cash-on-Cash Return
1.4%
Cap rate
0.2%
Rent to Value Ratio