02472 Investment Properties for Sale
Browse homes for sale and investment properties in 02472. Refine your search by price, property type, or more.
Best cash flowing properties in 02472
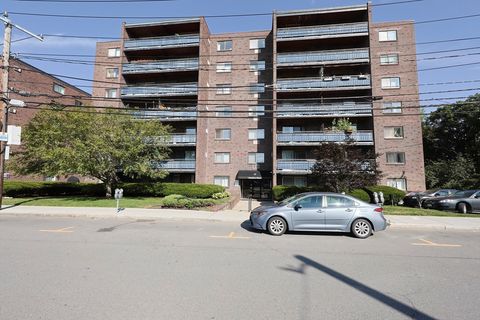
Active
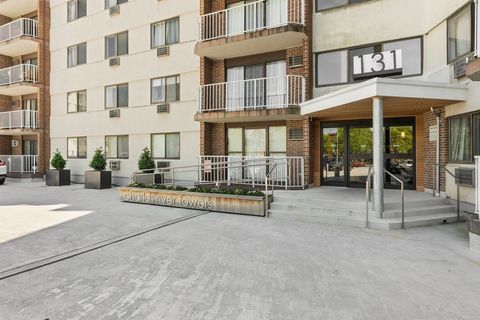
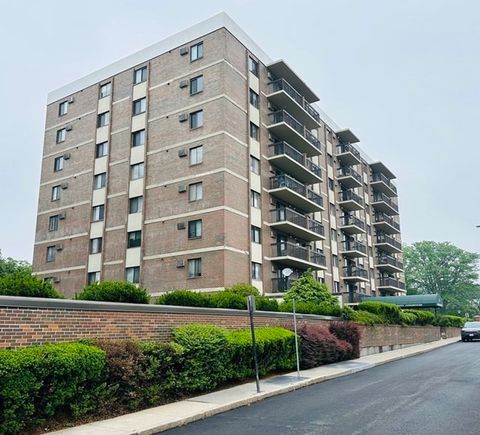
$524,900
2
bds
|
2
ba
|
1,270
sqft
|
built
1981
131 Coolidge Ave, Watertown, MA 02472
$-787
Cash flow
-7.8%
Cash-on-Cash Return
3.9%
Cap rate
0.6%
Rent to Value Ratio
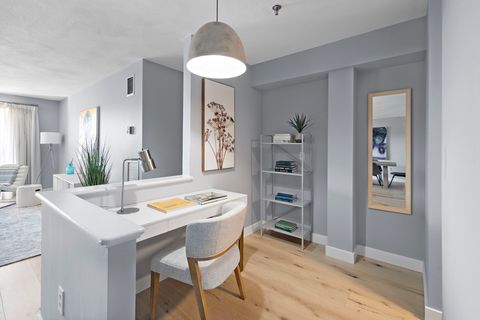
Active
$399,900
1
bds
|
1
ba
|
735
sqft
|
built
1973
164 Galen St, Watertown, MA 02472
$-1,079
Cash flow
-14.1%
Cash-on-Cash Return
2.4%
Cap rate
0.6%
Rent to Value Ratio
21 out of 31 properties for sale in 02472
Limited Results Shown
Create a free account, or log in to reveal all property listings and enjoy the complete experience.
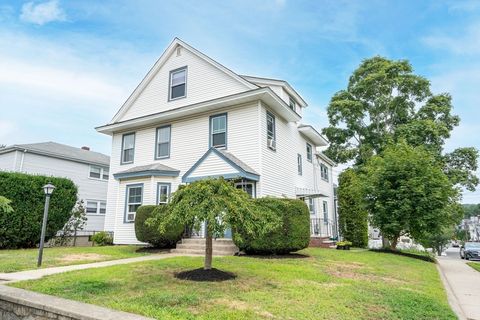
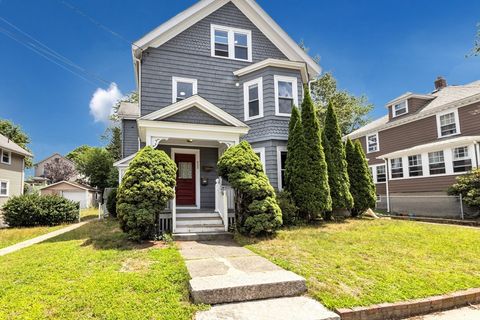
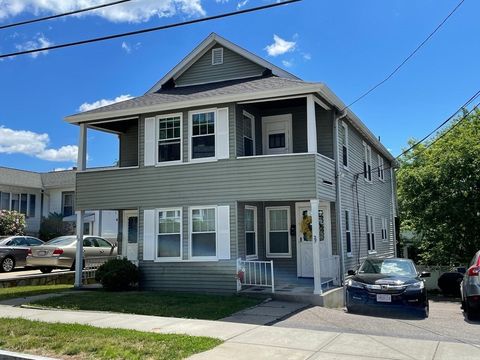
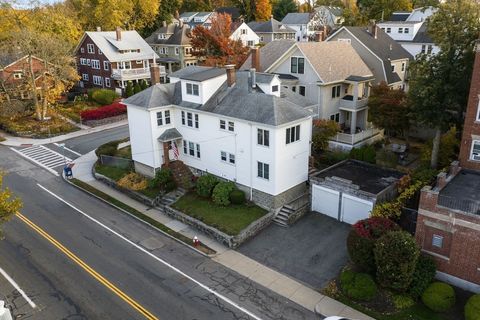
Active
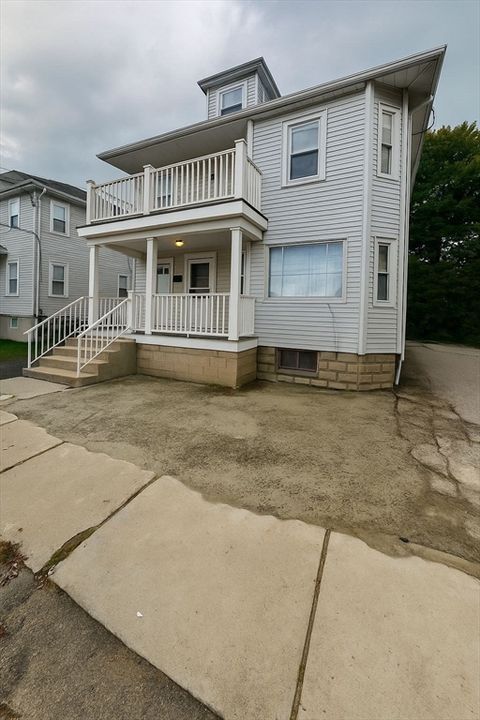
$1,100,000
4
bds
|
2
ba
|
2,200
sqft
|
built
1930
27 Quimby St, Watertown, MA 02472
$-3,873
Cash flow
-18.4%
Cash-on-Cash Return
1.5%
Cap rate
0.3%
Rent to Value Ratio
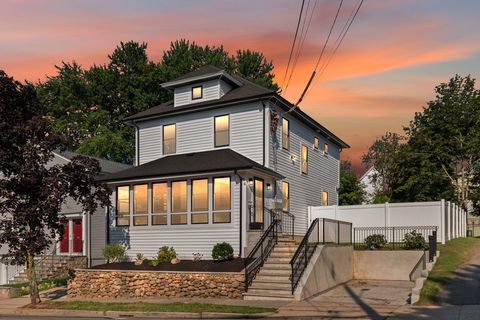
Active
$699,900
2
bds
|
2
ba
|
1,070
sqft
|
built
1975
48 Bigelow Ave, Watertown, MA 02472
$-2,198
Cash flow
-16.4%
Cash-on-Cash Return
1.9%
Cap rate
0.5%
Rent to Value Ratio
Active
$849,900
3
bds
|
2
ba
|
1,744
sqft
|
built
1920
289 Waverley Ave, Watertown, MA 02472
$-2,000
Cash flow
-12.3%
Cash-on-Cash Return
2.9%
Cap rate
0.4%
Rent to Value Ratio
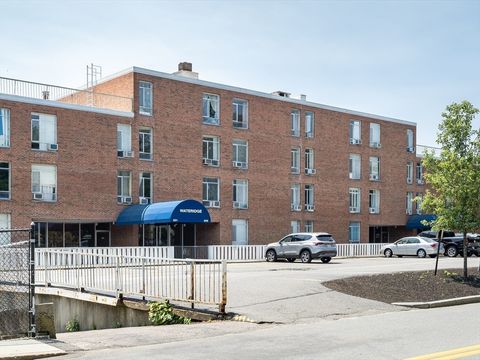
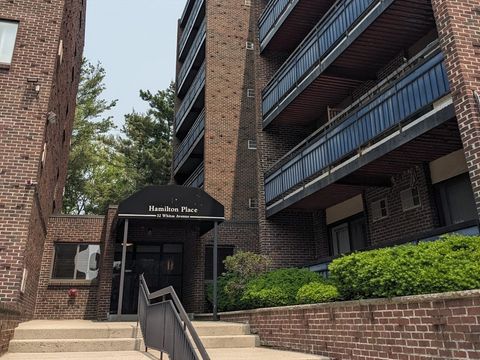
Active
$535,000
2
bds
|
2
ba
|
1,050
sqft
|
built
1966
32 Whites Ave, Watertown, MA 02472
$-1,693
Cash flow
-16.5%
Cash-on-Cash Return
1.9%
Cap rate
0.5%
Rent to Value Ratio
Active
$929,000
2
bds
|
2
ba
|
1,085
sqft
|
built
2020
101 N Beacon St, Watertown, MA 02472
$-2,738
Cash flow
-15.4%
Cash-on-Cash Return
2.1%
Cap rate
0.5%
Rent to Value Ratio
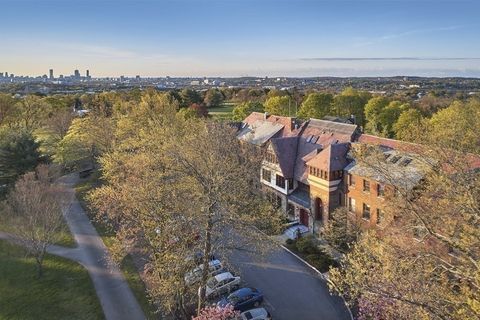
Active
$1,925,000
4
bds
|
5
ba
|
4,066
sqft
|
built
1900
199 Palfrey St, Watertown, MA 02472
$-6,307
Cash flow
-17.1%
Cash-on-Cash Return
1.7%
Cap rate
0.3%
Rent to Value Ratio
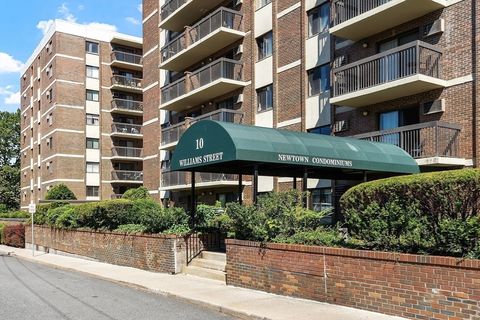
Active
$469,900
2
bds
|
2
ba
|
1,080
sqft
|
built
1973
10 Williams St, Watertown, MA 02472
$-1,249
Cash flow
-13.9%
Cash-on-Cash Return
2.5%
Cap rate
0.7%
Rent to Value Ratio
Active
$1,550,000
3
bds
|
4
ba
|
2,561
sqft
|
built
1910
94 Lexington St, Watertown, MA 02472
$-5,278
Cash flow
-17.8%
Cash-on-Cash Return
1.6%
Cap rate
0.3%
Rent to Value Ratio
Active
$1,229,900
8
bds
|
4
ba
|
4,000
sqft
|
built
1880
220 Sycamore St, Watertown, MA 02472
$-4,323
Cash flow
-18.3%
Cash-on-Cash Return
1.5%
Cap rate
0.3%
Rent to Value Ratio
Active
$1,325,000
2
bds
|
3
ba
|
1,600
sqft
|
built
1882
456 Belmont St, Watertown, MA 02472
$-2,887
Cash flow
-11.4%
Cash-on-Cash Return
3.1%
Cap rate
0.6%
Rent to Value Ratio
Active
$1,135,000
5
bds
|
2
ba
|
2,456
sqft
|
built
1930
27-29 Edenfield Ave, Watertown, MA 02472
$-3,796
Cash flow
-17.4%
Cash-on-Cash Return
1.7%
Cap rate
0.3%
Rent to Value Ratio
Active
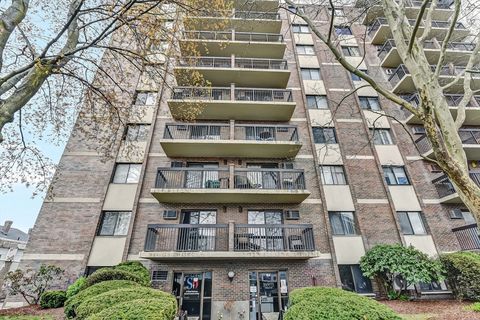
$519,000
2
bds
|
1
ba
|
851
sqft
|
built
1962
231 Coolidge Ave, Watertown, MA 02472
$-1,914
Cash flow
-19.2%
Cash-on-Cash Return
1.3%
Cap rate
0.5%
Rent to Value Ratio
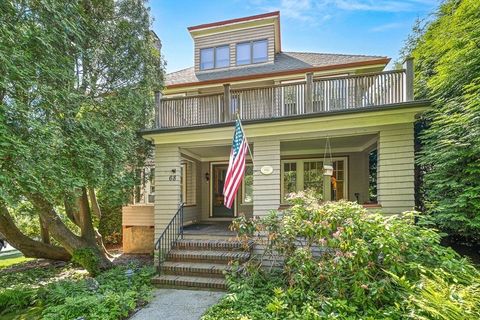
Active
$1,575,000
5
bds
|
3
ba
|
3,368
sqft
|
built
1916
68 Barnard Ave, Watertown, MA 02472
$-6,320
Cash flow
-20.9%
Cash-on-Cash Return
0.9%
Cap rate
0.2%
Rent to Value Ratio
Active
$579,000
2
bds
|
2
ba
|
1,075
sqft
|
built
1966
32 Whites Ave, Watertown, MA 02472
$-1,801
Cash flow
-16.2%
Cash-on-Cash Return
1.9%
Cap rate
0.5%
Rent to Value Ratio
Active
$449,000
2
bds
|
1
ba
|
950
sqft
|
built
1973
10 Williams St, Watertown, MA 02472
$-1,354
Cash flow
-15.7%
Cash-on-Cash Return
2.1%
Cap rate
0.6%
Rent to Value Ratio
Active
$449,000
2
bds
|
1
ba
|
950
sqft
|
built
1973
164 Galen St, Watertown, MA 02472
$-1,422
Cash flow
-16.5%
Cash-on-Cash Return
1.9%
Cap rate
0.6%
Rent to Value Ratio
Active
$1,279,000
5
bds
|
2
ba
|
3,098
sqft
|
built
1920
532 Belmont St, Watertown, MA 02472
$-4,636
Cash flow
-18.9%
Cash-on-Cash Return
1.3%
Cap rate
0.3%
Rent to Value Ratio
Active
$389,900
1
bds
|
1
ba
|
670
sqft
|
built
1973
164 Galen St, Watertown, MA 02472
$-1,148
Cash flow
-15.4%
Cash-on-Cash Return
2.1%
Cap rate
0.6%
Rent to Value Ratio
Active
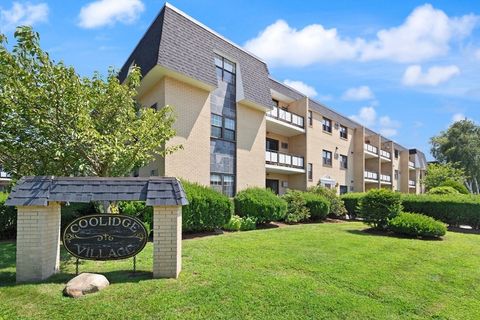
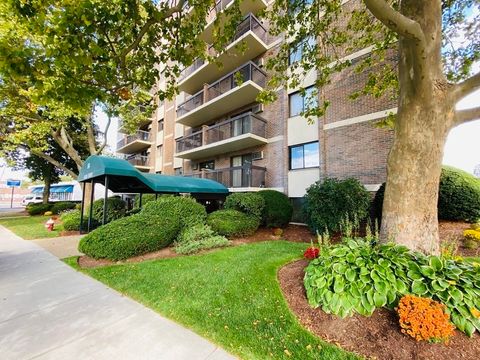
$805,000
2
bds
|
2
ba
|
1,304
sqft
|
built
1986
199 Coolidge Ave, Watertown, MA 02472
$-3,131
Cash flow
-20.3%
Cash-on-Cash Return
1.0%
Cap rate
0.5%
Rent to Value Ratio