02540 Investment Properties for Sale
Browse homes for sale and investment properties in 02540. Refine your search by price, property type, or more.
Best cash flowing properties in 02540
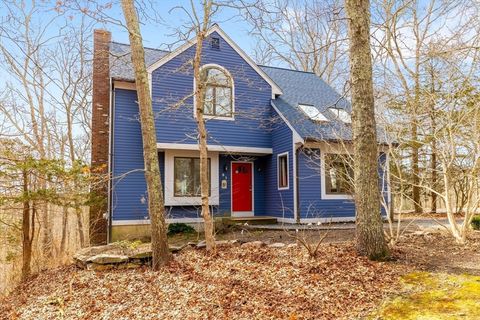
Active
$625,000
3
bds
|
2
ba
|
1,708
sqft
|
built
1988
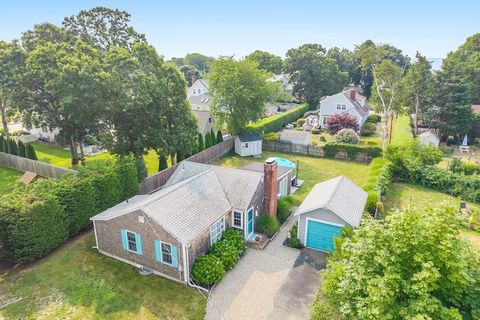
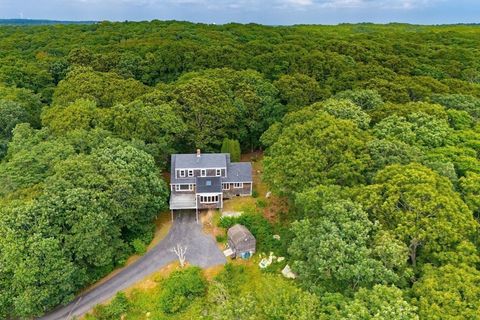
21 Braeside Rd, Falmouth, MA 02540
$-819
Cash flow
-6.8%
Cash-on-Cash Return
4.1%
Cap rate
0.6%
Rent to Value Ratio
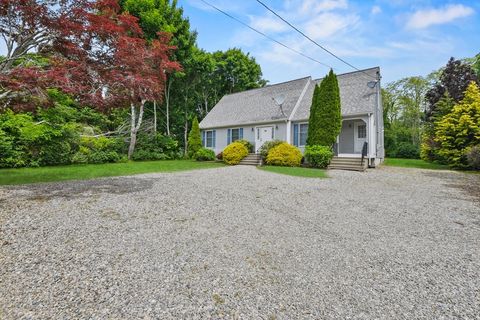
Active
$724,999
3
bds
|
2
ba
|
1,710
sqft
|
built
2006
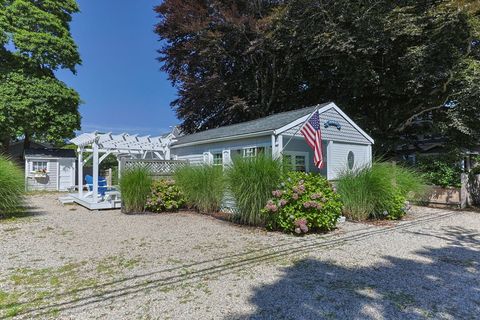
94 Jones Rd, Falmouth, MA 02540
$-1,545
Cash flow
-11.1%
Cash-on-Cash Return
3.1%
Cap rate
0.4%
Rent to Value Ratio
16 out of 26 properties for sale in 02540
Limited Results Shown
Create a free account, or log in to reveal all property listings and enjoy the complete experience.
Active
$5,295,000
4
bds
|
4
ba
|
3,166
sqft
|
built
1986
44 Carey Ln, Falmouth, MA 02540
$-21,336
Cash flow
-21.0%
Cash-on-Cash Return
0.8%
Cap rate
0.2%
Rent to Value Ratio
Active
$2,790,000
3
bds
|
3
ba
|
3,816
sqft
|
built
1930
102 Nashawena St, Falmouth, MA 02540
$-8,259
Cash flow
-15.4%
Cash-on-Cash Return
2.1%
Cap rate
0.3%
Rent to Value Ratio
Active
$1,195,000
3
bds
|
2
ba
|
1,006
sqft
|
built
1954
9 Ginwal St, Falmouth, MA 02540
$-3,610
Cash flow
-15.8%
Cash-on-Cash Return
2.1%
Cap rate
0.3%
Rent to Value Ratio
Active
$899,900
2
bds
|
1
ba
|
640
sqft
|
built
1946
17 Elysian Ave, Falmouth, MA 02540
$-2,643
Cash flow
-15.3%
Cash-on-Cash Return
2.2%
Cap rate
0.3%
Rent to Value Ratio
Active
$1,100,000
3
bds
|
3
ba
|
2,964
sqft
|
built
1985
126 Ambleside Dr, Falmouth, MA 02540
$-2,868
Cash flow
-13.6%
Cash-on-Cash Return
2.6%
Cap rate
0.4%
Rent to Value Ratio
Active
$1,195,000
4
bds
|
3
ba
|
2,697
sqft
|
built
1950
908 W Falmouth Hwy, Falmouth, MA 02540
$-3,018
Cash flow
-13.2%
Cash-on-Cash Return
2.6%
Cap rate
0.4%
Rent to Value Ratio
Active
$1,495,000
3
bds
|
2
ba
|
2,133
sqft
|
built
1962
27 Upland Ave, Falmouth, MA 02540
$-4,716
Cash flow
-16.5%
Cash-on-Cash Return
1.9%
Cap rate
0.3%
Rent to Value Ratio
Active
$995,000
3
bds
|
3
ba
|
2,793
sqft
|
built
1985
106 Ambleside Dr, Falmouth, MA 02540
$-2,395
Cash flow
-12.6%
Cash-on-Cash Return
2.8%
Cap rate
0.4%
Rent to Value Ratio
Active
$955,000
3
bds
|
3
ba
|
2,222
sqft
|
built
1870
480 Main St, Falmouth, MA 02540
$-3,145
Cash flow
-17.2%
Cash-on-Cash Return
1.7%
Cap rate
0.4%
Rent to Value Ratio
Active
$750,000
3
bds
|
3
ba
|
1,673
sqft
|
built
1988
113 Blacksmith Shop Rd, Falmouth, MA 02540
$-1,665
Cash flow
-11.6%
Cash-on-Cash Return
3.0%
Cap rate
0.4%
Rent to Value Ratio
Active
$1,695,000
4
bds
|
3
ba
|
3,046
sqft
|
built
2023
4 Charles Ln, Falmouth, MA 02540
$-5,288
Cash flow
-16.3%
Cash-on-Cash Return
1.9%
Cap rate
0.3%
Rent to Value Ratio
Active
$2,300,000
3
bds
|
3
ba
|
2,865
sqft
|
built
2001
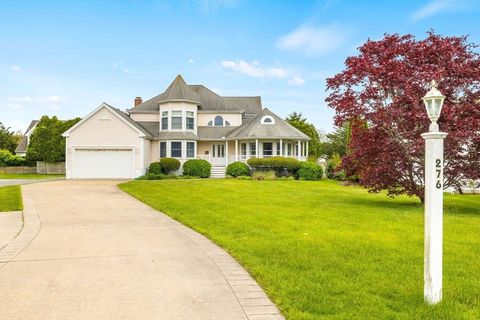
276 Shore St, Falmouth, MA 02540
$-7,815
Cash flow
-17.7%
Cash-on-Cash Return
1.6%
Cap rate
0.2%
Rent to Value Ratio
Active
$1,250,000
4
bds
|
3
ba
|
2,376
sqft
|
built
1973
15 Marvin Cir, Falmouth, MA 02540
$-3,968
Cash flow
-16.6%
Cash-on-Cash Return
1.9%
Cap rate
0.3%
Rent to Value Ratio
Active
$999,999
2
bds
|
1
ba
|
1,008
sqft
|
built
1950
133 Mariners Ln, Falmouth, MA 02540
$-3,004
Cash flow
-15.7%
Cash-on-Cash Return
2.1%
Cap rate
0.3%
Rent to Value Ratio