02540 Investment Properties for Sale
Browse homes for sale and investment properties in 02540. Refine your search by price, property type, or more.
Best cash flowing properties in 02540
Active
$350,000
3
bds
|
3
ba
|
2,215
sqft
|
built
1991
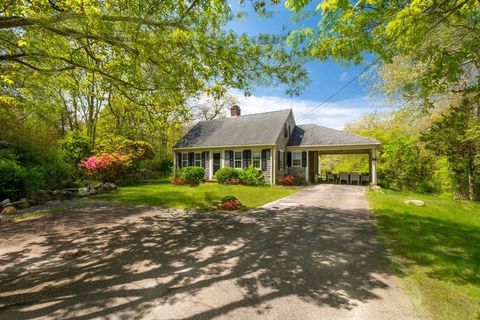
29 Woodview Dr, Falmouth, MA 02540
$-395
Cash flow
-5.9%
Cash-on-Cash Return
4.9%
Cap rate
0.7%
Rent to Value Ratio
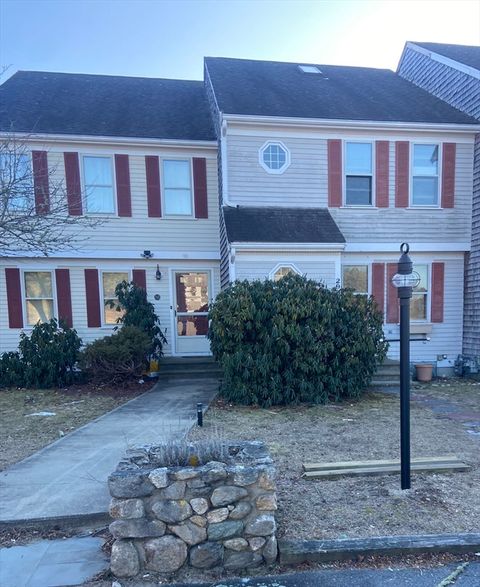
Active
$427,000
2
bds
|
2
ba
|
1,165
sqft
|
built
1987
14 Woodview Dr, Falmouth, MA 02540
$-670
Cash flow
-8.2%
Cash-on-Cash Return
4.4%
Cap rate
0.7%
Rent to Value Ratio
29 out of 42 properties for sale in 02540
Limited Results Shown
Create a free account, or log in to reveal all property listings and enjoy the complete experience.
Active
$1,450,000
4
bds
|
4
ba
|
3,116
sqft
|
built
1995
50 View Crest Dr, Falmouth, MA 02540
$-4,566
Cash flow
-16.4%
Cash-on-Cash Return
2.5%
Cap rate
0.4%
Rent to Value Ratio
Active
$1,339,000
4
bds
|
3
ba
|
3,500
sqft
|
built
1989
46 Clear Pond Rd, Falmouth, MA 02540
$-4,596
Cash flow
-17.9%
Cash-on-Cash Return
1.6%
Cap rate
0.3%
Rent to Value Ratio
Active
$1,950,000
3
bds
|
4
ba
|
2,421
sqft
|
built
2013
33 Harbor Ave, Falmouth, MA 02540
$-8,429
Cash flow
-22.6%
Cash-on-Cash Return
1.1%
Cap rate
0.2%
Rent to Value Ratio
Active
$599,900
2
bds
|
2
ba
|
1,349
sqft
|
built
2005
110 Dillingham Ave, Falmouth, MA 02540
$-2,799
Cash flow
-24.3%
Cash-on-Cash Return
0.7%
Cap rate
0.5%
Rent to Value Ratio
Active
$4,500,000
4
bds
|
4
ba
|
3,377
sqft
|
built
1973
124 Associates Rd, Falmouth, MA 02540
$-21,130
Cash flow
-24.5%
Cash-on-Cash Return
0.6%
Cap rate
0.1%
Rent to Value Ratio
Active
$749,900
3
bds
|
2
ba
|
1,710
sqft
|
built
2006
94 Jones Rd, Falmouth, MA 02540
$-2,029
Cash flow
-14.1%
Cash-on-Cash Return
3.0%
Cap rate
0.4%
Rent to Value Ratio
Active
$1,200,000
3
bds
|
2
ba
|
1,419
sqft
|
built
1962
21 Haynes Ave, Falmouth, MA 02540
$-4,262
Cash flow
-18.5%
Cash-on-Cash Return
2.0%
Cap rate
0.3%
Rent to Value Ratio
Active
$1,295,000
2
bds
|
2
ba
|
2,112
sqft
|
built
1977
71 Oyster Pond Rd, Falmouth, MA 02540
$-4,651
Cash flow
-18.7%
Cash-on-Cash Return
2.0%
Cap rate
0.3%
Rent to Value Ratio
Active
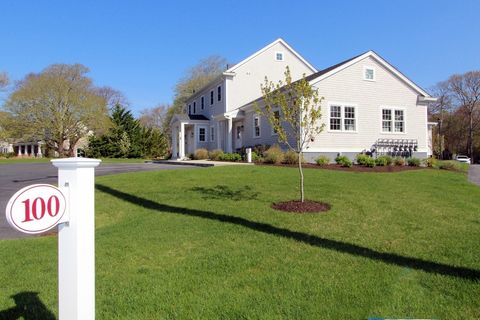
$799,000
2
bds
|
1
ba
|
1,080
sqft
|
built
2022
100 Dillingham Ave, Falmouth, MA 02540
$-2,424
Cash flow
-15.8%
Cash-on-Cash Return
2.6%
Cap rate
0.4%
Rent to Value Ratio
Active
$995,000
3
bds
|
3
ba
|
2,222
sqft
|
built
1870
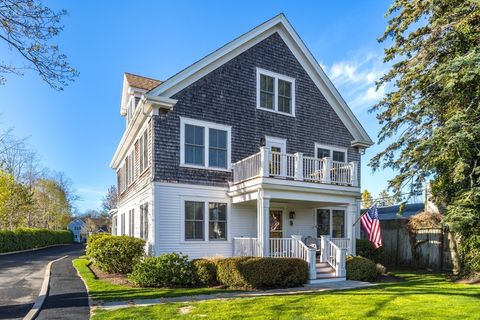
480 Main St, Falmouth, MA 02540
$-3,821
Cash flow
-20.0%
Cash-on-Cash Return
1.7%
Cap rate
0.4%
Rent to Value Ratio
Active
$799,000
3
bds
|
3
ba
|
1,673
sqft
|
built
1988
113 Blacksmith Shop Rd, Falmouth, MA 02540
$-2,287
Cash flow
-14.9%
Cash-on-Cash Return
2.8%
Cap rate
0.4%
Rent to Value Ratio
Active
$3,950,000
5
bds
|
4
ba
|
3,800
sqft
|
built
1912
200 Grand Ave, Falmouth, MA 02540
$-17,075
Cash flow
-22.6%
Cash-on-Cash Return
1.1%
Cap rate
0.2%
Rent to Value Ratio
Active
$4,750,000
4
bds
|
5
ba
|
3,088
sqft
|
built
1957
87 Oyster Pond Rd, Falmouth, MA 02540
$-20,943
Cash flow
-23.0%
Cash-on-Cash Return
1.0%
Cap rate
0.2%
Rent to Value Ratio
Active
$1,799,000
4
bds
|
3
ba
|
3,046
sqft
|
built
2023
4 Charles Ln, Falmouth, MA 02540
$-6,659
Cash flow
-19.3%
Cash-on-Cash Return
1.8%
Cap rate
0.3%
Rent to Value Ratio
Active
$2,845,000
3
bds
|
4
ba
|
1,860
sqft
|
built
1965
33 Wood Neck Rd, Falmouth, MA 02540
$-11,627
Cash flow
-21.3%
Cash-on-Cash Return
1.4%
Cap rate
0.2%
Rent to Value Ratio
Active
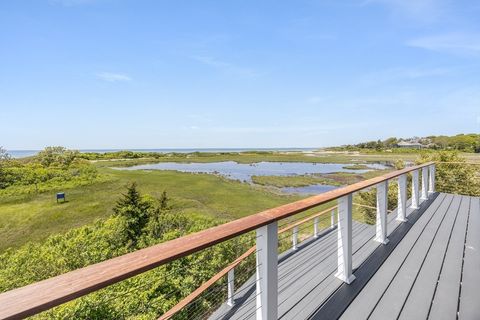
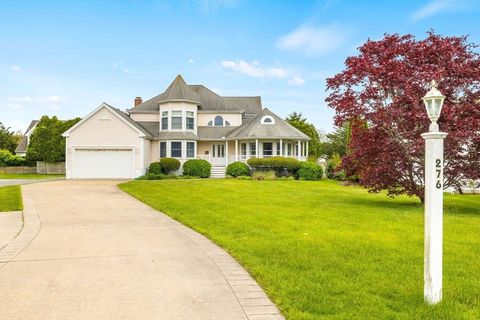
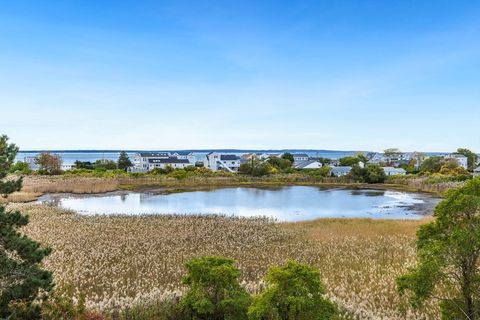
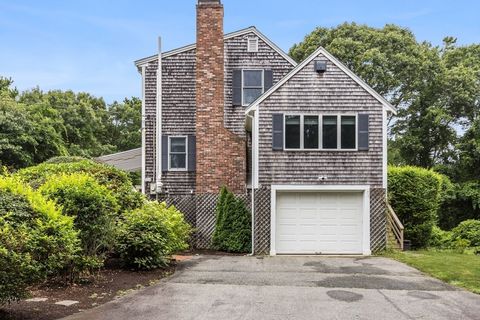
$2,400,000
3
bds
|
3
ba
|
2,865
sqft
|
built
2001
276 Shore St, Falmouth, MA 02540
$-9,461
Cash flow
-20.6%
Cash-on-Cash Return
1.5%
Cap rate
0.2%
Rent to Value Ratio
Active
$2,890,000
4
bds
|
4
ba
|
3,869
sqft
|
built
2024
179 Beebe Acres Rd, Falmouth, MA 02540
$-13,302
Cash flow
-24.0%
Cash-on-Cash Return
0.7%
Cap rate
0.1%
Rent to Value Ratio
Active
$1,149,000
3
bds
|
3
ba
|
2,118
sqft
|
built
1978
64 Grouse St, Falmouth, MA 02540
$-3,759
Cash flow
-17.1%
Cash-on-Cash Return
2.3%
Cap rate
0.3%
Rent to Value Ratio
Active
$775,000
3
bds
|
1
ba
|
1,196
sqft
|
built
1964
76 Sippewissett Rd, Falmouth, MA 02540
$-2,201
Cash flow
-14.8%
Cash-on-Cash Return
2.9%
Cap rate
0.4%
Rent to Value Ratio

Active
$859,000
4
bds
|
2
ba
|
1,616
sqft
|
built
1920
10 Vesper Ave, Falmouth, MA 02540
$-2,402
Cash flow
-14.6%
Cash-on-Cash Return
2.9%
Cap rate
0.4%
Rent to Value Ratio
Active
$1,395,000
4
bds
|
3
ba
|
2,376
sqft
|
built
1973
15 Marvin Cir, Falmouth, MA 02540
$-5,336
Cash flow
-20.0%
Cash-on-Cash Return
1.7%
Cap rate
0.3%
Rent to Value Ratio
Active
$1,580,000
10
bds
|
7
ba
|
4,072
sqft
|
built
1900
48 Walker St, Falmouth, MA 02540
$-6,354
Cash flow
-21.0%
Cash-on-Cash Return
1.4%
Cap rate
0.2%
Rent to Value Ratio
Active
$1,170,000
2
bds
|
4
ba
|
1,698
sqft
|
built
1998
174 Queen St, Falmouth, MA 02540
$-4,344
Cash flow
-19.4%
Cash-on-Cash Return
1.8%
Cap rate
0.3%
Rent to Value Ratio
Active
$999,999
2
bds
|
1
ba
|
1,008
sqft
|
built
1950
133 Mariners Ln, Falmouth, MA 02540
$-3,493
Cash flow
-18.2%
Cash-on-Cash Return
2.1%
Cap rate
0.3%
Rent to Value Ratio

Active
$1,500,000
5
bds
|
4
ba
|
3,327
sqft
|
built
1890
251 Woods Hole Rd, Falmouth, MA 02540
$-5,601
Cash flow
-19.5%
Cash-on-Cash Return
1.8%
Cap rate
0.3%
Rent to Value Ratio

Active
$914,900
2
bds
|
3
ba
|
1,536
sqft
|
built
1983
5 Keel De Sac, Falmouth, MA 02540
$-3,098
Cash flow
-17.7%
Cash-on-Cash Return
2.2%
Cap rate
0.4%
Rent to Value Ratio
Active
$1,250,000
4
bds
|
2
ba
|
2,124
sqft
|
built
1983
83 Colonial Way, Falmouth, MA 02540
$-4,024
Cash flow
-16.8%
Cash-on-Cash Return
2.4%
Cap rate
0.4%
Rent to Value Ratio