02633 Investment Properties for Sale
Browse homes for sale and investment properties in 02633. Refine your search by price, property type, or more.
Best cash flowing properties in 02633
Active
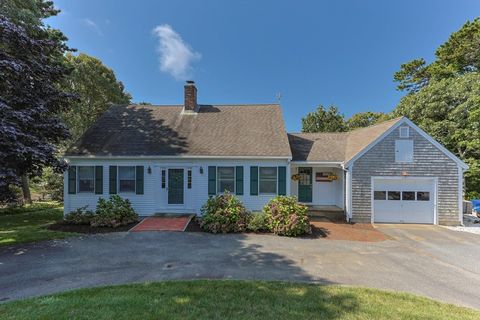
$995,000
3
bds
|
2
ba
|
1,726
sqft
|
built
1972
144 Lakeview Ave, Chatham, MA 02633
$-2,162
Cash flow
-11.3%
Cash-on-Cash Return
3.1%
Cap rate
0.4%
Rent to Value Ratio
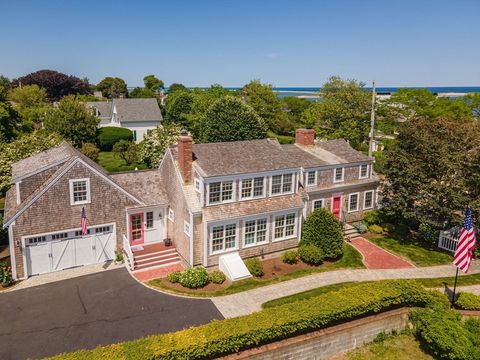
Active
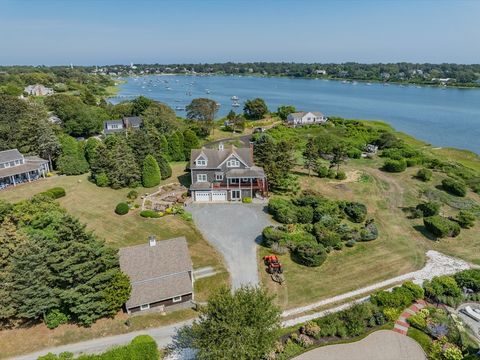
$1,195,000
3
bds
|
3
ba
|
2,202
sqft
|
built
1984
319 Riverview Dr, Chatham, MA 02633
$-2,485
Cash flow
-10.8%
Cash-on-Cash Return
3.2%
Cap rate
0.4%
Rent to Value Ratio
32 out of 38 properties for sale in 02633
Limited Results Shown
Create a free account, or log in to reveal all property listings and enjoy the complete experience.
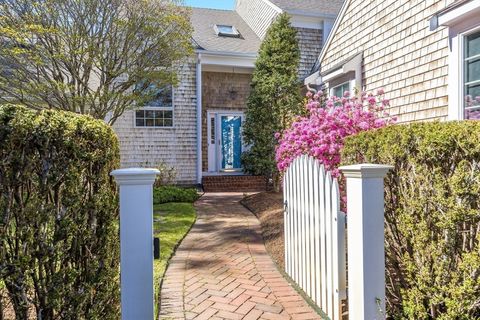
Active
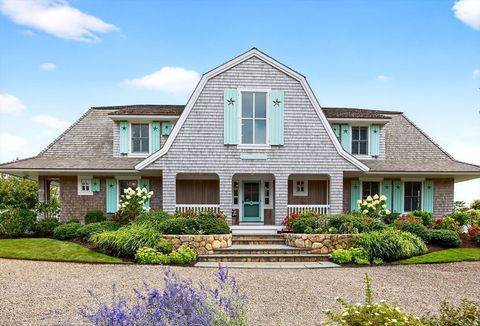
$5,900,000
2
bds
|
3
ba
|
1,850
sqft
|
built
2004
99 Uncle Alberts Drive Ext, Chatham, MA 02633
$-23,505
Cash flow
-20.8%
Cash-on-Cash Return
0.9%
Cap rate
0.1%
Rent to Value Ratio
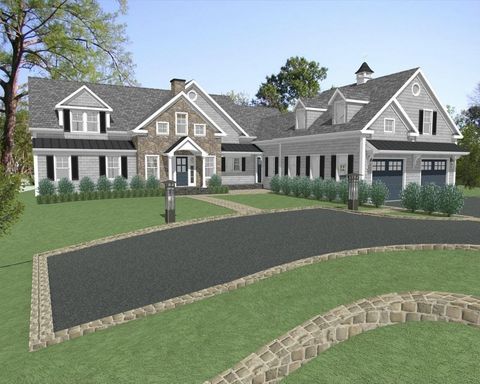
Active
$6,695,000
4
bds
|
5
ba
|
3,225
sqft
|
built
2010
101 Morris Island Rd, Chatham, MA 02633
$-28,325
Cash flow
-22.1%
Cash-on-Cash Return
0.6%
Cap rate
0.1%
Rent to Value Ratio
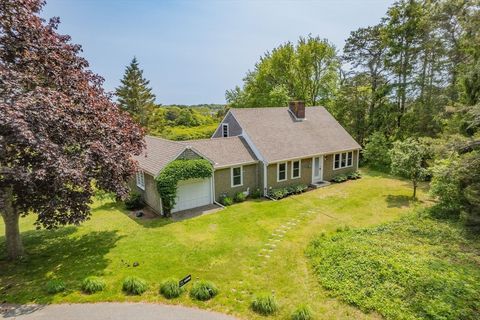
Active
$1,995,000
4
bds
|
4
ba
|
2,770
sqft
|
built
1970
20 Hardings Beach Rd, Chatham, MA 02633
$-6,725
Cash flow
-17.6%
Cash-on-Cash Return
1.6%
Cap rate
0.2%
Rent to Value Ratio
Active
$1,599,000
4
bds
|
2
ba
|
2,392
sqft
|
built
1979
56 Skyline Dr, Chatham, MA 02633
$-4,443
Cash flow
-14.5%
Cash-on-Cash Return
2.3%
Cap rate
0.3%
Rent to Value Ratio
Active
$2,200,000
3
bds
|
3
ba
|
2,510
sqft
|
built
1972
55 Christopher Harding Ln, Chatham, MA 02633
$-5,983
Cash flow
-14.2%
Cash-on-Cash Return
2.4%
Cap rate
0.3%
Rent to Value Ratio
Active
$1,299,000
3
bds
|
2
ba
|
1,775
sqft
|
built
2023
1775 Main St, Chatham, MA 02633
$-3,694
Cash flow
-14.8%
Cash-on-Cash Return
2.3%
Cap rate
0.3%
Rent to Value Ratio
Active
$1,195,000
3
bds
|
2
ba
|
1,708
sqft
|
built
1971
56 Riverview Dr, Chatham, MA 02633
$-3,137
Cash flow
-13.7%
Cash-on-Cash Return
2.5%
Cap rate
0.3%
Rent to Value Ratio
Active
$8,500,000
7
bds
|
7
ba
|
6,521
sqft
|
built
1925
44 Buena Vista Rd, Chatham, MA 02633
$-38,948
Cash flow
-23.9%
Cash-on-Cash Return
0.2%
Cap rate
0.0%
Rent to Value Ratio
Active
$8,250,000
5
bds
|
4
ba
|
4,307
sqft
|
built
1986
127 Wapoos Trl, Chatham, MA 02633
$-37,202
Cash flow
-23.5%
Cash-on-Cash Return
0.3%
Cap rate
0.1%
Rent to Value Ratio
Active
$5,295,000
4
bds
|
6
ba
|
4,989
sqft
|
built
2025
14 Pond View Ln, Chatham, MA 02633
$-22,466
Cash flow
-22.1%
Cash-on-Cash Return
0.6%
Cap rate
0.1%
Rent to Value Ratio
Active
$3,895,000
4
bds
|
4
ba
|
3,000
sqft
|
built
2004
17 Bucks Ln, Chatham, MA 02633
$-14,993
Cash flow
-20.1%
Cash-on-Cash Return
1.1%
Cap rate
0.2%
Rent to Value Ratio
Active
$7,299,000
4
bds
|
5
ba
|
4,214
sqft
|
built
2019
12 Pond St, Chatham, MA 02633
$-30,825
Cash flow
-22.0%
Cash-on-Cash Return
0.6%
Cap rate
0.1%
Rent to Value Ratio
Active
$3,399,000
3
bds
|
5
ba
|
4,361
sqft
|
built
1998
86 Champlain Rd, Chatham, MA 02633
$-12,771
Cash flow
-19.6%
Cash-on-Cash Return
1.2%
Cap rate
0.2%
Rent to Value Ratio
Active
$3,500,000
5
bds
|
4
ba
|
2,659
sqft
|
built
1820
92 Barcliff Ave, Chatham, MA 02633
$-12,882
Cash flow
-19.2%
Cash-on-Cash Return
1.3%
Cap rate
0.2%
Rent to Value Ratio
Active
$4,950,000
4
bds
|
4
ba
|
3,878
sqft
|
built
1997
38 Indian Trl, Chatham, MA 02633
$-18,261
Cash flow
-19.2%
Cash-on-Cash Return
1.3%
Cap rate
0.2%
Rent to Value Ratio
Active
$6,750,000
5
bds
|
6
ba
|
5,620
sqft
|
built
2007
15 Windy Hl, Chatham, MA 02633
$-29,617
Cash flow
-22.9%
Cash-on-Cash Return
0.4%
Cap rate
0.1%
Rent to Value Ratio
Active
$4,200,000
6
bds
|
4
ba
|
3,808
sqft
|
built
1840
150 Barcliff Ave, Chatham, MA 02633
$-16,183
Cash flow
-20.1%
Cash-on-Cash Return
1.1%
Cap rate
0.2%
Rent to Value Ratio
Active
$1,475,000
3
bds
|
4
ba
|
2,225
sqft
|
built
2004
355 Training Field Rd, Chatham, MA 02633
$-3,626
Cash flow
-12.8%
Cash-on-Cash Return
2.7%
Cap rate
0.4%
Rent to Value Ratio
Active
$5,900,000
4
bds
|
5
ba
|
4,654
sqft
|
built
1965
25 Wikis Way, Chatham, MA 02633
$-25,742
Cash flow
-22.8%
Cash-on-Cash Return
0.4%
Cap rate
0.1%
Rent to Value Ratio
Active
$2,300,000
4
bds
|
2
ba
|
1,238
sqft
|
built
1850
213 Main St, Chatham, MA 02633
$-8,536
Cash flow
-19.4%
Cash-on-Cash Return
1.2%
Cap rate
0.2%
Rent to Value Ratio
Active
$1,575,000
3
bds
|
3
ba
|
2,340
sqft
|
built
1971
307 Riverview Dr, Chatham, MA 02633
$-4,423
Cash flow
-14.7%
Cash-on-Cash Return
2.3%
Cap rate
0.3%
Rent to Value Ratio
Active
$7,200,000
5
bds
|
3
ba
|
1,896
sqft
|
built
1916
238 Cranberry Ln, Chatham, MA 02633
$-31,936
Cash flow
-23.1%
Cash-on-Cash Return
0.4%
Cap rate
0.1%
Rent to Value Ratio
Active
$4,400,000
3
bds
|
4
ba
|
2,998
sqft
|
built
1820
85 Main St, Chatham, MA 02633
$-17,965
Cash flow
-21.3%
Cash-on-Cash Return
0.8%
Cap rate
0.1%
Rent to Value Ratio
Active
$2,500,000
4
bds
|
4
ba
|
3,834
sqft
|
built
1987
106 Stage Neck Rd, Chatham, MA 02633
$-7,749
Cash flow
-16.2%
Cash-on-Cash Return
2.0%
Cap rate
0.3%
Rent to Value Ratio
Active
$6,995,000
5
bds
|
7
ba
|
5,700
sqft
|
built
2025
13 Captain Kendrick Dr, Chatham, MA 02633
$-30,797
Cash flow
-23.0%
Cash-on-Cash Return
0.4%
Cap rate
0.1%
Rent to Value Ratio
Active
$1,700,000
3
bds
|
2
ba
|
2,008
sqft
|
built
1954
9 Bettys Path, Chatham, MA 02633
$-5,695
Cash flow
-17.5%
Cash-on-Cash Return
1.7%
Cap rate
0.2%
Rent to Value Ratio
Active
$3,495,000
4
bds
|
4
ba
|
4,857
sqft
|
built
2005
36 Moonbeam Ln, Chatham, MA 02633
$-11,412
Cash flow
-17.0%
Cash-on-Cash Return
1.8%
Cap rate
0.3%
Rent to Value Ratio
Active
$2,995,000
4
bds
|
5
ba
|
3,603
sqft
|
built
2005
290 Old Comers Rd, Chatham, MA 02633
$-8,557
Cash flow
-14.9%
Cash-on-Cash Return
2.3%
Cap rate
0.3%
Rent to Value Ratio
Active
$4,750,000
4
bds
|
6
ba
|
5,372
sqft
|
built
2007
335 Stage Island Rd, Chatham, MA 02633
$-17,569
Cash flow
-19.3%
Cash-on-Cash Return
1.2%
Cap rate
0.2%
Rent to Value Ratio
Active
$1,469,000
5
bds
|
10
ba
|
11,000
sqft
|
built
2017
558 Fox Hill Rd, Chatham, MA 02633
$-5,830
Cash flow
-20.7%
Cash-on-Cash Return
0.9%
Cap rate
0.4%
Rent to Value Ratio