02673 Investment Properties for Sale
Browse homes for sale and investment properties in 02673. Refine your search by price, property type, or more.
Best cash flowing properties in 02673
Active
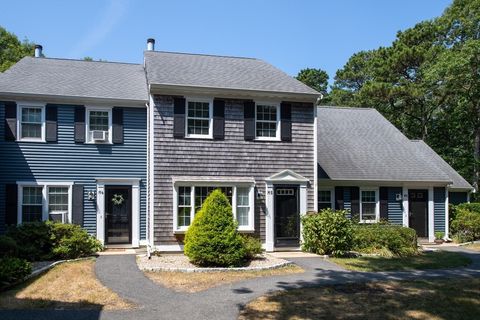
$350,000
2
bds
|
2
ba
|
1,152
sqft
|
built
1986
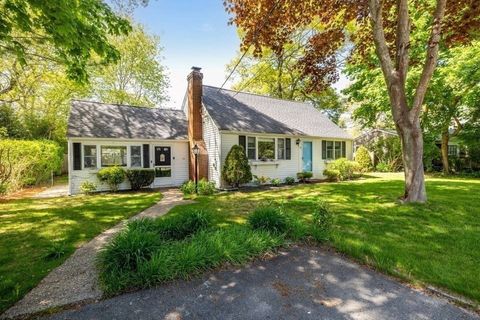
248 Camp St, West Yarmouth, MA 02673
$-579
Cash flow
-8.6%
Cash-on-Cash Return
3.7%
Cap rate
0.7%
Rent to Value Ratio
Active
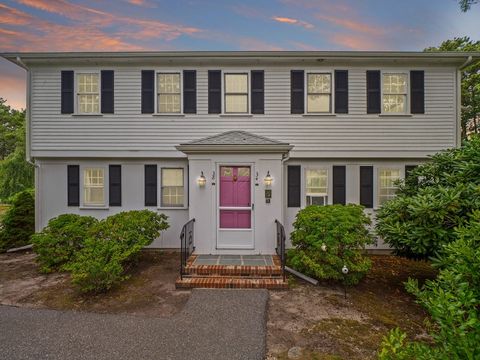
$349,000
2
bds
|
2
ba
|
1,000
sqft
|
built
1983
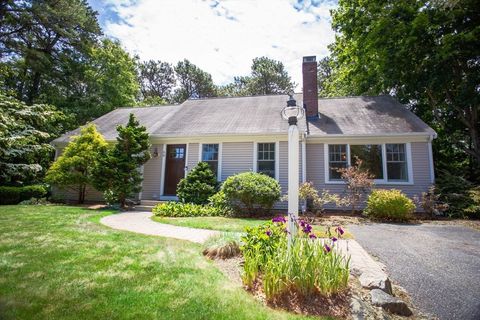
222 Buck Island Rd, West Yarmouth, MA 02673
$-743
Cash flow
-11.1%
Cash-on-Cash Return
3.1%
Cap rate
0.7%
Rent to Value Ratio
14 out of 21 properties for sale in 02673
Limited Results Shown
Create a free account, or log in to reveal all property listings and enjoy the complete experience.
Active
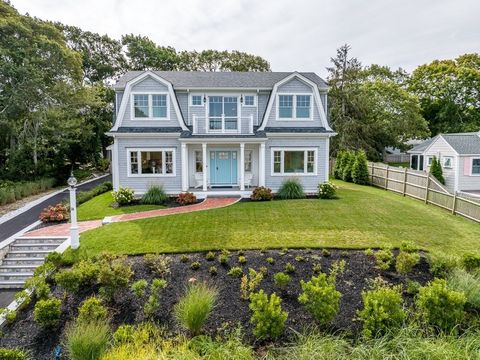
$2,375,000
4
bds
|
4
ba
|
3,634
sqft
|
built
2024
24 Valley Rd, West Yarmouth, MA 02673
$-5,334
Cash flow
-11.7%
Cash-on-Cash Return
3.0%
Cap rate
0.4%
Rent to Value Ratio
Active
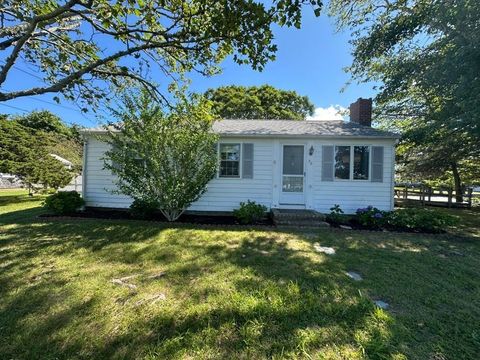
$499,000
3
bds
|
1
ba
|
936
sqft
|
built
1962
30 Nauset Ln, West Yarmouth, MA 02673
$-1,014
Cash flow
-10.6%
Cash-on-Cash Return
3.2%
Cap rate
0.5%
Rent to Value Ratio
Active
$2,399,000
4
bds
|
4
ba
|
4,128
sqft
|
built
1978
10 Mark Way, West Yarmouth, MA 02673
$-7,715
Cash flow
-16.8%
Cash-on-Cash Return
1.8%
Cap rate
0.3%
Rent to Value Ratio
Active
$585,000
3
bds
|
2
ba
|
1,440
sqft
|
built
1954
19 Anthony Rd, West Yarmouth, MA 02673
$-808
Cash flow
-7.2%
Cash-on-Cash Return
4.0%
Cap rate
0.5%
Rent to Value Ratio
Active
$675,000
2
bds
|
2
ba
|
1,324
sqft
|
built
1984
68 Lumberjack Trl, West Yarmouth, MA 02673
$-1,306
Cash flow
-10.1%
Cash-on-Cash Return
3.4%
Cap rate
0.5%
Rent to Value Ratio
Active
$1,695,000
3
bds
|
2
ba
|
1,885
sqft
|
built
1951
33 Hedge Row, West Yarmouth, MA 02673
$-6,049
Cash flow
-18.6%
Cash-on-Cash Return
1.4%
Cap rate
0.2%
Rent to Value Ratio
Active
$999,000
4
bds
|
2
ba
|
1,386
sqft
|
built
1963
16 Gulls Cove Rd, West Yarmouth, MA 02673
$-2,660
Cash flow
-13.9%
Cash-on-Cash Return
2.5%
Cap rate
0.4%
Rent to Value Ratio
Active
$734,000
4
bds
|
1
ba
|
1,152
sqft
|
built
1965
130 Wimbledon Dr, West Yarmouth, MA 02673
$-1,791
Cash flow
-12.7%
Cash-on-Cash Return
2.8%
Cap rate
0.4%
Rent to Value Ratio
Active
$699,000
2
bds
|
2
ba
|
1,710
sqft
|
built
1969
18 Buchanan Rd, West Yarmouth, MA 02673
$-1,466
Cash flow
-10.9%
Cash-on-Cash Return
3.2%
Cap rate
0.5%
Rent to Value Ratio
Active
$5,995,000
4
bds
|
5
ba
|
4,173
sqft
|
built
2010
31 Moss Rd, West Yarmouth, MA 02673
$-23,843
Cash flow
-20.8%
Cash-on-Cash Return
0.9%
Cap rate
0.2%
Rent to Value Ratio

Active
$875,000
4
bds
|
5
ba
|
1,528
sqft
|
built
1944
624 Route 28, West Yarmouth, MA 02673
$-2,456
Cash flow
-14.6%
Cash-on-Cash Return
2.3%
Cap rate
0.3%
Rent to Value Ratio
Active
$820,000
3
bds
|
2
ba
|
2,899
sqft
|
built
1960
107 Wimbledon Dr, West Yarmouth, MA 02673
$-1,535
Cash flow
-9.8%
Cash-on-Cash Return
3.4%
Cap rate
0.5%
Rent to Value Ratio