06360 Investment Properties for Sale
Browse homes for sale and investment properties in 06360. Refine your search by price, property type, or more.
Best cash flowing properties in 06360
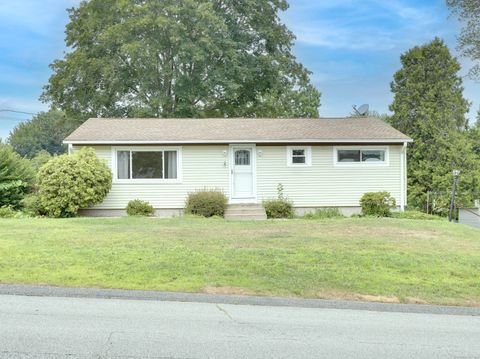
Active
$139,000
2
bds
|
2
ba
|
1,053
sqft
|
built
1966
51 N Cliff St, Norwich, CT 06360
$373
Cash flow
14.0%
Cash-on-Cash Return
8.9%
Cap rate
1.4%
Rent to Value Ratio
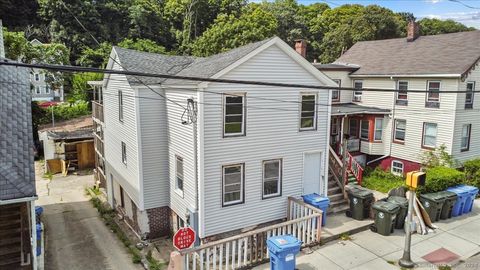
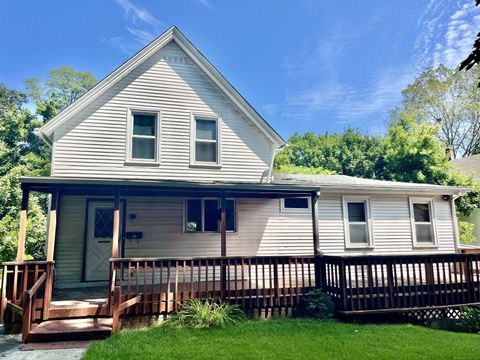
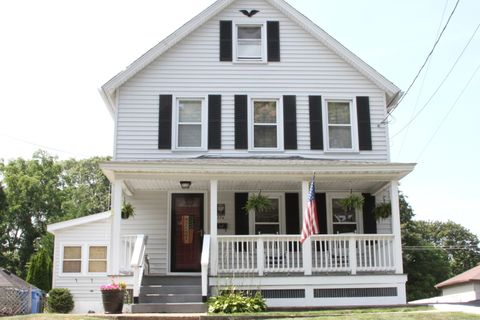
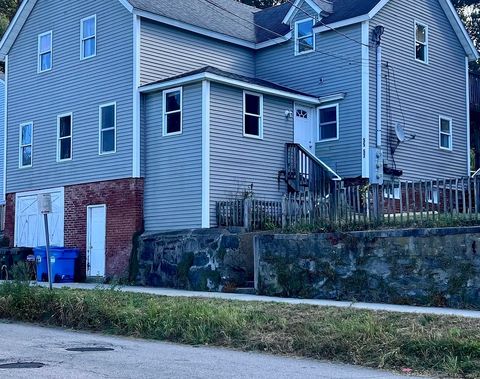
Active
$220,000
3
bds
|
1
ba
|
1,949
sqft
|
built
1925
189 Maple St, Norwich, CT 06360
$195
Cash flow
4.6%
Cash-on-Cash Return
6.7%
Cap rate
1.1%
Rent to Value Ratio
28 out of 32 properties for sale in 06360
Limited Results Shown
Create a free account, or log in to reveal all property listings and enjoy the complete experience.

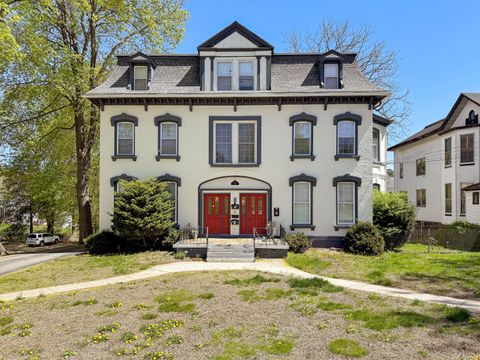
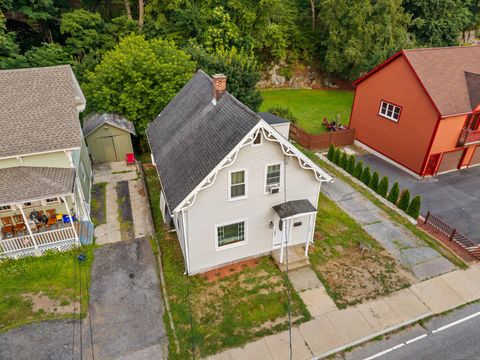
Active
$249,999
3
bds
|
2
ba
|
1,037
sqft
|
built
1918
180 Central Ave, Norwich, CT 06360
$-119
Cash flow
-2.5%
Cash-on-Cash Return
5.1%
Cap rate
0.8%
Rent to Value Ratio
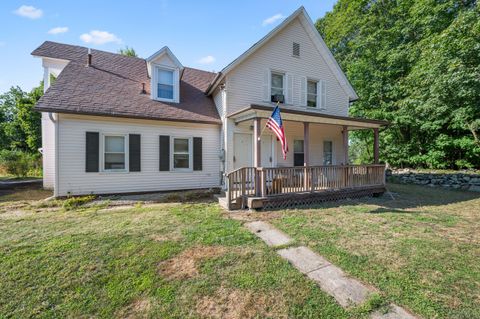
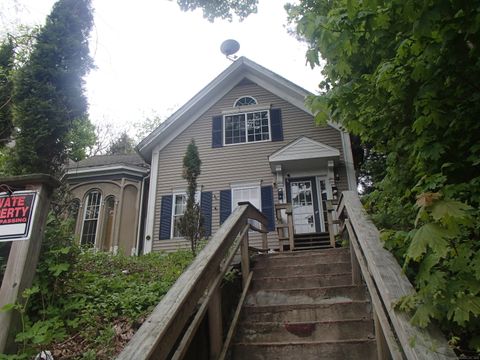
Active
$249,900
4
bds
|
2
ba
|
1,664
sqft
|
built
1920
746 Boswell Ave, Norwich, CT 06360
$-522
Cash flow
-10.9%
Cash-on-Cash Return
3.2%
Cap rate
0.6%
Rent to Value Ratio
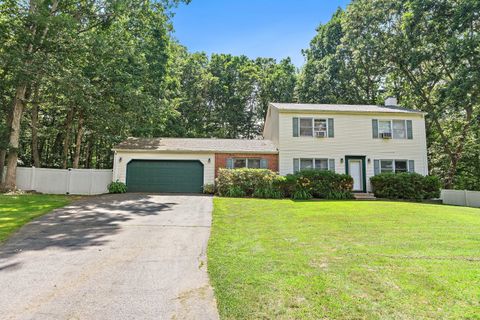
Active
$220,000
3
bds
|
2
ba
|
1,939
sqft
|
built
1772
6 Lee Ave, Norwich, CT 06360
$-147
Cash flow
-3.5%
Cash-on-Cash Return
4.9%
Cap rate
0.9%
Rent to Value Ratio
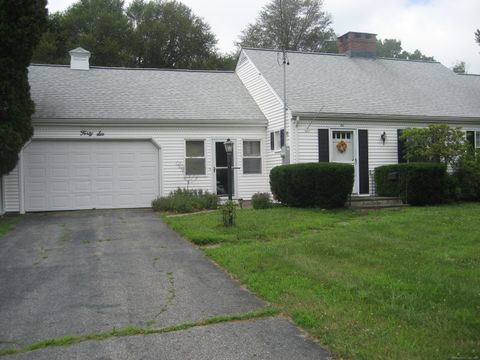
Active
$349,500
2
bds
|
1
ba
|
1,379
sqft
|
built
1956
46 Wayne St, Norwich, CT 06360
$-440
Cash flow
-6.6%
Cash-on-Cash Return
4.2%
Cap rate
0.7%
Rent to Value Ratio
Active
$369,000
3
bds
|
2
ba
|
1,537
sqft
|
built
1890
79 Roosevelt Ave, Norwich, CT 06360
$-661
Cash flow
-9.3%
Cash-on-Cash Return
3.5%
Cap rate
0.6%
Rent to Value Ratio
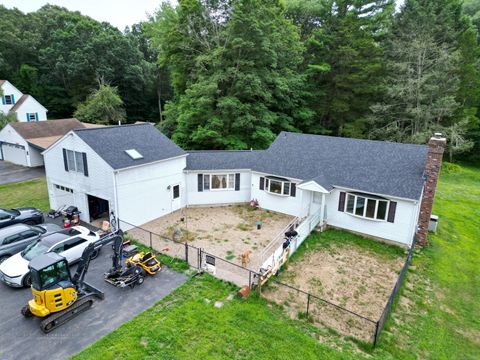
Active
$395,000
3
bds
|
3
ba
|
2,132
sqft
|
built
1953
90 Wawecus Hill Rd, Norwich, CT 06360
$-369
Cash flow
-4.9%
Cash-on-Cash Return
4.6%
Cap rate
0.8%
Rent to Value Ratio
Active
$299,900
3
bds
|
2
ba
|
2,412
sqft
|
built
1954
89 Rockwell St, Norwich, CT 06360
$-235
Cash flow
-4.1%
Cash-on-Cash Return
4.7%
Cap rate
0.9%
Rent to Value Ratio
Active
$260,000
9
bds
|
3
ba
|
2,416
sqft
|
built
1910
220 Franklin St, Norwich, CT 06360
$-596
Cash flow
-12.0%
Cash-on-Cash Return
2.9%
Cap rate
0.8%
Rent to Value Ratio
Active
$247,922
3
bds
|
1
ba
|
744
sqft
|
built
1950
214 W Thames St, Norwich, CT 06360
$-279
Cash flow
-5.9%
Cash-on-Cash Return
4.3%
Cap rate
0.7%
Rent to Value Ratio
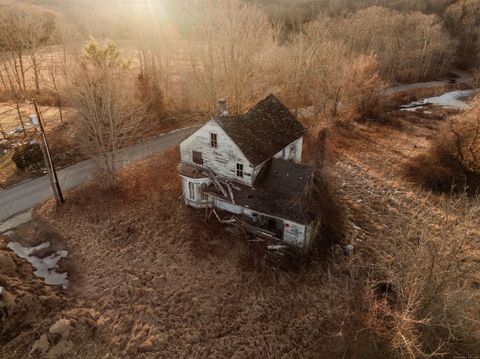
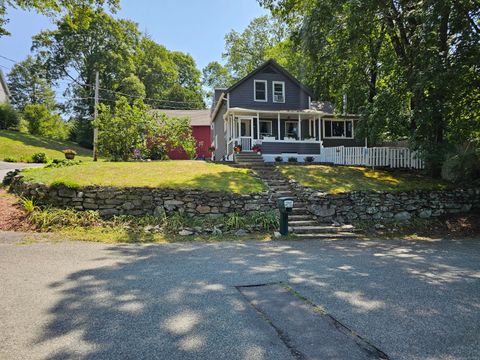
Active
$700,000
5
bds
|
1
ba
|
2,058
sqft
|
built
1840
215 Wawecus Hill Rd, Norwich, CT 06360
$-1,904
Cash flow
-14.2%
Cash-on-Cash Return
2.4%
Cap rate
0.4%
Rent to Value Ratio
Active
$305,000
3
bds
|
1
ba
|
1,066
sqft
|
built
1956
234 Vergason Ave, Norwich, CT 06360
$-348
Cash flow
-6.0%
Cash-on-Cash Return
4.3%
Cap rate
0.7%
Rent to Value Ratio
Active
$249,000
4
bds
|
2
ba
|
1,512
sqft
|
built
1910
89 Hickory St, Norwich, CT 06360
$-314
Cash flow
-6.6%
Cash-on-Cash Return
4.2%
Cap rate
0.8%
Rent to Value Ratio
Active
$595,000
8
bds
|
4
ba
|
5,362
sqft
|
built
1860
221 Broadway, Norwich, CT 06360
$-2,789
Cash flow
-24.5%
Cash-on-Cash Return
0.1%
Cap rate
0.3%
Rent to Value Ratio
Active
$379,900
3
bds
|
1
ba
|
1,092
sqft
|
built
1964
138 Newton St, Norwich, CT 06360
$-843
Cash flow
-11.6%
Cash-on-Cash Return
3.0%
Cap rate
0.5%
Rent to Value Ratio
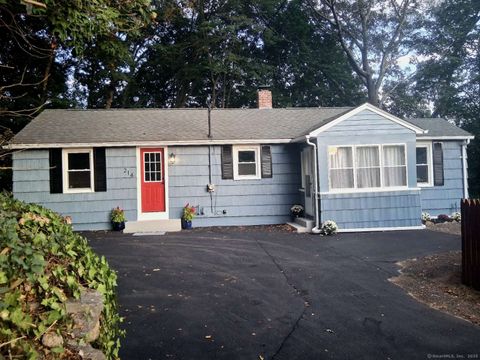
Active
$290,000
3
bds
|
1
ba
|
1,161
sqft
|
built
1955
328 Canterbury Tpke, Norwich, CT 06360
$-174
Cash flow
-3.1%
Cash-on-Cash Return
5.0%
Cap rate
0.8%
Rent to Value Ratio
Active
$220,000
2
bds
|
2
ba
|
1,379
sqft
|
built
1989
68 Thermos Ave, Norwich, CT 06360
$-731
Cash flow
-17.3%
Cash-on-Cash Return
1.7%
Cap rate
0.9%
Rent to Value Ratio
Active
$349,900
3
bds
|
2
ba
|
1,924
sqft
|
built
1870
26 Monroe St, Norwich, CT 06360
$-729
Cash flow
-10.9%
Cash-on-Cash Return
3.2%
Cap rate
0.6%
Rent to Value Ratio
Active
$294,900
3
bds
|
1
ba
|
1,536
sqft
|
built
1911
276 Boswell Ave, Norwich, CT 06360
$-371
Cash flow
-6.6%
Cash-on-Cash Return
4.2%
Cap rate
0.7%
Rent to Value Ratio
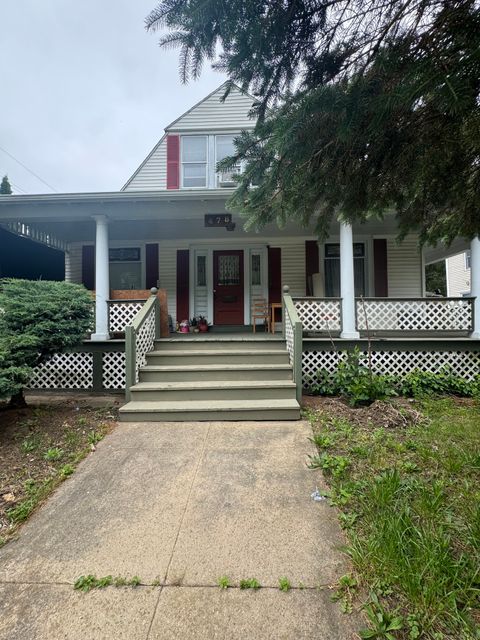
Active
$325,000
4
bds
|
2
ba
|
1,958
sqft
|
built
1920
478 E Main St, Norwich, CT 06360
$-365
Cash flow
-5.9%
Cash-on-Cash Return
4.3%
Cap rate
0.8%
Rent to Value Ratio
Active
$335,000
5
bds
|
2
ba
|
1,841
sqft
|
built
1865
57 Boswell Ave, Norwich, CT 06360
$-734
Cash flow
-11.4%
Cash-on-Cash Return
3.0%
Cap rate
0.5%
Rent to Value Ratio
Active
$269,900
3
bds
|
2
ba
|
1,592
sqft
|
built
1870
176 Laurel Hill Ave, Norwich, CT 06360
$-101
Cash flow
-2.0%
Cash-on-Cash Return
5.2%
Cap rate
1.0%
Rent to Value Ratio
Active
$249,900
4
bds
|
2
ba
|
1,857
sqft
|
built
1840
445 E Main St, Norwich, CT 06360
$-408
Cash flow
-8.5%
Cash-on-Cash Return
3.7%
Cap rate
0.7%
Rent to Value Ratio
Active
$389,900
3
bds
|
3
ba
|
1,894
sqft
|
built
1989
9 Elwood Ln, Norwich, CT 06360
$-453
Cash flow
-6.1%
Cash-on-Cash Return
4.3%
Cap rate
0.7%
Rent to Value Ratio
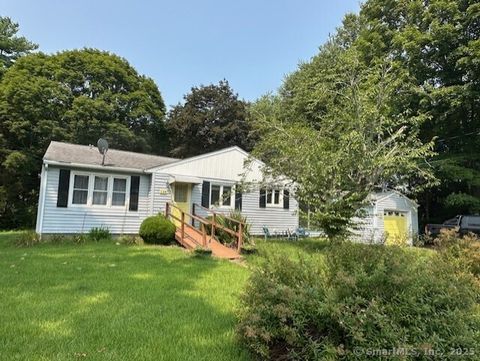
Active
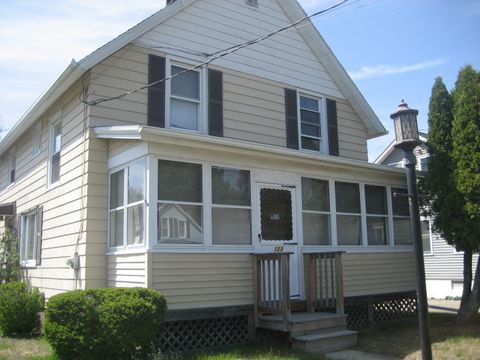
$209,500
3
bds
|
1
ba
|
1,210
sqft
|
built
1890
123 Taftville Occum Rd, Norwich, CT 06360
$154
Cash flow
3.8%
Cash-on-Cash Return
6.6%
Cap rate
1.1%
Rent to Value Ratio
Active
$379,000
5
bds
|
2
ba
|
1,861
sqft
|
built
1850
24 Central Ave, Norwich, CT 06360
$-943
Cash flow
-13.0%
Cash-on-Cash Return
2.7%
Cap rate
0.5%
Rent to Value Ratio
Active
$389,000
3
bds
|
3
ba
|
2,016
sqft
|
built
1921
6 Julian Ter, Norwich, CT 06360
$-498
Cash flow
-6.7%
Cash-on-Cash Return
4.1%
Cap rate
0.7%
Rent to Value Ratio