11561 Investment Properties for Sale
Browse homes for sale and investment properties in 11561. Refine your search by price, property type, or more.
Best cash flowing properties in 11561
Active
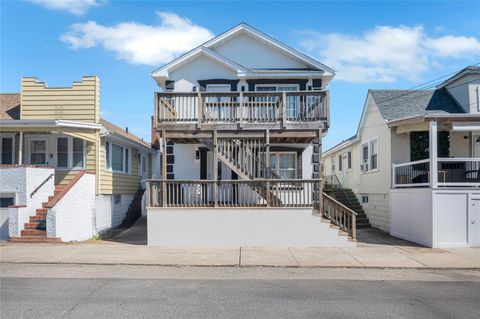
$450,000
1
bds
|
1
ba
|
700
sqft
|
built
1973
650 Shore Rd, Long Beach, NY 11561
$-1,312
Cash flow
-15.2%
Cash-on-Cash Return
2.6%
Cap rate
0.5%
Rent to Value Ratio
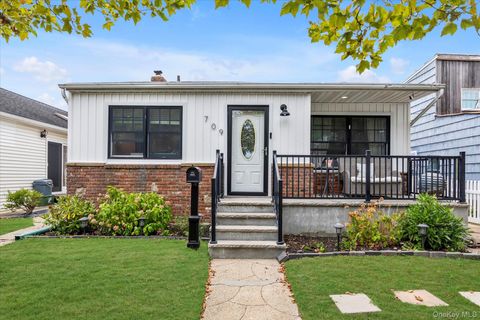
Active
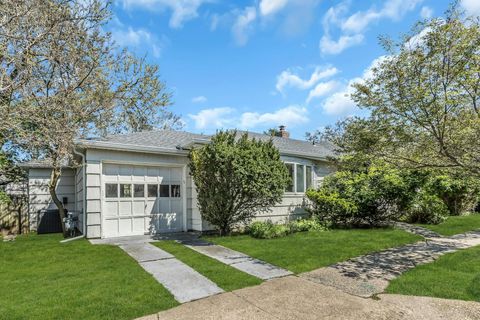
$789,000
3
bds
|
2
ba
|
1,734
sqft
|
built
1955
709 Monroe Blvd, Long Beach, NY 11561
$-1,943
Cash flow
-12.8%
Cash-on-Cash Return
3.1%
Cap rate
0.6%
Rent to Value Ratio
62 out of 87 properties for sale in 11561
Limited Results Shown
Create a free account, or log in to reveal all property listings and enjoy the complete experience.
Active
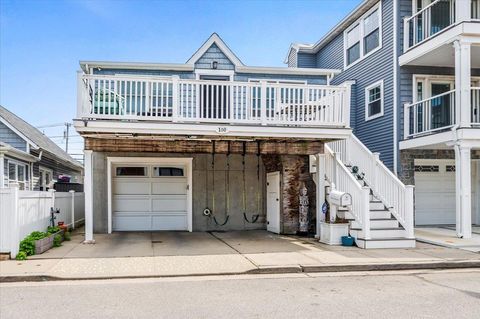
$1,598,000
4
bds
|
3
ba
|
0
sqft
|
built
2016
59 Delaware Ave, Long Beach, NY 11561
$-4,807
Cash flow
-15.7%
Cash-on-Cash Return
2.5%
Cap rate
0.4%
Rent to Value Ratio
Active
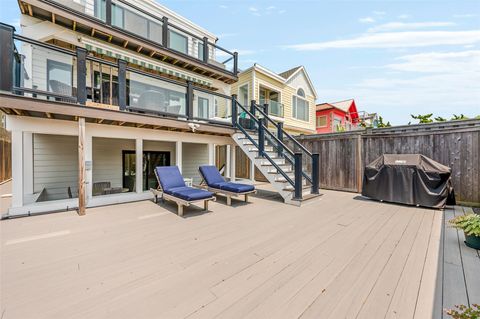
$1,450,000
4
bds
|
2
ba
|
1,900
sqft
|
built
1974
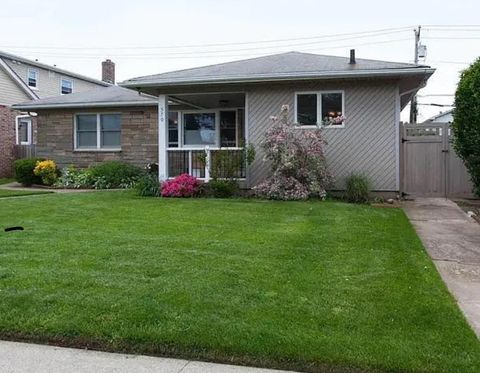
221 Washington Blvd, Long Beach, NY 11561
$-4,783
Cash flow
-17.2%
Cash-on-Cash Return
2.1%
Cap rate
0.4%
Rent to Value Ratio
Active
$599,000
2
bds
|
2
ba
|
1,900
sqft
|
built
1965
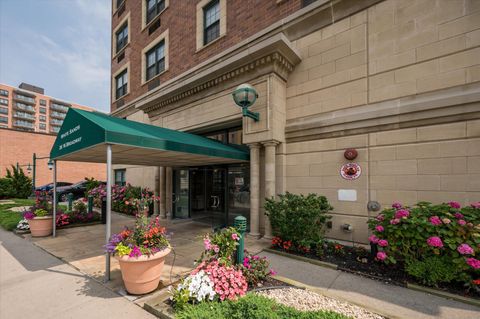
25 W Broadway, Long Beach, NY 11561
$-2,761
Cash flow
-24.0%
Cash-on-Cash Return
0.5%
Cap rate
0.5%
Rent to Value Ratio
Active
$1,298,000
6
bds
|
4
ba
|
0
sqft
|
built
1996
318 E Olive St, Long Beach, NY 11561
$-5,386
Cash flow
-21.6%
Cash-on-Cash Return
1.1%
Cap rate
0.3%
Rent to Value Ratio
Active
$1,449,000
4
bds
|
3
ba
|
2,000
sqft
|
built
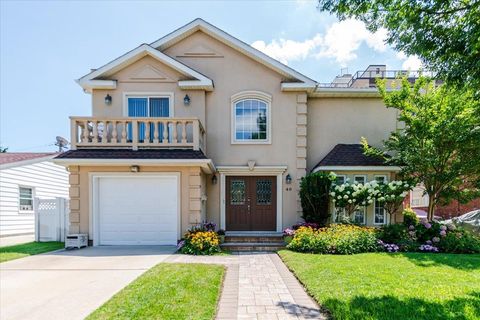
1977
500 W Penn St, Long Beach, NY 11561
$-5,270
Cash flow
-19.0%
Cash-on-Cash Return
1.7%
Cap rate
0.3%
Rent to Value Ratio
Active
$949,000
2
bds
|
1
ba
|
1,500
sqft
|
built
1932
87 Mohawk Ave, East Atlantic Beach, NY 11561
$-2,867
Cash flow
-15.8%
Cash-on-Cash Return
2.4%
Cap rate
0.4%
Rent to Value Ratio
Active
$795,000
3
bds
|
2
ba
|
1,215
sqft
|
built
1940
340 E Pine St, Long Beach, NY 11561
$-2,853
Cash flow
-18.7%
Cash-on-Cash Return
1.8%
Cap rate
0.4%
Rent to Value Ratio
Active
$1,298,000
4
bds
|
4
ba
|
2,651
sqft
|
built
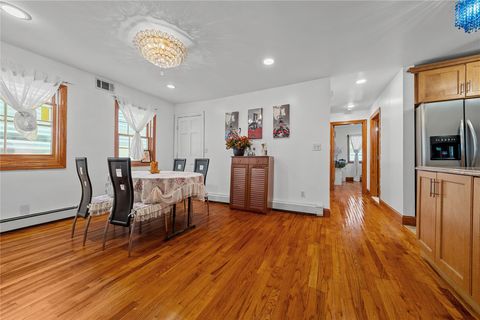
1954
164 Blackheath Rd, Lido Beach, NY 11561
$-5,344
Cash flow
-21.5%
Cash-on-Cash Return
1.1%
Cap rate
0.2%
Rent to Value Ratio
Active
$1,550,000
2
bds
|
2
ba
|
1,700
sqft
|
built
2005
26 W Broadway, Long Beach, NY 11561
$-7,176
Cash flow
-24.2%
Cash-on-Cash Return
0.5%
Cap rate
0.3%
Rent to Value Ratio
Active
$849,000
4
bds
|
2
ba
|
1,670
sqft
|
built
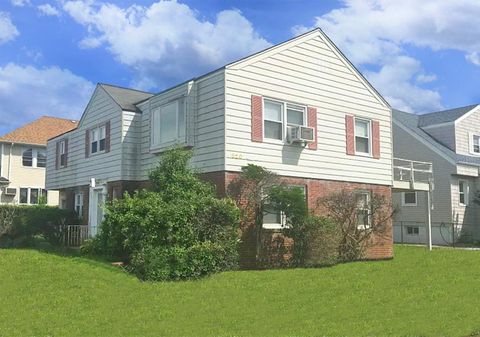
1925
49 Barnes St, Long Beach, NY 11561
$-3,117
Cash flow
-19.2%
Cash-on-Cash Return
1.7%
Cap rate
0.4%
Rent to Value Ratio
Active
$1,200,000
4
bds
|
3
ba
|
3,000
sqft
|
built
2002
227 W Pine St, Long Beach, NY 11561
$-4,049
Cash flow
-17.6%
Cash-on-Cash Return
2.0%
Cap rate
0.4%
Rent to Value Ratio
Active
$875,000
4
bds
|
2
ba
|
1,480
sqft
|
built
1930
7 Vinton St, Long Beach, NY 11561
$-3,051
Cash flow
-18.2%
Cash-on-Cash Return
1.9%
Cap rate
0.4%
Rent to Value Ratio
Active
$949,000
3
bds
|
1
ba
|
1,174
sqft
|
built
1918
101 California St, Long Beach, NY 11561
$-3,637
Cash flow
-20.0%
Cash-on-Cash Return
1.5%
Cap rate
0.3%
Rent to Value Ratio
Active
$1,299,000
4
bds
|
3
ba
|
2,500
sqft
|
built
1934
62 Clark St, Long Beach, NY 11561
$-4,054
Cash flow
-16.3%
Cash-on-Cash Return
2.3%
Cap rate
0.4%
Rent to Value Ratio
Active
$875,000
3
bds
|
2
ba
|
0
sqft
|
built
1954
570 E Chester St, Long Beach, NY 11561
$-3,295
Cash flow
-19.6%
Cash-on-Cash Return
1.5%
Cap rate
0.4%
Rent to Value Ratio
Active
$1,449,000
5
bds
|
3
ba
|
3,590
sqft
|
built
1999
40 E Penn St, Long Beach, NY 11561
$-6,890
Cash flow
-24.8%
Cash-on-Cash Return
0.4%
Cap rate
0.2%
Rent to Value Ratio
Active
$1,060,000
6
bds
|
4
ba
|
0
sqft
|
built
2006
84 Nebraska St, Long Beach, NY 11561
$-4,439
Cash flow
-21.8%
Cash-on-Cash Return
1.0%
Cap rate
0.3%
Rent to Value Ratio
Active
$789,000
bds
|
0
ba
|
0
sqft
|
built
1975
520 Lafayette Blvd, Long Beach, NY 11561
$-3,642
Cash flow
-24.1%
Cash-on-Cash Return
0.5%
Cap rate
0.3%
Rent to Value Ratio
Active
$1,972,000
4
bds
|
3
ba
|
1,942
sqft
|
built
1930
103 Connecticut Ave, Long Beach, NY 11561
$-9,213
Cash flow
-24.4%
Cash-on-Cash Return
0.5%
Cap rate
0.2%
Rent to Value Ratio
Active
$2,599,999
5
bds
|
5
ba
|
4,449
sqft
|
built
1938
450 W Bay Dr, Long Beach, NY 11561
$-8,219
Cash flow
-16.5%
Cash-on-Cash Return
2.3%
Cap rate
0.4%
Rent to Value Ratio
Active
$1,699,000
6
bds
|
3
ba
|
3,544
sqft
|
built
1997
230 W Beech St, Long Beach, NY 11561
$-4,747
Cash flow
-14.6%
Cash-on-Cash Return
2.7%
Cap rate
0.5%
Rent to Value Ratio
Active
$999,000
5
bds
|
3
ba
|
0
sqft
|
built
1955
345 E Park Ave, Long Beach, NY 11561
$-4,996
Cash flow
-26.1%
Cash-on-Cash Return
0.1%
Cap rate
0.2%
Rent to Value Ratio
Active
$1,150,000
5
bds
|
4
ba
|
2,445
sqft
|
built
1928
151 E Olive St, Long Beach, NY 11561
$-4,644
Cash flow
-21.1%
Cash-on-Cash Return
1.2%
Cap rate
0.3%
Rent to Value Ratio
Active
$1,565,000
4
bds
|
3
ba
|
2,640
sqft
|
built
2017
545 E Fulton St, Long Beach, NY 11561
$-4,653
Cash flow
-15.5%
Cash-on-Cash Return
2.5%
Cap rate
0.4%
Rent to Value Ratio
Active
$3,200,000
3
bds
|
4
ba
|
2,500
sqft
|
built
2010
403 E Boardwalk, Long Beach, NY 11561
$-19,221
Cash flow
-31.3%
Cash-on-Cash Return
-1.1%
Cap rate
0.1%
Rent to Value Ratio
Active
$1,399,000
4
bds
|
4
ba
|
2,602
sqft
|
built
1956
189 Blackheath Rd, Lido Beach, NY 11561
$-5,310
Cash flow
-19.8%
Cash-on-Cash Return
1.5%
Cap rate
0.3%
Rent to Value Ratio
Active
$1,600,000
3
bds
|
2
ba
|
1,800
sqft
|
built
2005
26 W Broadway, Long Beach, NY 11561
$-5,061
Cash flow
-16.5%
Cash-on-Cash Return
2.3%
Cap rate
0.5%
Rent to Value Ratio
Active
$1,175,000
4
bds
|
3
ba
|
0
sqft
|
built
1956
106 Maple Blvd, Long Beach, NY 11561
$-5,093
Cash flow
-22.6%
Cash-on-Cash Return
0.9%
Cap rate
0.3%
Rent to Value Ratio
Active
$899,000
2
bds
|
2
ba
|
1,200
sqft
|
built
2007
260 W Broadway, Long Beach, NY 11561
$-3,463
Cash flow
-20.1%
Cash-on-Cash Return
1.4%
Cap rate
0.4%
Rent to Value Ratio
Active
$999,000
5
bds
|
3
ba
|
2,800
sqft
|
built
1971
23 Vinton St, Long Beach, NY 11561
$-3,489
Cash flow
-18.2%
Cash-on-Cash Return
1.9%
Cap rate
0.4%
Rent to Value Ratio
Active
$1,150,000
3
bds
|
3
ba
|
2,448
sqft
|
built
2015
360 E Hudson St, Long Beach, NY 11561
$-3,893
Cash flow
-17.7%
Cash-on-Cash Return
2.0%
Cap rate
0.4%
Rent to Value Ratio
Active
$1,170,000
4
bds
|
3
ba
|
2,134
sqft
|
built
1974
1 Saratoga St, Lido Beach, NY 11561
$-4,054
Cash flow
-18.1%
Cash-on-Cash Return
1.9%
Cap rate
0.4%
Rent to Value Ratio
Active
$1,399,000
3
bds
|
2
ba
|
1,691
sqft
|
built
1920
991 W Park Ave, Long Beach, NY 11561
$-6,413
Cash flow
-23.9%
Cash-on-Cash Return
0.6%
Cap rate
0.2%
Rent to Value Ratio
Active
$1,925,000
5
bds
|
5
ba
|
4,800
sqft
|
built
2025
29 Curley St, Long Beach, NY 11561
$-8,737
Cash flow
-23.7%
Cash-on-Cash Return
0.6%
Cap rate
0.1%
Rent to Value Ratio
Active
$1,299,000
4
bds
|
4
ba
|
0
sqft
|
built
2008
68 Nevada Ave, Long Beach, NY 11561
$-5,661
Cash flow
-22.7%
Cash-on-Cash Return
0.8%
Cap rate
0.2%
Rent to Value Ratio
Active
$895,000
3
bds
|
2
ba
|
1,450
sqft
|
built
1951
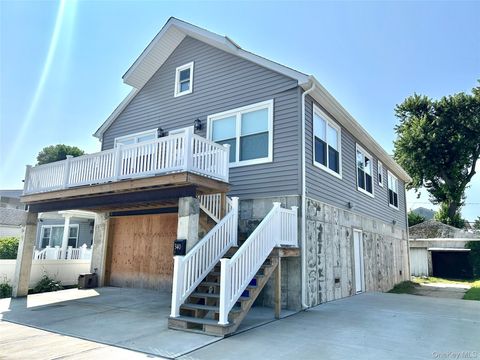
140 Mitchell Ave, Long Beach, NY 11561
$-2,828
Cash flow
-16.5%
Cash-on-Cash Return
2.3%
Cap rate
0.4%
Rent to Value Ratio
Active
$799,000
2
bds
|
1
ba
|
950
sqft
|
built
1921
100 California St, Long Beach, NY 11561
$-2,880
Cash flow
-18.8%
Cash-on-Cash Return
1.7%
Cap rate
0.4%
Rent to Value Ratio
Active
$3,499,000
6
bds
|
4
ba
|
3,410
sqft
|
built
1986
923 Oceanfront, Long Beach, NY 11561
$-12,660
Cash flow
-18.9%
Cash-on-Cash Return
1.7%
Cap rate
0.3%
Rent to Value Ratio