30075 Investment Properties for Sale
Browse homes for sale and investment properties in 30075. Refine your search by price, property type, or more.
Best cash flowing properties in 30075
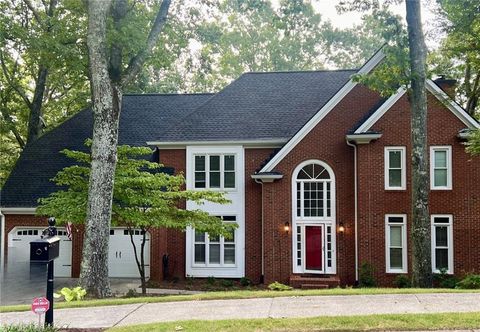
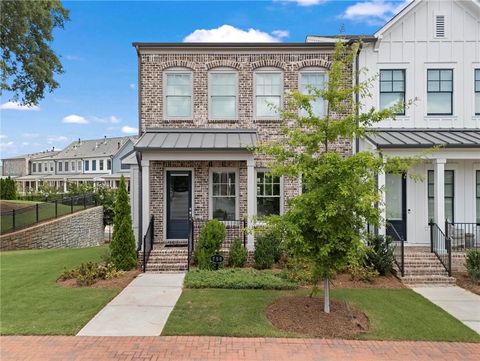
Active
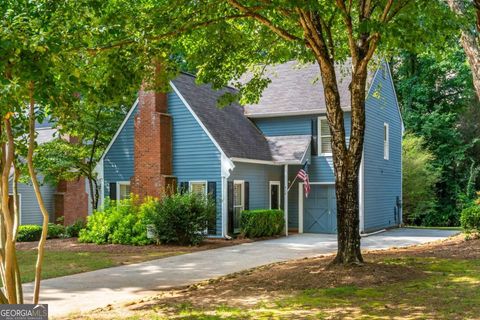
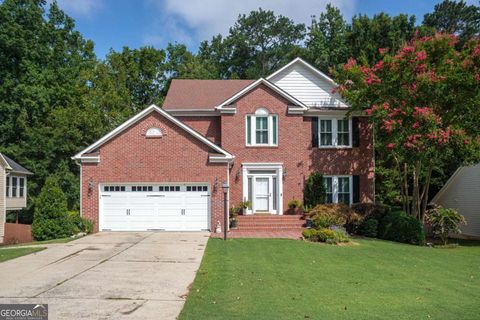
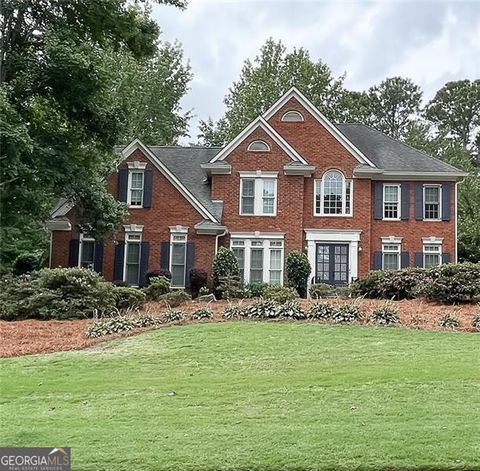
$420,000
3
bds
|
3
ba
|
1,900
sqft
|
built
2004
3016 Glendower Way, Roswell, GA 30075
$-421
Cash flow
-5.2%
Cash-on-Cash Return
4.9%
Cap rate
0.7%
Rent to Value Ratio
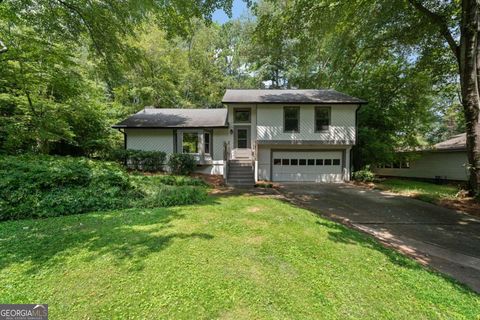
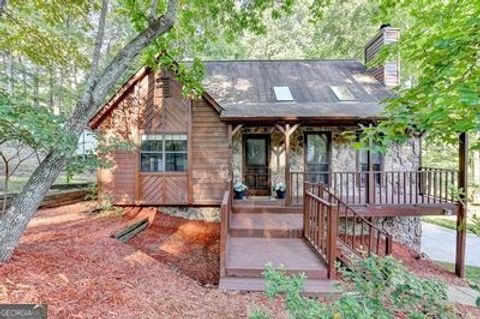
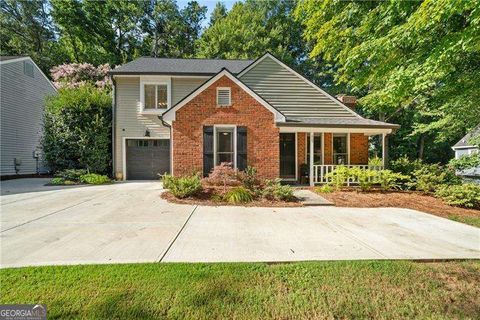
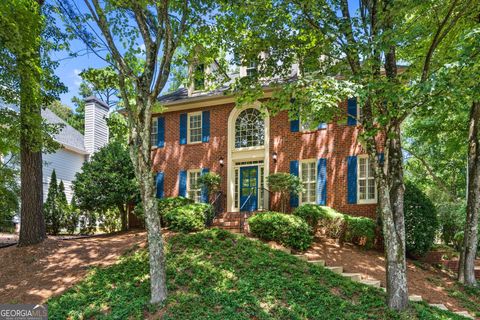
Active
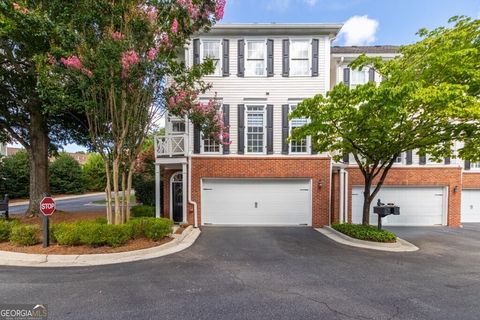
$420,000
3
bds
|
2.5
ba
|
1,708
sqft
|
built
1982
110 Great Oaks Ln, Roswell, GA 30075
$-598
Cash flow
-7.4%
Cash-on-Cash Return
4.4%
Cap rate
0.7%
Rent to Value Ratio
105 out of 124 properties for sale in 30075
Limited Results Shown
Create a free account, or log in to reveal all property listings and enjoy the complete experience.
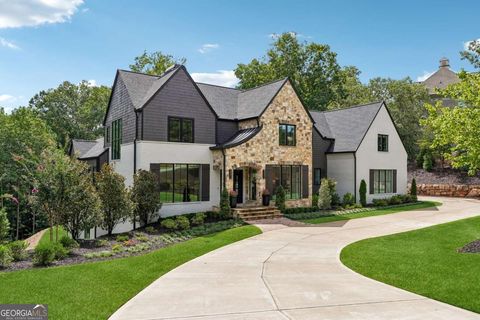
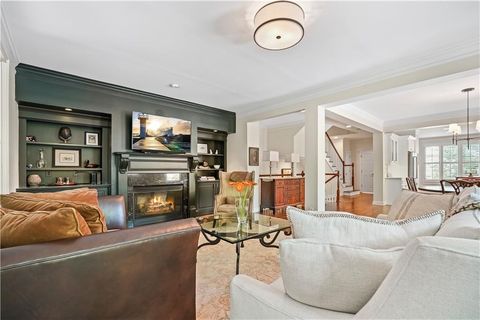
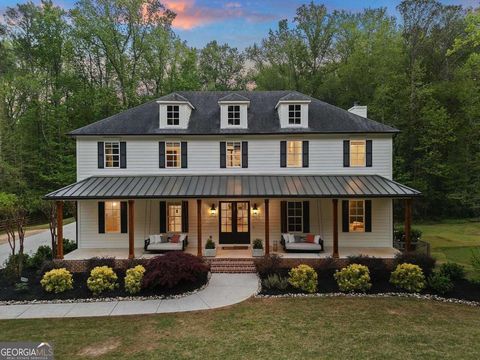
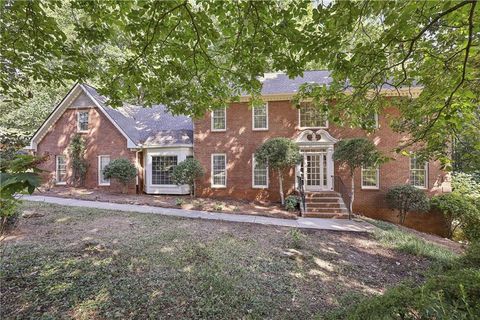
Active
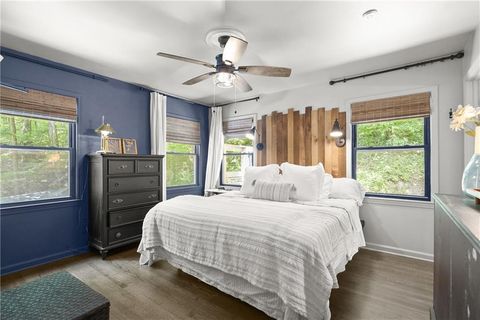
$1,299,000
5
bds
|
5
ba
|
4,089
sqft
|
built
2011
105 Weatherford Pl, Roswell, GA 30075
$-2,398
Cash flow
-9.6%
Cash-on-Cash Return
3.9%
Cap rate
0.5%
Rent to Value Ratio
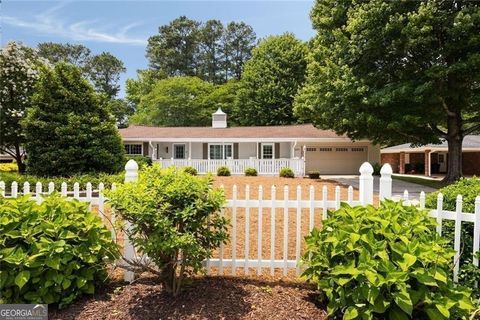
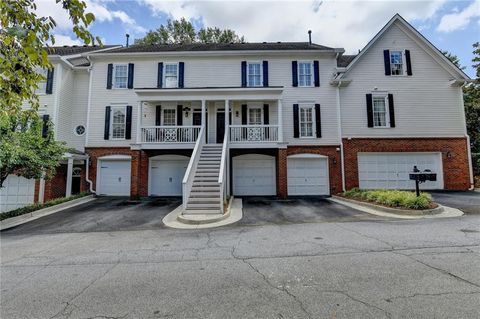
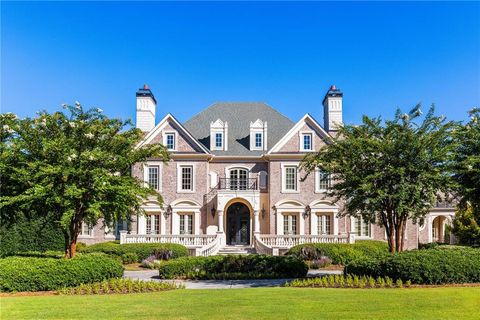
Active
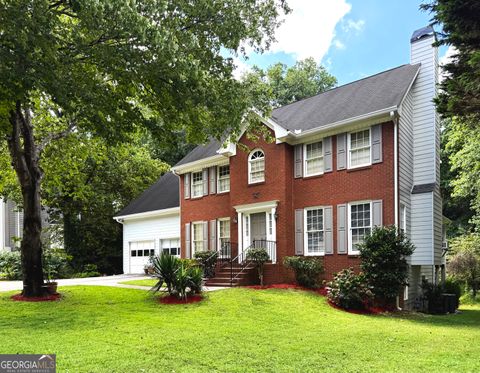
$2,150,000
6
bds
|
7
ba
|
8,700
sqft
|
built
2006
13037 Overlook Pass, Roswell, GA 30075
$-8,635
Cash flow
-21.0%
Cash-on-Cash Return
1.3%
Cap rate
0.2%
Rent to Value Ratio
Active
$1,375,000
6
bds
|
6.5
ba
|
6,499
sqft
|
built
2007
3015 Southmoor Trce, Roswell, GA 30075
$-2,980
Cash flow
-11.3%
Cash-on-Cash Return
3.5%
Cap rate
0.6%
Rent to Value Ratio
Active
$800,000
4
bds
|
3.5
ba
|
3,757
sqft
|
built
2019
3231 Artessa Ln NE, Roswell, GA 30075
$-1,473
Cash flow
-9.6%
Cash-on-Cash Return
3.9%
Cap rate
0.6%
Rent to Value Ratio
Active
$565,000
3
bds
|
3
ba
|
2,354
sqft
|
built
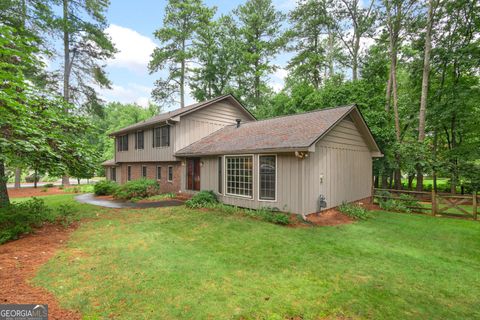
1976
4363 Old Mabry Rd NE, Roswell, GA 30075
$-1,157
Cash flow
-10.7%
Cash-on-Cash Return
3.7%
Cap rate
0.6%
Rent to Value Ratio
Active
$625,000
4
bds
|
2.5
ba
|
0
sqft
|
built
1977
295 Lakemont Dr, Roswell, GA 30075
$-1,000
Cash flow
-8.3%
Cash-on-Cash Return
4.2%
Cap rate
0.6%
Rent to Value Ratio
Active
$425,000
2
bds
|
2.5
ba
|
1,488
sqft
|
built
1984
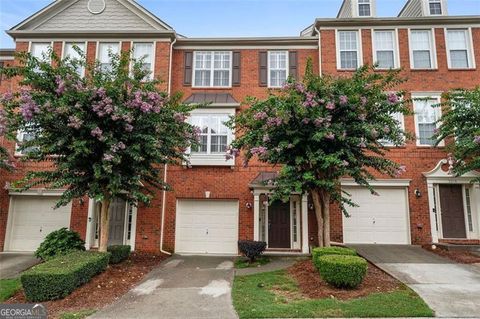
414 Roswell Green Ln, Roswell, GA 30075
$-761
Cash flow
-9.3%
Cash-on-Cash Return
4.0%
Cap rate
0.6%
Rent to Value Ratio
Active
$525,000
3
bds
|
2
ba
|
1,580
sqft
|
built
1978
9795 Loblolly Ln, Roswell, GA 30075
$-1,065
Cash flow
-10.6%
Cash-on-Cash Return
3.7%
Cap rate
0.5%
Rent to Value Ratio
Active
$2,489,500
5
bds
|
5.5
ba
|
5,858
sqft
|
built
2023
1260 Cashiers Way, Roswell, GA 30075
$-7,665
Cash flow
-16.1%
Cash-on-Cash Return
2.5%
Cap rate
0.4%
Rent to Value Ratio
Active
$625,000
3
bds
|
2
ba
|
2,413
sqft
|
built
1973
1100 Tuxedo Dr, Roswell, GA 30075
$-1,104
Cash flow
-9.2%
Cash-on-Cash Return
4.0%
Cap rate
0.5%
Rent to Value Ratio
Active
$725,000
4
bds
|
3
ba
|
2,964
sqft
|
built
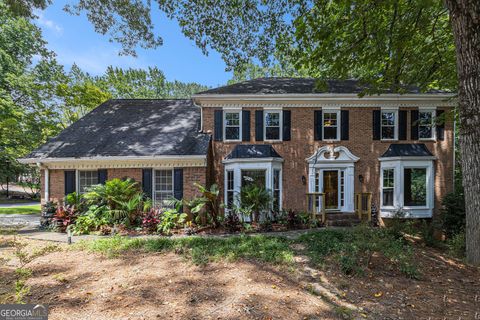
1969
370 Stonebridge Trl, Roswell, GA 30075
$-1,931
Cash flow
-13.9%
Cash-on-Cash Return
3.0%
Cap rate
0.4%
Rent to Value Ratio
Active
$760,000
3
bds
|
3.5
ba
|
4,408
sqft
|
built
1991
300 Shelli Ln, Roswell, GA 30075
$-2,122
Cash flow
-14.6%
Cash-on-Cash Return
2.8%
Cap rate
0.5%
Rent to Value Ratio
Active
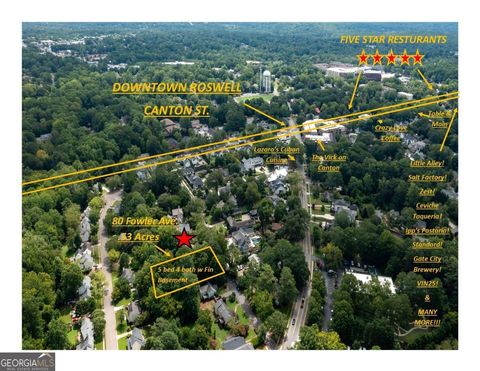
$1,299,000
5
bds
|
4.5
ba
|
3,665
sqft
|
built
2001
80 Fowler Ave, Roswell, GA 30075
$-3,618
Cash flow
-14.5%
Cash-on-Cash Return
2.8%
Cap rate
0.4%
Rent to Value Ratio
Active
$630,000
4
bds
|
3.5
ba
|
3,159
sqft
|
built
2005
5210 Davenport Pl, Roswell, GA 30075
$-1,745
Cash flow
-14.5%
Cash-on-Cash Return
2.8%
Cap rate
0.6%
Rent to Value Ratio
Active
$849,900
5
bds
|
5
ba
|
4,945
sqft
|
built
1987
715 Winterwind Way, Roswell, GA 30075
$-2,139
Cash flow
-13.1%
Cash-on-Cash Return
3.1%
Cap rate
0.5%
Rent to Value Ratio
Active
$434,900
3
bds
|
2
ba
|
2,372
sqft
|
built
1986
4929 Keota Run NE, Roswell, GA 30075
$-766
Cash flow
-9.2%
Cash-on-Cash Return
4.0%
Cap rate
0.6%
Rent to Value Ratio
Active
$740,000
4
bds
|
4
ba
|
2,994
sqft
|
built
2004
4201 Village Green Dr, Roswell, GA 30075
$-2,303
Cash flow
-16.2%
Cash-on-Cash Return
2.4%
Cap rate
0.5%
Rent to Value Ratio
Active
$515,000
3
bds
|
3
ba
|
0
sqft
|
built
2000
160 Neel Reid Dr, Roswell, GA 30075
$-1,326
Cash flow
-13.4%
Cash-on-Cash Return
3.1%
Cap rate
0.5%
Rent to Value Ratio
Active
$599,900
4
bds
|
2.5
ba
|
2,310
sqft
|
built
1976
11625 Northgate Way, Roswell, GA 30075
$-713
Cash flow
-6.2%
Cash-on-Cash Return
4.7%
Cap rate
0.6%
Rent to Value Ratio
Active
$699,900
6
bds
|
3.5
ba
|
4,200
sqft
|
built
1983
3402 Johnson Ferry Rd NE, Roswell, GA 30075
$-1,529
Cash flow
-11.4%
Cash-on-Cash Return
3.5%
Cap rate
0.6%
Rent to Value Ratio
Active
$910,000
3
bds
|
3.5
ba
|
0
sqft
|
built
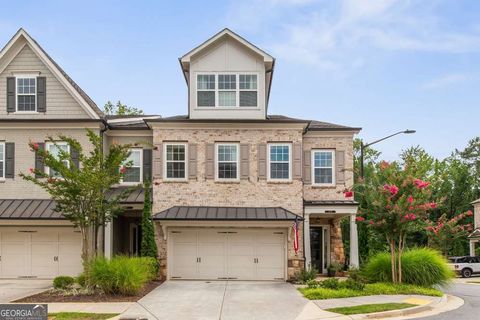
2018
4448 Huffman Dr NE, Roswell, GA 30075
$-2,083
Cash flow
-11.9%
Cash-on-Cash Return
3.4%
Cap rate
0.6%
Rent to Value Ratio
Active
$885,000
4
bds
|
3.5
ba
|
3,210
sqft
|
built
1980
195 Thistlewood Ln, Roswell, GA 30075
$-1,130
Cash flow
-6.7%
Cash-on-Cash Return
4.6%
Cap rate
0.6%
Rent to Value Ratio
Active
$649,000
4
bds
|
4
ba
|
3,118
sqft
|
built
2004
2125 Constitution Ct, Roswell, GA 30075
$-1,794
Cash flow
-14.4%
Cash-on-Cash Return
2.8%
Cap rate
0.6%
Rent to Value Ratio
Active
$1,765,000
6
bds
|
5
ba
|
5,975
sqft
|
built
1985
1350 Keans Ct, Roswell, GA 30075
$-6,362
Cash flow
-18.8%
Cash-on-Cash Return
1.8%
Cap rate
0.3%
Rent to Value Ratio
Active
$550,000
3
bds
|
2.5
ba
|
0
sqft
|
built
1987
270 Brickleberry Dr, Roswell, GA 30075
$-1,475
Cash flow
-14.0%
Cash-on-Cash Return
2.9%
Cap rate
0.5%
Rent to Value Ratio
Active
$689,000
3
bds
|
4
ba
|
2,747
sqft
|
built
2013
1048 Merrivale Chase, Roswell, GA 30075
$-1,815
Cash flow
-13.7%
Cash-on-Cash Return
3.0%
Cap rate
0.5%
Rent to Value Ratio
Active
$899,000
5
bds
|
3.5
ba
|
2,882
sqft
|
built
1997
5060 Magnolia Walk, Roswell, GA 30075
$-2,469
Cash flow
-14.3%
Cash-on-Cash Return
2.9%
Cap rate
0.4%
Rent to Value Ratio
Active
$3,800,000
6
bds
|
10
ba
|
0
sqft
|
built
2005
4000 Heatherwood Way, Roswell, GA 30075
$-16,971
Cash flow
-23.3%
Cash-on-Cash Return
0.8%
Cap rate
0.2%
Rent to Value Ratio
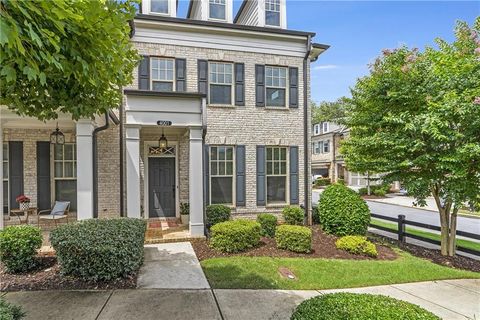
Active
$469,000
2
bds
|
2.5
ba
|
1,709
sqft
|
built
1984
409 Roswell Green Ln, Roswell, GA 30075
$-760
Cash flow
-8.5%
Cash-on-Cash Return
4.2%
Cap rate
0.6%
Rent to Value Ratio
Active
$2,500,000
7
bds
|
7
ba
|
7,004
sqft
|
built
2014
650 Jones Rd, Roswell, GA 30075
$-7,675
Cash flow
-16.0%
Cash-on-Cash Return
2.5%
Cap rate
0.3%
Rent to Value Ratio
Active
$910,000
5
bds
|
4.5
ba
|
4,608
sqft
|
built
1993
710 Devon Hill Ct, Roswell, GA 30075
$-767
Cash flow
-4.4%
Cash-on-Cash Return
5.1%
Cap rate
0.7%
Rent to Value Ratio
Active
$535,000
3
bds
|
2.5
ba
|
1,896
sqft
|
built
2000
310 Neel Reid Dr, Roswell, GA 30075
$-1,312
Cash flow
-12.8%
Cash-on-Cash Return
3.2%
Cap rate
0.6%
Rent to Value Ratio
Active
$650,000
4
bds
|
3
ba
|
2,316
sqft
|
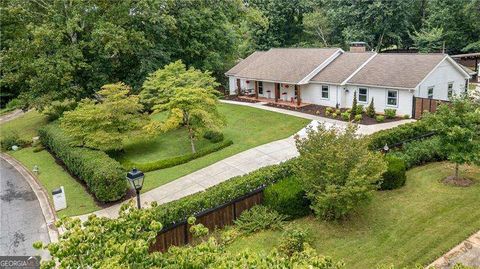
built
1961
190 Azalea Dr, Roswell, GA 30075
$-1,873
Cash flow
-15.0%
Cash-on-Cash Return
2.7%
Cap rate
0.5%
Rent to Value Ratio
Active
$729,000
4
bds
|
2.5
ba
|
3,508
sqft
|
built
1989
300 Farm Trak, Roswell, GA 30075
$-2,077
Cash flow
-14.9%
Cash-on-Cash Return
2.7%
Cap rate
0.4%
Rent to Value Ratio
Active
$795,000
3
bds
|
4
ba
|
0
sqft
|
built
2022
750 Elmwood Way, Roswell, GA 30075
$-1,397
Cash flow
-9.2%
Cash-on-Cash Return
4.0%
Cap rate
0.6%
Rent to Value Ratio
Active
$699,900
4
bds
|
2.5
ba
|
3,402
sqft
|
built
1990
4506 Westcliff Trce NE, Roswell, GA 30075
$-1,291
Cash flow
-9.6%
Cash-on-Cash Return
3.9%
Cap rate
0.5%
Rent to Value Ratio
Active
$850,000
7
bds
|
5
ba
|
5,561
sqft
|
built
1980
11665 Mountain Laurel Dr, Roswell, GA 30075
$-1,712
Cash flow
-10.5%
Cash-on-Cash Return
3.7%
Cap rate
0.5%
Rent to Value Ratio
Active
$600,000
3
bds
|
4
ba
|
0
sqft
|
built
2017
4001 Vickery Gln, Roswell, GA 30075
$-1,247
Cash flow
-10.8%
Cash-on-Cash Return
3.7%
Cap rate
0.6%
Rent to Value Ratio