32176 Investment Properties for Sale
Browse homes for sale and investment properties in 32176. Refine your search by price, property type, or more.
Best cash flowing properties in 32176
Active
$263,000
2
bds
|
2
ba
|
925
sqft
|
built
1986
2700 Ocean Shore Blvd, Ormond Beach, FL 32176
$-59
Cash flow
-1.2%
Cash-on-Cash Return
5.9%
Cap rate
0.9%
Rent to Value Ratio
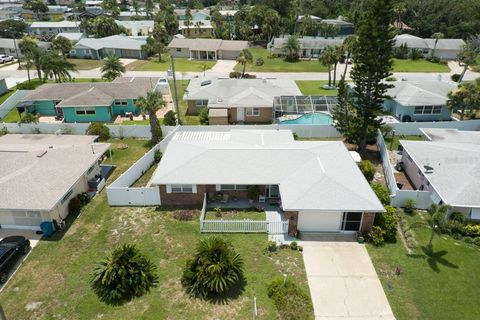
Active
$355,000
2
bds
|
2
ba
|
1,394
sqft
|
built
1971
42 Kathy Dr, Ormond Beach, FL 32176
$-192
Cash flow
-2.8%
Cash-on-Cash Return
5.5%
Cap rate
0.7%
Rent to Value Ratio
64 out of 89 properties for sale in 32176
Limited Results Shown
Create a free account, or log in to reveal all property listings and enjoy the complete experience.
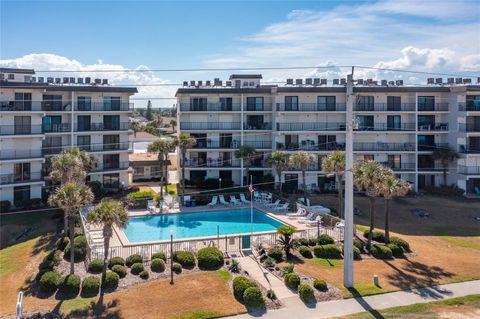
Active
$509,000
2
bds
|
2
ba
|
1,634
sqft
|
built
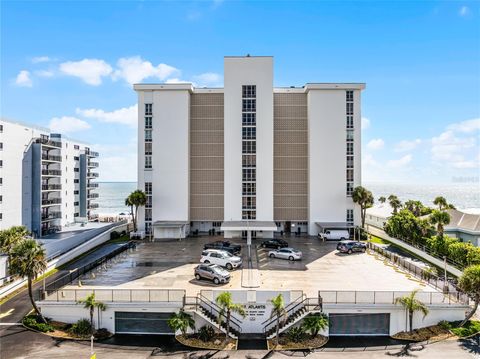
1982
395 S Atlantic Ave, Ormond Beach, FL 32176
$-2,108
Cash flow
-21.6%
Cash-on-Cash Return
1.2%
Cap rate
0.5%
Rent to Value Ratio
Active
$549,000
4
bds
|
3
ba
|
1,890
sqft
|
built
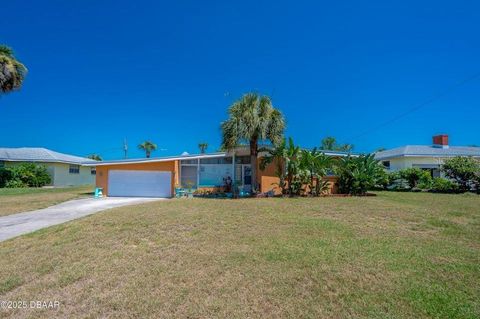
1969
39 Surfside Dr, Ormond Beach, FL 32176
$-1,145
Cash flow
-10.9%
Cash-on-Cash Return
3.6%
Cap rate
0.5%
Rent to Value Ratio
Active
$329,000
3
bds
|
2
ba
|
1,146
sqft
|
built
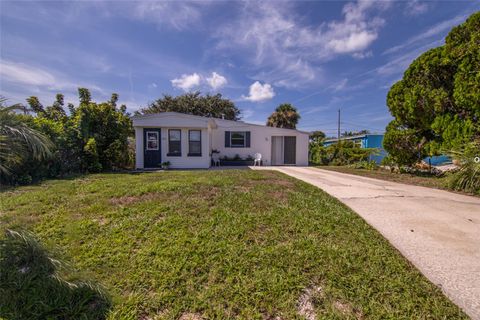
1953
151 Holland Rd, Ormond Beach, FL 32176
$-567
Cash flow
-9.0%
Cash-on-Cash Return
4.1%
Cap rate
0.7%
Rent to Value Ratio
Active
$385,000
2
bds
|
2
ba
|
1,131
sqft
|
built
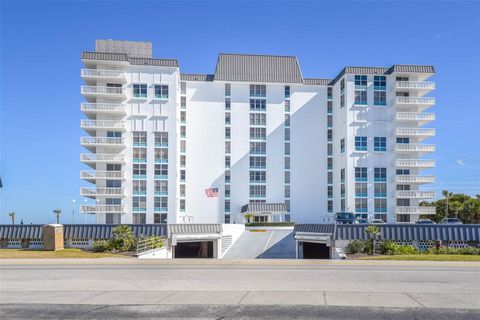
1974
111 S Atlantic Ave, Ormond Beach, FL 32176
$-866
Cash flow
-11.7%
Cash-on-Cash Return
3.4%
Cap rate
0.6%
Rent to Value Ratio
Active
$479,900
2
bds
|
2
ba
|
1,312
sqft
|
built
1974
1575 Ocean Shore Blvd, Ormond Beach, FL 32176
$-2,113
Cash flow
-23.0%
Cash-on-Cash Return
0.9%
Cap rate
0.6%
Rent to Value Ratio
Active
$375,000
3
bds
|
2
ba
|
1,624
sqft
|
built
1958
75 Harvard Dr, Ormond Beach, FL 32176
$-299
Cash flow
-4.2%
Cash-on-Cash Return
5.2%
Cap rate
0.7%
Rent to Value Ratio
Active
$449,000
4
bds
|
3
ba
|
2,020
sqft
|
built
1965
22 Plaza Dr, Ormond Beach, FL 32176
$-1,126
Cash flow
-13.1%
Cash-on-Cash Return
3.1%
Cap rate
0.6%
Rent to Value Ratio
Active
$625,000
4
bds
|
3
ba
|
1,870
sqft
|
built
1963
792 Marvin Rd, Ormond Beach, FL 32176
$-1,920
Cash flow
-16.0%
Cash-on-Cash Return
2.5%
Cap rate
0.4%
Rent to Value Ratio

Active
$350,000
2
bds
|
2
ba
|
1,087
sqft
|
built
1973
2100 Ocean Shore Blvd, Ormond Beach, FL 32176
$-677
Cash flow
-10.1%
Cash-on-Cash Return
3.8%
Cap rate
0.6%
Rent to Value Ratio
Active
$425,000
3
bds
|
4
ba
|
1,611
sqft
|
built
1972
21 Sunset Blvd, Ormond Beach, FL 32176
$-559
Cash flow
-6.9%
Cash-on-Cash Return
4.6%
Cap rate
0.7%
Rent to Value Ratio
Active
$569,900
3
bds
|
2
ba
|
1,631
sqft
|
built
2000
3806 Islamorada Dr, Ormond Beach, FL 32176
$-1,439
Cash flow
-13.2%
Cash-on-Cash Return
3.1%
Cap rate
0.5%
Rent to Value Ratio
Active
$429,000
3
bds
|
2
ba
|
1,492
sqft
|
built
1971
39 Sandra Dr, Ormond Beach, FL 32176
$-968
Cash flow
-11.8%
Cash-on-Cash Return
3.4%
Cap rate
0.6%
Rent to Value Ratio
Active
$239,000
2
bds
|
1
ba
|
837
sqft
|
built
1968
2790 Ocean Shore Blvd, Ormond Beach, FL 32176
$-718
Cash flow
-15.7%
Cash-on-Cash Return
2.5%
Cap rate
0.9%
Rent to Value Ratio

Active
$995,000
4
bds
|
3
ba
|
2,226
sqft
|
built
1980
3558 John Anderson Dr, Ormond Beach, FL 32176
$-3,289
Cash flow
-17.2%
Cash-on-Cash Return
2.2%
Cap rate
0.4%
Rent to Value Ratio

Active
$174,900
2
bds
|
1
ba
|
891
sqft
|
built
1973
1510 Ocean Shore Blvd, Ormond Beach, FL 32176
$-383
Cash flow
-11.4%
Cash-on-Cash Return
3.5%
Cap rate
1.0%
Rent to Value Ratio
Active
$2,950,000
5
bds
|
5
ba
|
3,624
sqft
|
built
1986
339 Ocean Shore Blvd, Ormond Beach, FL 32176
$-13,892
Cash flow
-24.6%
Cash-on-Cash Return
0.5%
Cap rate
0.2%
Rent to Value Ratio

Active
$279,000
2
bds
|
1
ba
|
1,394
sqft
|
built
1956
119 Essex Dr, Ormond Beach, FL 32176
$-530
Cash flow
-9.9%
Cash-on-Cash Return
3.9%
Cap rate
0.6%
Rent to Value Ratio

Active
$695,000
4
bds
|
3
ba
|
2,817
sqft
|
built
1987
55 Plaza Dr, Ormond Beach, FL 32176
$-1,898
Cash flow
-14.2%
Cash-on-Cash Return
2.9%
Cap rate
0.4%
Rent to Value Ratio

Active
$290,000
2
bds
|
1
ba
|
880
sqft
|
built
1957
1 Beechwood Dr, Ormond Beach, FL 32176
$-261
Cash flow
-4.7%
Cash-on-Cash Return
5.1%
Cap rate
0.7%
Rent to Value Ratio
Active
$475,000
2
bds
|
2
ba
|
1,200
sqft
|
built
1982
1051 Ocean Shore Blvd, Ormond Beach, FL 32176
$-794
Cash flow
-8.7%
Cash-on-Cash Return
4.1%
Cap rate
0.7%
Rent to Value Ratio
Active
$399,000
2
bds
|
2
ba
|
1,150
sqft
|
built
1981
2222 Ocean Shore Blvd, Ormond Beach, FL 32176
$-1,277
Cash flow
-16.7%
Cash-on-Cash Return
2.3%
Cap rate
0.5%
Rent to Value Ratio

Active
$799,000
4
bds
|
3
ba
|
3,341
sqft
|
built
1958
105 John Anderson Dr, Ormond Beach, FL 32176
$-1,723
Cash flow
-11.3%
Cash-on-Cash Return
3.6%
Cap rate
0.5%
Rent to Value Ratio

Active
$465,000
2
bds
|
3
ba
|
1,552
sqft
|
built
2003
3000 Ocean Shore Blvd, Ormond Beach, FL 32176
$-2,075
Cash flow
-23.3%
Cash-on-Cash Return
0.8%
Cap rate
0.5%
Rent to Value Ratio
Active
$439,999
2
bds
|
2
ba
|
1,123
sqft
|
built
2020
146 Via Madrid Dr, Ormond Beach, FL 32176
$-922
Cash flow
-10.9%
Cash-on-Cash Return
3.6%
Cap rate
0.6%
Rent to Value Ratio
Active
$485,000
3
bds
|
2
ba
|
2,100
sqft
|
built
1960
39 Benjamin Dr, Ormond Beach, FL 32176
$-1,104
Cash flow
-11.9%
Cash-on-Cash Return
3.4%
Cap rate
0.5%
Rent to Value Ratio
Active
$419,000
2
bds
|
2
ba
|
1,190
sqft
|
built
1961
33 Camellia Dr, Ormond Beach, FL 32176
$-697
Cash flow
-8.7%
Cash-on-Cash Return
4.1%
Cap rate
0.7%
Rent to Value Ratio
Active
$1,195,000
3
bds
|
4
ba
|
3,344
sqft
|
built
1972
915 Ocean Shore Blvd, Ormond Beach, FL 32176
$-5,154
Cash flow
-22.5%
Cash-on-Cash Return
1.0%
Cap rate
0.4%
Rent to Value Ratio
Active
$415,000
2
bds
|
2
ba
|
1,275
sqft
|
built
1983
3360 Ocean Shore Blvd, Ormond Beach, FL 32176
$-1,954
Cash flow
-24.6%
Cash-on-Cash Return
0.5%
Cap rate
0.6%
Rent to Value Ratio
Active
$1,299,000
3
bds
|
2
ba
|
1,715
sqft
|
built
1957
8 Ocean Dunes Dr, Ormond Beach, FL 32176
$-4,930
Cash flow
-19.8%
Cash-on-Cash Return
1.6%
Cap rate
0.2%
Rent to Value Ratio

Active
$1,249,000
3
bds
|
4
ba
|
2,276
sqft
|
built
2022
7 Marden Dr, Ormond Beach, FL 32176
$-3,884
Cash flow
-16.2%
Cash-on-Cash Return
2.4%
Cap rate
0.5%
Rent to Value Ratio

Active
$359,900
2
bds
|
1
ba
|
996
sqft
|
built
1956
31 Seaside Dr, Ormond Beach, FL 32176
$-701
Cash flow
-10.2%
Cash-on-Cash Return
3.8%
Cap rate
0.6%
Rent to Value Ratio
Active
$319,000
2
bds
|
3
ba
|
1,329
sqft
|
built
2001
3000 Ocean Shore Blvd, Ormond Beach, FL 32176
$-522
Cash flow
-8.5%
Cash-on-Cash Return
4.2%
Cap rate
0.7%
Rent to Value Ratio
Active
$299,000
2
bds
|
2
ba
|
1,175
sqft
|
built
1974
1926 Ocean Shore Blvd, Ormond Beach, FL 32176
$-277
Cash flow
-4.8%
Cash-on-Cash Return
5.0%
Cap rate
0.7%
Rent to Value Ratio
Active
$249,000
3
bds
|
2
ba
|
843
sqft
|
built
1951
73 Brooks Dr, Ormond Beach, FL 32176
$-257
Cash flow
-5.4%
Cash-on-Cash Return
4.9%
Cap rate
0.8%
Rent to Value Ratio

Active
$375,000
3
bds
|
2
ba
|
1,282
sqft
|
built
1955
14 Tropical Dr, Ormond Beach, FL 32176
$-882
Cash flow
-12.3%
Cash-on-Cash Return
3.3%
Cap rate
0.6%
Rent to Value Ratio
Active
$394,900
2
bds
|
2
ba
|
1,150
sqft
|
built
1981
2222 Ocean Shore Blvd, Ormond Beach, FL 32176
$-1,661
Cash flow
-21.9%
Cash-on-Cash Return
1.1%
Cap rate
0.5%
Rent to Value Ratio
Active
$329,000
2
bds
|
2
ba
|
1,200
sqft
|
built
1979
89 S Atlantic Ave, Ormond Beach, FL 32176
$-488
Cash flow
-7.7%
Cash-on-Cash Return
4.4%
Cap rate
0.6%
Rent to Value Ratio
Active
$304,900
2
bds
|
1
ba
|
1,214
sqft
|
built
1955
82 Margaret Rd, Ormond Beach, FL 32176
$-366
Cash flow
-6.3%
Cash-on-Cash Return
4.7%
Cap rate
0.8%
Rent to Value Ratio