32179 Investment Properties for Sale
Browse homes for sale and investment properties in 32179. Refine your search by price, property type, or more.
Best cash flowing properties in 32179
Active
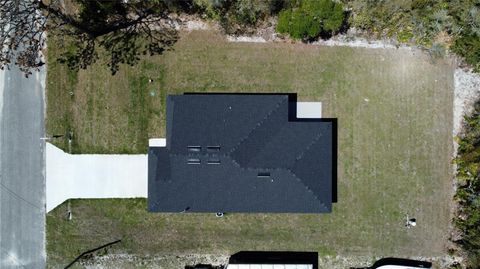
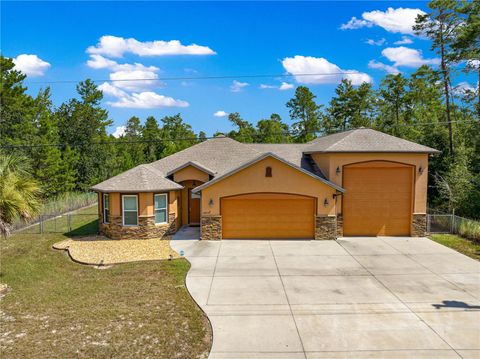
$244,449
3
bds
|
2
ba
|
1,350
sqft
|
built
2024
5 Fisher Loop Ct, Ocklawaha, FL 32179
$-163
Cash flow
-3.5%
Cash-on-Cash Return
5.3%
Cap rate
0.7%
Rent to Value Ratio
Active
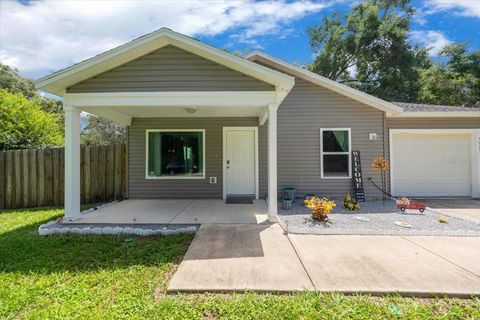
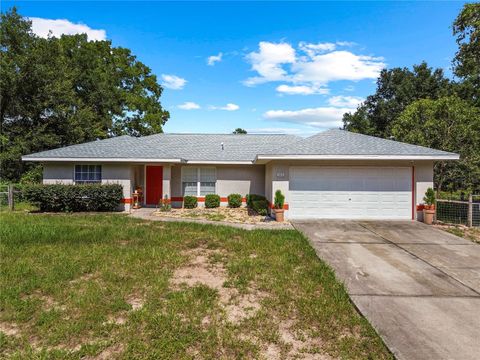
$230,000
3
bds
|
2
ba
|
1,084
sqft
|
built
2021
5515 SE 171st Ct, Ocklawaha, FL 32179
$-249
Cash flow
-5.6%
Cash-on-Cash Return
4.8%
Cap rate
0.7%
Rent to Value Ratio
14 out of 17 properties for sale in 32179
Limited Results Shown
Create a free account, or log in to reveal all property listings and enjoy the complete experience.
Active
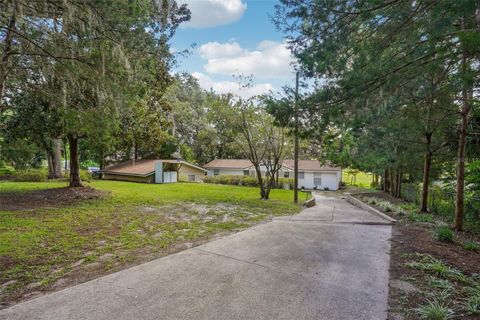
$260,000
2
bds
|
2
ba
|
1,080
sqft
|
built
1974
5989 SE 159th Ct, Ocklawaha, FL 32179
$-268
Cash flow
-5.4%
Cash-on-Cash Return
4.9%
Cap rate
0.7%
Rent to Value Ratio
Active
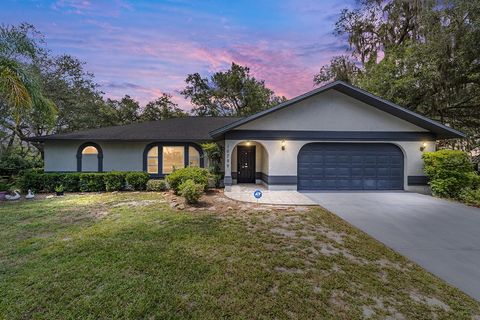
$309,750
3
bds
|
2
ba
|
2,106
sqft
|
built
1990
16789 SE 69th Ln, Ocklawaha, FL 32179
$-395
Cash flow
-6.7%
Cash-on-Cash Return
4.6%
Cap rate
0.7%
Rent to Value Ratio
Active
$494,492
3
bds
|
2
ba
|
2,449
sqft
|
built
2017
3 Bay Ln, Ocklawaha, FL 32179
$-1,068
Cash flow
-11.3%
Cash-on-Cash Return
3.6%
Cap rate
0.6%
Rent to Value Ratio
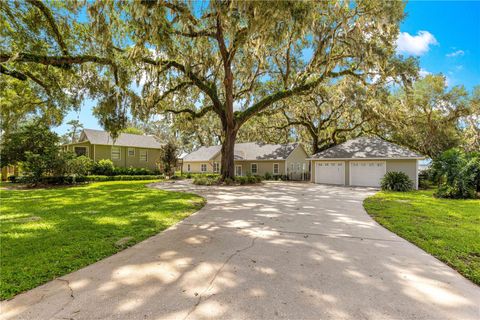
Active
$335,000
3
bds
|
2
ba
|
1,362
sqft
|
built
2007
113 Guava Ter, Ocklawaha, FL 32179
$-524
Cash flow
-8.2%
Cash-on-Cash Return
4.3%
Cap rate
0.6%
Rent to Value Ratio
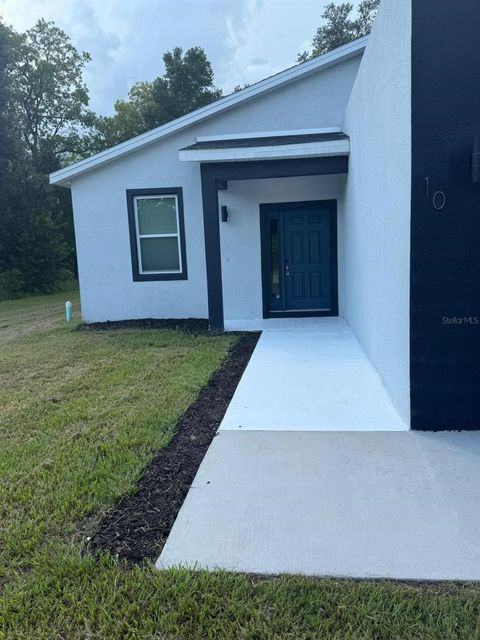
Active
$264,900
3
bds
|
2
ba
|
1,546
sqft
|
built
2023
10 Guava Lane Crse, Ocklawaha, FL 32179
$-458
Cash flow
-9.0%
Cash-on-Cash Return
4.1%
Cap rate
0.7%
Rent to Value Ratio
Active
$1,500,000
4
bds
|
4
ba
|
3,578
sqft
|
built
1998
12360 E Highway 25, Ocklawaha, FL 32179
$-6,513
Cash flow
-22.7%
Cash-on-Cash Return
0.9%
Cap rate
0.2%
Rent to Value Ratio
Active
$260,000
1
bds
|
1
ba
|
1,056
sqft
|
built
2021
5630 SE 183rd Avenue Rd, Ocklawaha, FL 32179
$-607
Cash flow
-12.2%
Cash-on-Cash Return
3.3%
Cap rate
0.5%
Rent to Value Ratio
Active
$209,000
2
bds
|
1
ba
|
1,296
sqft
|
built
1986
16621 SE 57th Pl, Ocklawaha, FL 32179
$-340
Cash flow
-8.5%
Cash-on-Cash Return
4.2%
Cap rate
0.7%
Rent to Value Ratio
Active
$1,200,000
3
bds
|
3
ba
|
2,846
sqft
|
built
2016
12336 E Highway 25, Ocklawaha, FL 32179
$-5,017
Cash flow
-21.8%
Cash-on-Cash Return
1.1%
Cap rate
0.3%
Rent to Value Ratio
Active
$1,595,000
4
bds
|
4
ba
|
3,910
sqft
|
built
2013
12757 SE 143rd Ave, Ocklawaha, FL 32179
$-4,839
Cash flow
-15.8%
Cash-on-Cash Return
2.5%
Cap rate
0.4%
Rent to Value Ratio
Active
$600,000
3
bds
|
2
ba
|
2,071
sqft
|
built
1976
15669 SE 112th Ln, Ocklawaha, FL 32179
$-1,634
Cash flow
-14.2%
Cash-on-Cash Return
2.9%
Cap rate
0.5%
Rent to Value Ratio
Active
$1,950,000
6
bds
|
7
ba
|
4,954
sqft
|
built
1948
12730 E Highway 25, Ocklawaha, FL 32179
$-7,718
Cash flow
-20.7%
Cash-on-Cash Return
1.4%
Cap rate
0.3%
Rent to Value Ratio