33009 Investment Properties for Sale
Browse homes for sale and investment properties in 33009. Refine your search by price, property type, or more.
Best cash flowing properties in 33009
Active
$229,000
2
bds
|
2
ba
|
1,092
sqft
|
built
1969
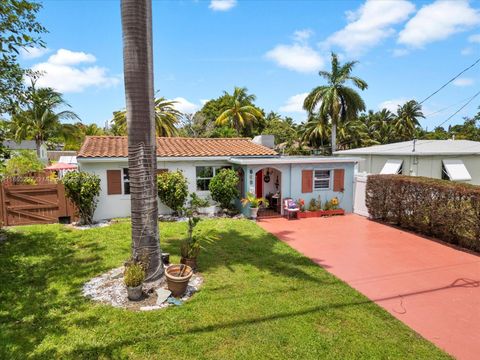
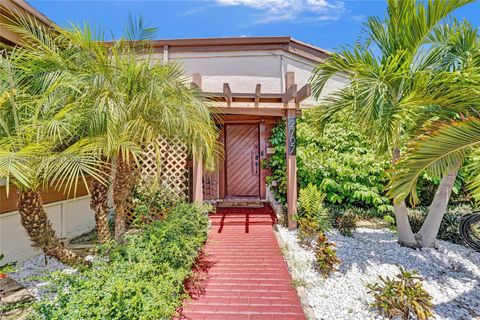
619 NE 14th Ave, Hallandale Beach, FL 33009
$-187
Cash flow
-4.3%
Cash-on-Cash Return
5.2%
Cap rate
1.0%
Rent to Value Ratio
Active
$150,000
2
bds
|
1
ba
|
870
sqft
|
built
1964
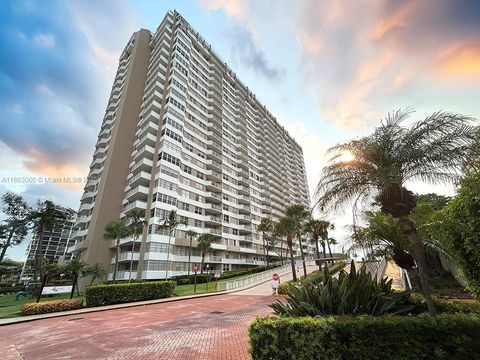
455 Golden Isles Dr, Hallandale Beach, FL 33009
$-422
Cash flow
-14.7%
Cash-on-Cash Return
2.8%
Cap rate
1.5%
Rent to Value Ratio
634 out of 730 properties for sale in 33009
Limited Results Shown
Create a free account, or log in to reveal all property listings and enjoy the complete experience.
Active
$465,000
2
bds
|
3
ba
|
1,750
sqft
|
built
1975
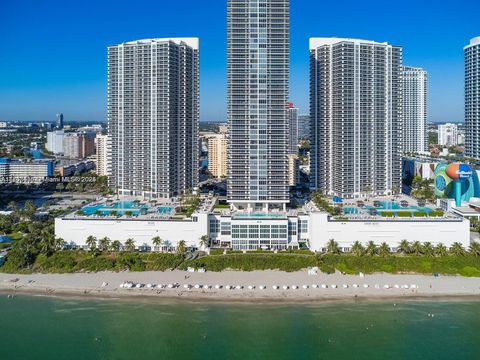
1001 Three Islands Blvd, Hallandale Beach, FL 33009
$-951
Cash flow
-10.7%
Cash-on-Cash Return
3.7%
Cap rate
0.8%
Rent to Value Ratio
Active
$249,500
2
bds
|
2
ba
|
1,000
sqft
|
built
1965
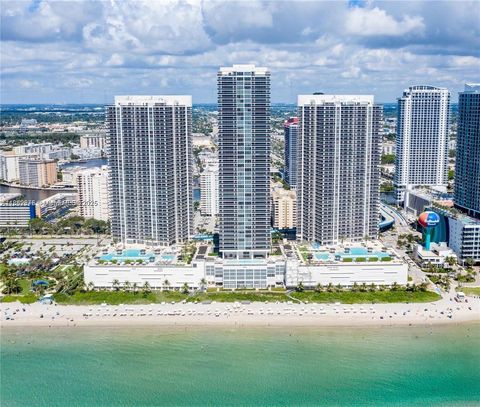
141 NE 10th Ave, Hallandale Beach, FL 33009
$-680
Cash flow
-14.2%
Cash-on-Cash Return
2.9%
Cap rate
0.9%
Rent to Value Ratio
Active
$220,000
1
bds
|
2
ba
|
780
sqft
|
built
1969
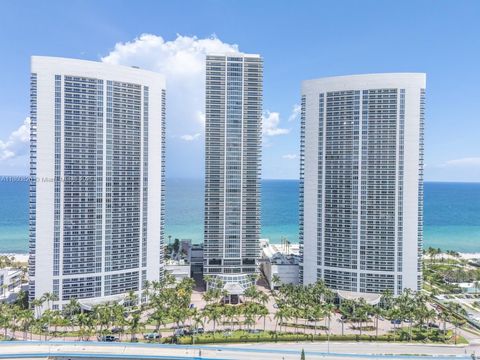
1817 S Ocean Dr, Hallandale Beach, FL 33009
$-671
Cash flow
-15.9%
Cash-on-Cash Return
2.5%
Cap rate
1.0%
Rent to Value Ratio
Active
$449,000
2
bds
|
2
ba
|
1,081
sqft
|
built
2007
1755 E Hallandale Beach Blvd, Hallandale Beach, FL 33009
$-1,433
Cash flow
-16.7%
Cash-on-Cash Return
2.3%
Cap rate
0.8%
Rent to Value Ratio
Active
$648,800
3
bds
|
2
ba
|
1,624
sqft
|
built
1979
2731 S Parkview Dr, Hallandale Beach, FL 33009
$-2,685
Cash flow
-21.6%
Cash-on-Cash Return
1.2%
Cap rate
0.5%
Rent to Value Ratio
Active
$500,000
1
bds
|
2
ba
|
950
sqft
|
built
1980
2500 Parkview Dr, Hallandale Beach, FL 33009
$-2,293
Cash flow
-23.9%
Cash-on-Cash Return
0.6%
Cap rate
0.5%
Rent to Value Ratio
Active
$675,000
3
bds
|
2
ba
|
0
sqft
|
built
1964
609 SW 2nd Ave, Hallandale Beach, FL 33009
$-1,761
Cash flow
-13.6%
Cash-on-Cash Return
3.0%
Cap rate
0.5%
Rent to Value Ratio
Active
$439,500
2
bds
|
2
ba
|
1,240
sqft
|
built
1972
1985 S Ocean Dr, Hallandale Beach, FL 33009
$-1,861
Cash flow
-22.1%
Cash-on-Cash Return
1.1%
Cap rate
0.7%
Rent to Value Ratio
Active
$615,000
1
bds
|
1
ba
|
871
sqft
|
built
2006
1830 S Ocean Dr, Hallandale Beach, FL 33009
$-2,515
Cash flow
-21.3%
Cash-on-Cash Return
1.2%
Cap rate
0.6%
Rent to Value Ratio
Active
$685,000
2
bds
|
1
ba
|
1,086
sqft
|
built
2006
1800 S Ocean Dr, Hallandale Beach, FL 33009
$-2,988
Cash flow
-22.8%
Cash-on-Cash Return
0.9%
Cap rate
0.6%
Rent to Value Ratio
Active
$599,900
3
bds
|
2
ba
|
1,270
sqft
|
built
1974
2017 S Ocean Dr, Hallandale Beach, FL 33009
$-1,591
Cash flow
-13.8%
Cash-on-Cash Return
3.0%
Cap rate
0.6%
Rent to Value Ratio
Active
$1,125,000
2
bds
|
2
ba
|
1,458
sqft
|
built
2006
1830 S Ocean Dr, Hallandale Beach, FL 33009
$-4,340
Cash flow
-20.1%
Cash-on-Cash Return
1.5%
Cap rate
0.6%
Rent to Value Ratio
Active
$735,000
2
bds
|
2
ba
|
1,080
sqft
|
built
1979
3140 S Ocean Dr, Hallandale Beach, FL 33009
$-3,013
Cash flow
-21.4%
Cash-on-Cash Return
1.2%
Cap rate
0.5%
Rent to Value Ratio
Active
$325,000
2
bds
|
2
ba
|
1,130
sqft
|
built
1976
1000 Parkview Dr, Hallandale Beach, FL 33009
$-1,139
Cash flow
-18.3%
Cash-on-Cash Return
1.9%
Cap rate
0.8%
Rent to Value Ratio
Active
$350,000
1
bds
|
1
ba
|
741
sqft
|
built
1972
3180 S Ocean Dr, Hallandale Beach, FL 33009
$-1,676
Cash flow
-25.0%
Cash-on-Cash Return
0.4%
Cap rate
0.7%
Rent to Value Ratio
Active
$660,000
2
bds
|
2
ba
|
1,360
sqft
|
built
1974
2049 S Ocean Dr, Hallandale Beach, FL 33009
$-2,786
Cash flow
-22.0%
Cash-on-Cash Return
1.1%
Cap rate
0.5%
Rent to Value Ratio
Active
$200,000
2
bds
|
2
ba
|
1,386
sqft
|
built
1966
1333 E Hallandale Beach Blvd, Hallandale Beach, FL 33009
$-747
Cash flow
-19.5%
Cash-on-Cash Return
1.7%
Cap rate
1.2%
Rent to Value Ratio
Active
$170,000
1
bds
|
1
ba
|
720
sqft
|
built
1965
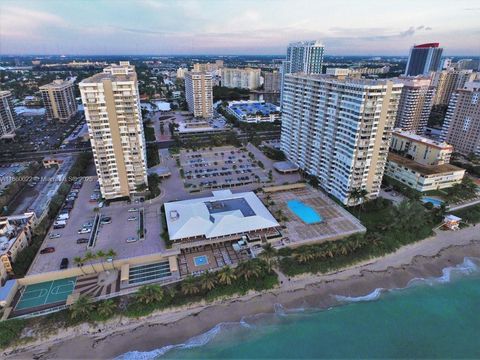
700 Layne Blvd, Hallandale Beach, FL 33009
$-485
Cash flow
-14.9%
Cash-on-Cash Return
2.7%
Cap rate
1.2%
Rent to Value Ratio
Active
$690,000
1
bds
|
1
ba
|
871
sqft
|
built
2006
1830 S Ocean Dr, Hallandale Beach, FL 33009
$-2,834
Cash flow
-21.4%
Cash-on-Cash Return
1.2%
Cap rate
0.6%
Rent to Value Ratio
Active
$639,999
3
bds
|
2
ba
|
1,624
sqft
|
built
1980
2707 S Parkview Dr, Hallandale Beach, FL 33009
$-2,003
Cash flow
-16.3%
Cash-on-Cash Return
2.4%
Cap rate
0.6%
Rent to Value Ratio
Active
$4,500,000
5
bds
|
4
ba
|
3,718
sqft
|
built
1973
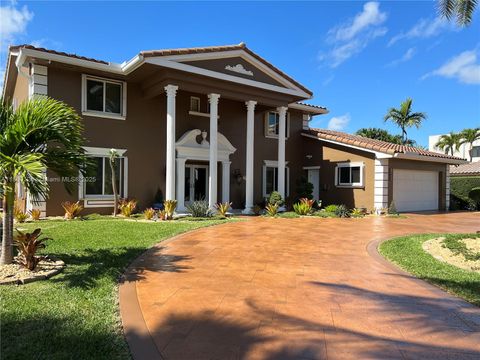
624 Palm Dr, Hallandale Beach, FL 33009
$-17,155
Cash flow
-19.9%
Cash-on-Cash Return
1.6%
Cap rate
0.2%
Rent to Value Ratio
Active
$740,000
3
bds
|
3
ba
|
1,780
sqft
|
built
1971
1950 S Ocean Dr, Hallandale Beach, FL 33009
$-3,355
Cash flow
-23.7%
Cash-on-Cash Return
0.7%
Cap rate
0.6%
Rent to Value Ratio
Active
$860,000
2
bds
|
3
ba
|
1,220
sqft
|
built
2002
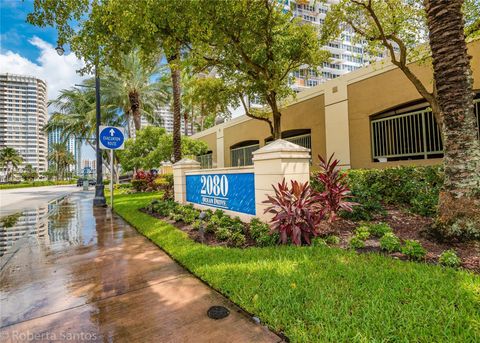
2080 S Ocean Dr, Hallandale Beach, FL 33009
$-3,923
Cash flow
-23.8%
Cash-on-Cash Return
0.7%
Cap rate
0.5%
Rent to Value Ratio
Active
$200,000
1
bds
|
1
ba
|
545
sqft
|
built
1970
1965 S Ocean Dr, Hallandale Beach, FL 33009
$-761
Cash flow
-19.9%
Cash-on-Cash Return
1.6%
Cap rate
0.9%
Rent to Value Ratio
Active
$449,000
2
bds
|
2
ba
|
1,580
sqft
|
built
1980
2500 Parkview Dr, Hallandale Beach, FL 33009
$-1,833
Cash flow
-21.3%
Cash-on-Cash Return
1.2%
Cap rate
0.7%
Rent to Value Ratio
Active
$579,000
3
bds
|
2
ba
|
1,127
sqft
|
built
1960
309 SW 7th St, Hallandale Beach, FL 33009
$-1,333
Cash flow
-12.0%
Cash-on-Cash Return
3.4%
Cap rate
0.5%
Rent to Value Ratio
Active
$629,000
1
bds
|
1
ba
|
844
sqft
|
built
2006
1830 S Ocean Dr, Hallandale Beach, FL 33009
$-2,385
Cash flow
-19.8%
Cash-on-Cash Return
1.6%
Cap rate
0.6%
Rent to Value Ratio
Active
$265,000
1
bds
|
2
ba
|
924
sqft
|
built
1975
601 Three Islands Blvd, Hallandale Beach, FL 33009
$-706
Cash flow
-13.9%
Cash-on-Cash Return
2.9%
Cap rate
0.8%
Rent to Value Ratio
Active
$270,000
2
bds
|
2
ba
|
915
sqft
|
built
1976
1000 Parkview Dr, Hallandale Beach, FL 33009
$-982
Cash flow
-19.0%
Cash-on-Cash Return
1.8%
Cap rate
0.8%
Rent to Value Ratio
Active
$799,000
3
bds
|
3
ba
|
1,737
sqft
|
built
2015
2600 E Hallandale Beach Blvd, Hallandale Beach, FL 33009
$-4,080
Cash flow
-26.6%
Cash-on-Cash Return
0.0%
Cap rate
0.6%
Rent to Value Ratio
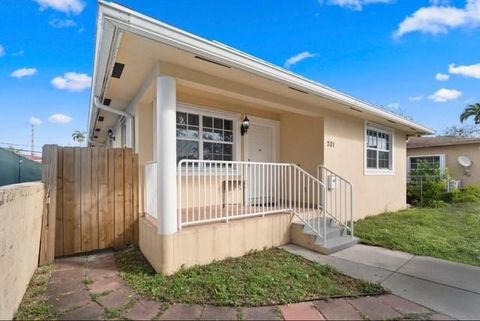
Active
$320,000
2
bds
|
2
ba
|
1,092
sqft
|
built
1970
301 NE 14th Ave, Hallandale Beach, FL 33009
$-848
Cash flow
-13.8%
Cash-on-Cash Return
3.0%
Cap rate
0.8%
Rent to Value Ratio
Active
$367,000
2
bds
|
2
ba
|
1,171
sqft
|
built
1970
1965 S Ocean Dr, Hallandale Beach, FL 33009
$-1,680
Cash flow
-23.9%
Cash-on-Cash Return
0.7%
Cap rate
0.8%
Rent to Value Ratio
Active
$490,000
3
bds
|
1
ba
|
1,318
sqft
|
built
1956
804 NE 2nd St, Hallandale Beach, FL 33009
$-924
Cash flow
-9.8%
Cash-on-Cash Return
3.9%
Cap rate
0.7%
Rent to Value Ratio
Active
$740,000
1
bds
|
1
ba
|
844
sqft
|
built
2006
1830 S Ocean Dr, Hallandale Beach, FL 33009
$-2,885
Cash flow
-20.3%
Cash-on-Cash Return
1.5%
Cap rate
0.6%
Rent to Value Ratio
Active
$265,000
2
bds
|
2
ba
|
1,039
sqft
|
built
1967
180 NE 12th Ave, Hallandale Beach, FL 33009
$-597
Cash flow
-11.8%
Cash-on-Cash Return
3.4%
Cap rate
0.9%
Rent to Value Ratio
Active
$215,000
1
bds
|
1
ba
|
700
sqft
|
built
1980
1913 S Ocean Dr, Hallandale Beach, FL 33009
$-677
Cash flow
-16.4%
Cash-on-Cash Return
2.4%
Cap rate
0.8%
Rent to Value Ratio
Active
$654,900
3
bds
|
2
ba
|
1,380
sqft
|
built
2007
701 NE 6th St, Hallandale Beach, FL 33009
$-837
Cash flow
-6.7%
Cash-on-Cash Return
4.6%
Cap rate
0.7%
Rent to Value Ratio
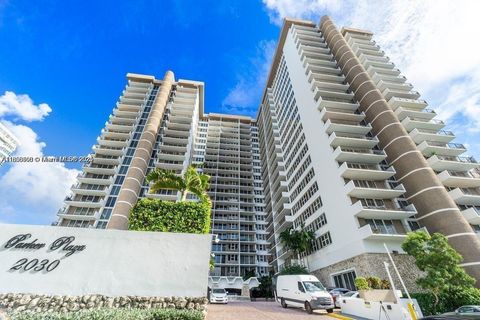
Active
$469,000
1
bds
|
1
ba
|
736
sqft
|
built
1970
2030 S Ocean Dr, Hallandale Beach, FL 33009
$-1,629
Cash flow
-18.1%
Cash-on-Cash Return
2.0%
Cap rate
0.7%
Rent to Value Ratio