33019 Investment Properties for Sale
Browse homes for sale and investment properties in 33019. Refine your search by price, property type, or more.
Best cash flowing properties in 33019

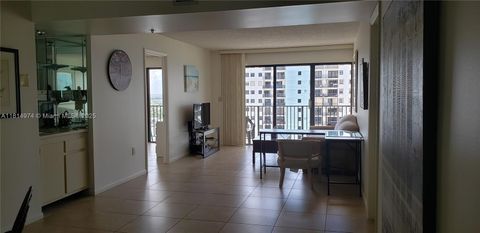
Active
$435,000
1
bds
|
2
ba
|
790
sqft
|
built
1964
3505 S Ocean Dr, Hollywood, FL 33019
$0
Cash flow
n/a
Cash-on-Cash Return
n/a
Cap rate
n/a
Rent to Value Ratio
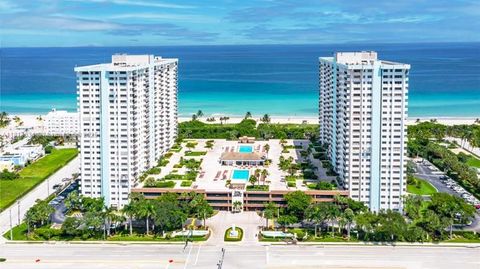
Active
$255,000
1
bds
|
1
ba
|
883
sqft
|
built
1966
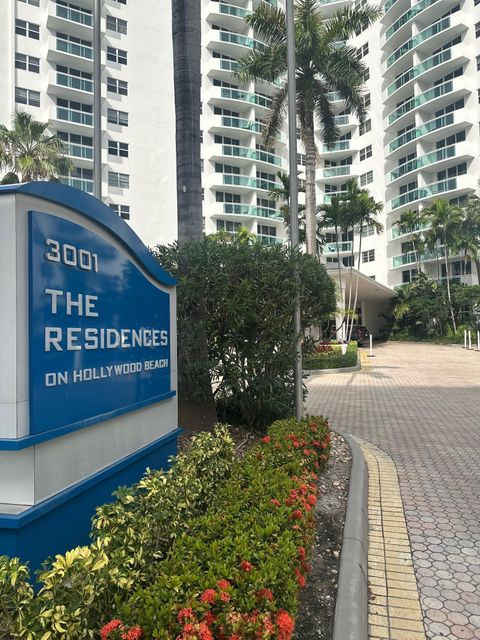
3001 S Ocean Dr, Hollywood, FL 33019
$-689
Cash flow
-14.1%
Cash-on-Cash Return
2.9%
Cap rate
1.2%
Rent to Value Ratio
433 out of 540 properties for sale in 33019
Limited Results Shown
Create a free account, or log in to reveal all property listings and enjoy the complete experience.
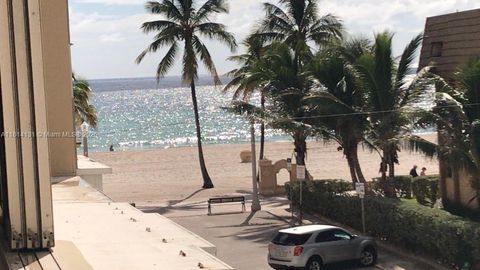
Active
$305,000
1
bds
|
1
ba
|
883
sqft
|
built
1966
3001 S Ocean Dr, Hollywood, FL 33019
$-1,169
Cash flow
-20.0%
Cash-on-Cash Return
1.5%
Cap rate
0.9%
Rent to Value Ratio
Active
$590,000
2
bds
|
1
ba
|
822
sqft
|
built
2017
777 N Ocean Dr, Hollywood, FL 33019
$-2,955
Cash flow
-26.1%
Cash-on-Cash Return
0.1%
Cap rate
0.6%
Rent to Value Ratio
Active
$3,250,000
3
bds
|
4
ba
|
3,091
sqft
|
built
2005
3101 S Ocean Dr, Hollywood, FL 33019
$-14,980
Cash flow
-24.0%
Cash-on-Cash Return
0.6%
Cap rate
0.3%
Rent to Value Ratio
Active
$699,000
2
bds
|
2
ba
|
1,768
sqft
|
built
1973
2751 S Ocean Dr, Hollywood, FL 33019
$-3,232
Cash flow
-24.1%
Cash-on-Cash Return
0.6%
Cap rate
0.6%
Rent to Value Ratio

Active
$2,700,000
2
bds
|
3
ba
|
2,267
sqft
|
built
2006
3535 S Ocean Dr, Hollywood, FL 33019
$-12,751
Cash flow
-24.6%
Cash-on-Cash Return
0.5%
Cap rate
0.3%
Rent to Value Ratio
Active
$2,290,000
5
bds
|
4
ba
|
3,359
sqft
|
built
1996
1580 Shoreline Way, Hollywood, FL 33019
$-8,627
Cash flow
-19.7%
Cash-on-Cash Return
1.6%
Cap rate
0.4%
Rent to Value Ratio

Active
$1,850,000
5
bds
|
5
ba
|
4,281
sqft
|
built
1994
1350 Hollywood Blvd, Hollywood, FL 33019
$-4,285
Cash flow
-12.1%
Cash-on-Cash Return
3.4%
Cap rate
0.6%
Rent to Value Ratio
Active
$844,999
3
bds
|
3
ba
|
2,046
sqft
|
built
1994
1135 W Lake St, Hollywood, FL 33019
$-2,083
Cash flow
-12.9%
Cash-on-Cash Return
3.2%
Cap rate
0.6%
Rent to Value Ratio

Active
$1,675,000
3
bds
|
4
ba
|
3,415
sqft
|
built
2015
3415 N Ocean Dr, Hollywood, FL 33019
$-8,972
Cash flow
-27.9%
Cash-on-Cash Return
-0.3%
Cap rate
0.5%
Rent to Value Ratio
Active
$399,000
1
bds
|
2
ba
|
905
sqft
|
built
1969
4001 S Ocean Dr, Hollywood, FL 33019
$-1,535
Cash flow
-20.1%
Cash-on-Cash Return
1.5%
Cap rate
0.9%
Rent to Value Ratio
Active
$479,000
1
bds
|
1
ba
|
883
sqft
|
built
1966
3001 S Ocean Dr, Hollywood, FL 33019
$-1,879
Cash flow
-20.5%
Cash-on-Cash Return
1.4%
Cap rate
0.5%
Rent to Value Ratio

Active
$1,125,000
3
bds
|
4
ba
|
1,877
sqft
|
built
1991
4034 N Ocean Dr, Hollywood, FL 33019
$-2,529
Cash flow
-11.7%
Cash-on-Cash Return
3.4%
Cap rate
0.7%
Rent to Value Ratio
Active
$1,535,000
3
bds
|
2
ba
|
2,252
sqft
|
built
1969
1045 Hollywood Blvd, Hollywood, FL 33019
$-4,424
Cash flow
-15.0%
Cash-on-Cash Return
2.7%
Cap rate
0.5%
Rent to Value Ratio

Active
$389,000
1
bds
|
1
ba
|
724
sqft
|
built
2017
777 N Ocean Dr, Hollywood, FL 33019
$-1,954
Cash flow
-26.2%
Cash-on-Cash Return
0.1%
Cap rate
0.7%
Rent to Value Ratio

Active
$1,199,000
4
bds
|
4
ba
|
2,551
sqft
|
built
1953
1329 Tyler St, Hollywood, FL 33019
$-2,762
Cash flow
-12.0%
Cash-on-Cash Return
3.4%
Cap rate
0.7%
Rent to Value Ratio
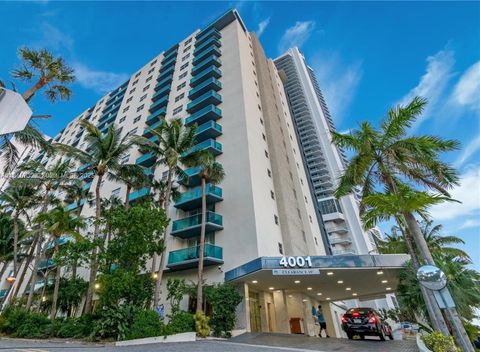
Active
$549,000
1
bds
|
2
ba
|
1,146
sqft
|
built
1969
4001 S Ocean Dr, Hollywood, FL 33019
$-2,946
Cash flow
-28.0%
Cash-on-Cash Return
-0.3%
Cap rate
0.6%
Rent to Value Ratio
Active
$600,000
3
bds
|
2
ba
|
1,420
sqft
|
built
1994
1150 Queen Palm Ct, Hollywood, FL 33019
$-1,988
Cash flow
-17.3%
Cash-on-Cash Return
2.2%
Cap rate
0.6%
Rent to Value Ratio
Active
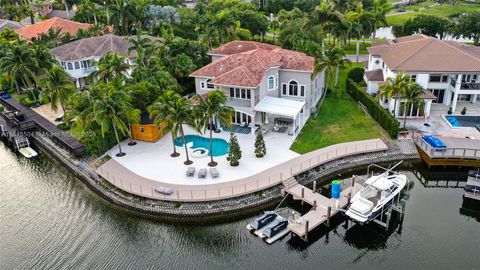
$5,850,000
6
bds
|
7
ba
|
4,868
sqft
|
built
1999
1260 Harbor Ct, Hollywood, FL 33019
$-26,801
Cash flow
-23.9%
Cash-on-Cash Return
0.6%
Cap rate
0.2%
Rent to Value Ratio

Active
$1,350,000
4
bds
|
3
ba
|
2,136
sqft
|
built
1969
1245 Wiley St, Hollywood, FL 33019
$-5,714
Cash flow
-22.1%
Cash-on-Cash Return
1.1%
Cap rate
0.3%
Rent to Value Ratio
Active
$433,000
2
bds
|
2
ba
|
1,190
sqft
|
built
1982
1201 S Ocean Dr, Hollywood, FL 33019
$-2,452
Cash flow
-29.5%
Cash-on-Cash Return
-0.6%
Cap rate
0.7%
Rent to Value Ratio
Active
$575,900
2
bds
|
2
ba
|
1,570
sqft
|
built
1982
1201 S Ocean Dr, Hollywood, FL 33019
$-2,900
Cash flow
-26.3%
Cash-on-Cash Return
0.1%
Cap rate
0.7%
Rent to Value Ratio
Active
$464,999
1
bds
|
1
ba
|
750
sqft
|
built
1968
320 S Surf Rd, Hollywood, FL 33019
$-1,922
Cash flow
-21.6%
Cash-on-Cash Return
1.2%
Cap rate
0.5%
Rent to Value Ratio
Active
$849,000
3
bds
|
2
ba
|
1,406
sqft
|
built
1951
1319 Buchanan St, Hollywood, FL 33019
$-1,928
Cash flow
-11.8%
Cash-on-Cash Return
3.4%
Cap rate
0.5%
Rent to Value Ratio
Active
$560,000
2
bds
|
2
ba
|
1,120
sqft
|
built
1967
3111 N Ocean Dr, Hollywood, FL 33019
$-2,243
Cash flow
-20.9%
Cash-on-Cash Return
1.3%
Cap rate
0.7%
Rent to Value Ratio
Active
$499,000
2
bds
|
2
ba
|
1,254
sqft
|
built
1973
1500 S Ocean Dr, Hollywood, FL 33019
$-1,857
Cash flow
-19.4%
Cash-on-Cash Return
1.7%
Cap rate
0.8%
Rent to Value Ratio
Active
$418,500
2
bds
|
2
ba
|
1,094
sqft
|
built
1970
1410 S Ocean Dr, Hollywood, FL 33019
$-788
Cash flow
-9.8%
Cash-on-Cash Return
3.9%
Cap rate
0.7%
Rent to Value Ratio
Active
$4,750,000
6
bds
|
7
ba
|
5,431
sqft
|
built
1964
1601 Diplomat Pkwy, Hollywood, FL 33019
$-23,167
Cash flow
-25.4%
Cash-on-Cash Return
0.3%
Cap rate
0.2%
Rent to Value Ratio

Active
$499,000
1
bds
|
1
ba
|
871
sqft
|
built
1971
3725 S Ocean Dr, Hollywood, FL 33019
$-2,104
Cash flow
-22.0%
Cash-on-Cash Return
1.1%
Cap rate
0.6%
Rent to Value Ratio
Active
$424,900
1
bds
|
2
ba
|
1,190
sqft
|
built
1982
1201 S Ocean Dr, Hollywood, FL 33019
$-1,683
Cash flow
-20.7%
Cash-on-Cash Return
1.4%
Cap rate
0.8%
Rent to Value Ratio
Active
$629,900
2
bds
|
2
ba
|
1,120
sqft
|
built
1967
3111 N Ocean Dr, Hollywood, FL 33019
$-2,900
Cash flow
-24.0%
Cash-on-Cash Return
0.6%
Cap rate
0.6%
Rent to Value Ratio
Active
$490,000
3
bds
|
3
ba
|
1,399
sqft
|
built
1994
1270 Weeping Willow Way, Hollywood, FL 33019
$-925
Cash flow
-9.8%
Cash-on-Cash Return
3.9%
Cap rate
0.7%
Rent to Value Ratio

Active
$425,000
1
bds
|
1
ba
|
874
sqft
|
built
1969
3901 S Ocean Dr, Hollywood, FL 33019
$-2,220
Cash flow
-27.3%
Cash-on-Cash Return
-0.1%
Cap rate
0.6%
Rent to Value Ratio
Active
$485,000
2
bds
|
2
ba
|
1,270
sqft
|
built
1973
3800 S Ocean Dr, Hollywood, FL 33019
$-1,792
Cash flow
-19.3%
Cash-on-Cash Return
1.7%
Cap rate
0.7%
Rent to Value Ratio

Active
$565,000
2
bds
|
2
ba
|
1,346
sqft
|
built
1969
4001 S Ocean Dr, Hollywood, FL 33019
$-2,324
Cash flow
-21.5%
Cash-on-Cash Return
1.2%
Cap rate
0.7%
Rent to Value Ratio

Active
$422,000
2
bds
|
2
ba
|
1,288
sqft
|
built
1970
3000 S Ocean Dr, Hollywood, FL 33019
$-2,095
Cash flow
-25.9%
Cash-on-Cash Return
0.2%
Cap rate
0.7%
Rent to Value Ratio

Active
$1,070,000
3
bds
|
4
ba
|
2,544
sqft
|
built
2003
826 Spinnaker Dr E, Hollywood, FL 33019
$-3,153
Cash flow
-15.4%
Cash-on-Cash Return
2.6%
Cap rate
0.6%
Rent to Value Ratio

Active
$445,000
2
bds
|
2
ba
|
1,254
sqft
|
built
1973
1500 S Ocean Dr, Hollywood, FL 33019
$-1,888
Cash flow
-22.1%
Cash-on-Cash Return
1.1%
Cap rate
0.8%
Rent to Value Ratio
Active
$548,000
2
bds
|
2
ba
|
1,270
sqft
|
built
1973
3800 S Ocean Dr, Hollywood, FL 33019
$-2,476
Cash flow
-23.6%
Cash-on-Cash Return
0.7%
Cap rate
0.7%
Rent to Value Ratio