33029 Investment Properties for Sale
Browse homes for sale and investment properties in 33029. Refine your search by price, property type, or more.
Best cash flowing properties in 33029
Active
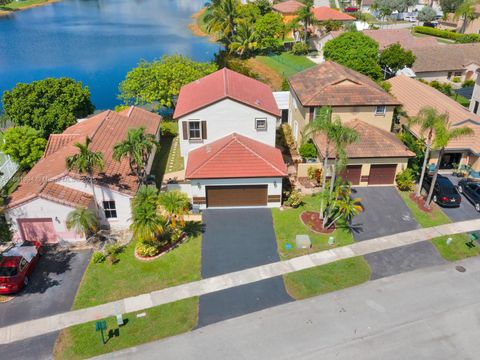
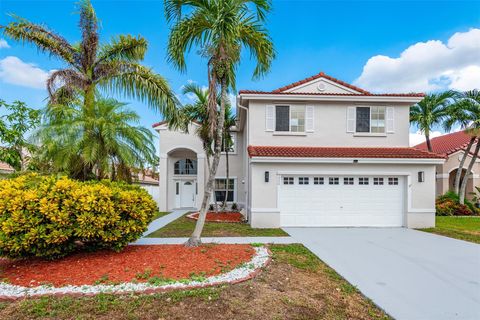
$399,000
3
bds
|
3
ba
|
1,361
sqft
|
built
1999
719 NW 208th Way, Pembroke Pines, FL 33029
$-472
Cash flow
-6.2%
Cash-on-Cash Return
4.7%
Cap rate
0.7%
Rent to Value Ratio
Active
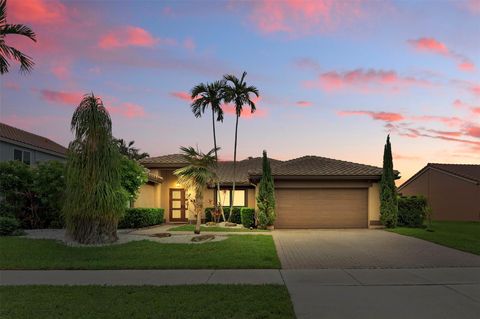
$1,070,000
4
bds
|
4
ba
|
2,770
sqft
|
built
2003
2294 SW 195th Ave, Miramar, FL 33029
$-718
Cash flow
-3.5%
Cash-on-Cash Return
5.3%
Cap rate
0.8%
Rent to Value Ratio
136 out of 145 properties for sale in 33029
Limited Results Shown
Create a free account, or log in to reveal all property listings and enjoy the complete experience.
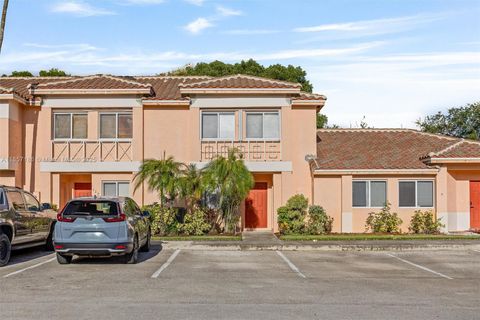
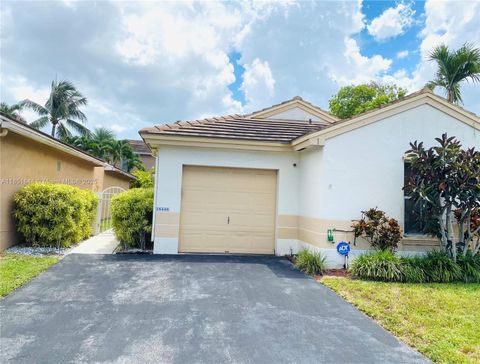
Active
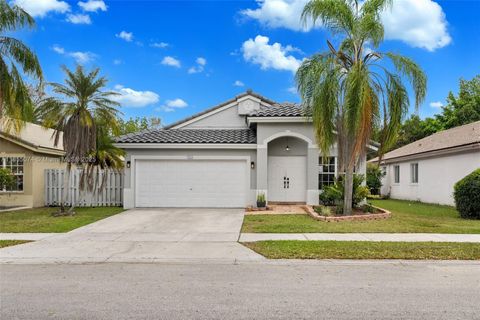
$699,999
3
bds
|
2
ba
|
1,821
sqft
|
built
1997
18581 NW 23rd St, Pembroke Pines, FL 33029
$-2,226
Cash flow
-16.6%
Cash-on-Cash Return
2.3%
Cap rate
0.5%
Rent to Value Ratio
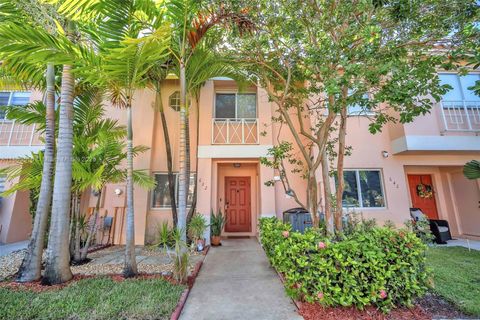
Active
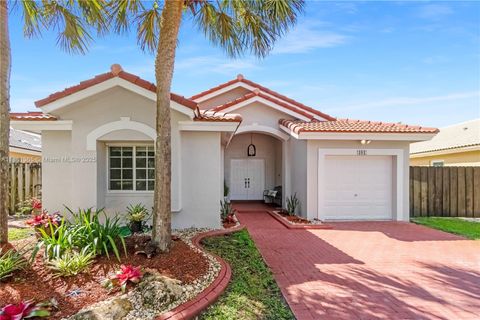
$395,000
2
bds
|
3
ba
|
1,114
sqft
|
built
2001
632 NW 208th Ter, Pembroke Pines, FL 33029
$-868
Cash flow
-11.5%
Cash-on-Cash Return
3.5%
Cap rate
0.6%
Rent to Value Ratio
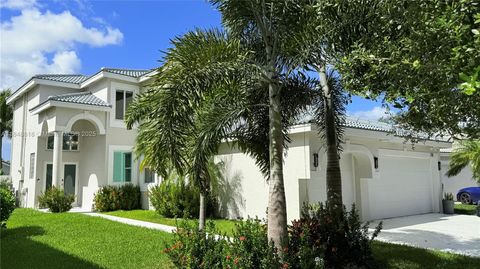
Active
$629,800
3
bds
|
3
ba
|
0
sqft
|
built
1992
2130 NW 184th Way, Pembroke Pines, FL 33029
$-1,697
Cash flow
-14.1%
Cash-on-Cash Return
2.9%
Cap rate
0.5%
Rent to Value Ratio
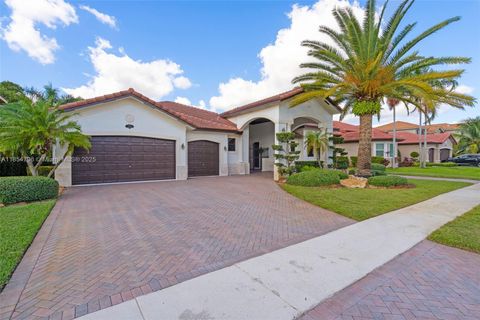
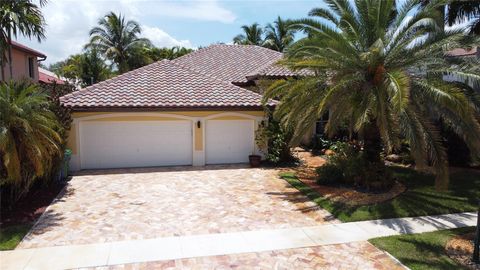
Active
$644,900
3
bds
|
2
ba
|
1,462
sqft
|
built
1996
491 SW 203rd Ave, Pembroke Pines, FL 33029
$-1,300
Cash flow
-10.5%
Cash-on-Cash Return
3.7%
Cap rate
0.5%
Rent to Value Ratio
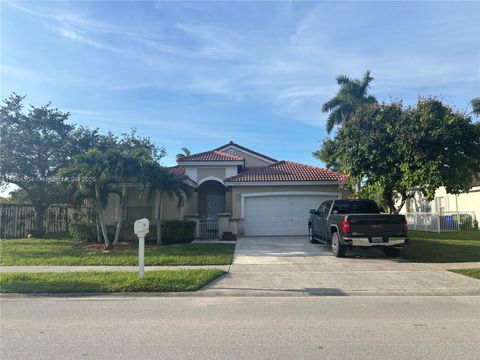
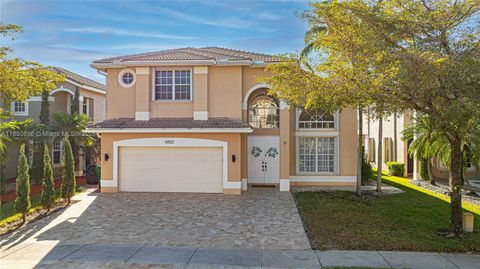
Active
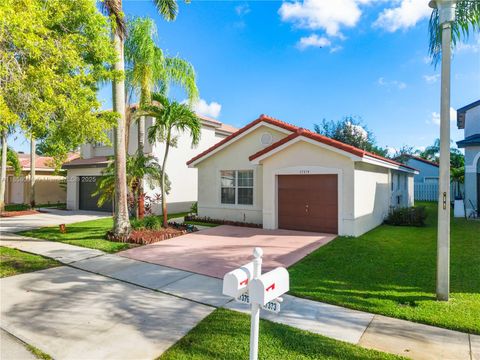
$549,900
3
bds
|
2
ba
|
1,221
sqft
|
built
1996
17379 SW 22nd St, Miramar, FL 33029
$-1,081
Cash flow
-10.3%
Cash-on-Cash Return
3.8%
Cap rate
0.6%
Rent to Value Ratio
Active
$790,000
4
bds
|
3
ba
|
2,870
sqft
|
built
1998
17915 SW 33rd St, Miramar, FL 33029
$-1,843
Cash flow
-12.2%
Cash-on-Cash Return
3.3%
Cap rate
0.6%
Rent to Value Ratio
Active
$720,000
3
bds
|
2
ba
|
1,648
sqft
|
built
1996
2411 NW 184th Ter, Pembroke Pines, FL 33029
$-1,787
Cash flow
-12.9%
Cash-on-Cash Return
3.2%
Cap rate
0.6%
Rent to Value Ratio
Active
$1,090,000
4
bds
|
3
ba
|
2,818
sqft
|
built
2002
2092 SW 176th Ave, Miramar, FL 33029
$-2,264
Cash flow
-10.8%
Cash-on-Cash Return
3.7%
Cap rate
0.6%
Rent to Value Ratio
Active
$749,800
3
bds
|
3
ba
|
1,862
sqft
|
built
1995
17726 SW 27th Ct, Miramar, FL 33029
$-1,920
Cash flow
-13.4%
Cash-on-Cash Return
3.1%
Cap rate
0.5%
Rent to Value Ratio
Active
$785,000
4
bds
|
3
ba
|
2,392
sqft
|
built
1996
18840 NW 23rd Pl, Pembroke Pines, FL 33029
$-1,619
Cash flow
-10.8%
Cash-on-Cash Return
3.7%
Cap rate
0.6%
Rent to Value Ratio
Active
$889,000
5
bds
|
4
ba
|
2,871
sqft
|
built
1996
322 SW 184th Way, Pembroke Pines, FL 33029
$-1,813
Cash flow
-10.6%
Cash-on-Cash Return
3.7%
Cap rate
0.6%
Rent to Value Ratio
Active
$1,250,000
5
bds
|
4
ba
|
3,637
sqft
|
built
2022
4406 SW 176th Ave, Miramar, FL 33029
$-4,072
Cash flow
-17.0%
Cash-on-Cash Return
2.2%
Cap rate
0.5%
Rent to Value Ratio
Active
$870,000
4
bds
|
3
ba
|
2,639
sqft
|
built
1996
18196 SW 29th St, Miramar, FL 33029
$-2,660
Cash flow
-16.0%
Cash-on-Cash Return
2.5%
Cap rate
0.5%
Rent to Value Ratio

Active
$599,000
3
bds
|
2
ba
|
1,178
sqft
|
built
2001
18801 SW 25th Ct, Miramar, FL 33029
$-1,821
Cash flow
-15.9%
Cash-on-Cash Return
2.5%
Cap rate
0.6%
Rent to Value Ratio
Active
$899,000
4
bds
|
3
ba
|
2,419
sqft
|
built
1991
1930 NW 180th Way, Pembroke Pines, FL 33029
$-2,018
Cash flow
-11.7%
Cash-on-Cash Return
3.5%
Cap rate
0.6%
Rent to Value Ratio
Active
$749,500
3
bds
|
3
ba
|
2,365
sqft
|
built
1994
400 NW 202nd Way, Pembroke Pines, FL 33029
$-1,678
Cash flow
-11.7%
Cash-on-Cash Return
3.5%
Cap rate
0.5%
Rent to Value Ratio
Active
$1,479,000
5
bds
|
5
ba
|
3,633
sqft
|
built
2023
4335 SW 173rd Ave, Miramar, FL 33029
$-5,223
Cash flow
-18.4%
Cash-on-Cash Return
1.9%
Cap rate
0.4%
Rent to Value Ratio
Active
$875,000
3
bds
|
3
ba
|
2,047
sqft
|
built
2021
4407 SW 175th Ave, Miramar, FL 33029
$-2,998
Cash flow
-17.9%
Cash-on-Cash Return
2.0%
Cap rate
0.5%
Rent to Value Ratio
Active
$1,525,000
5
bds
|
5
ba
|
3,633
sqft
|
built
2023
4520 SW 173rd Ave, Miramar, FL 33029
$-3,894
Cash flow
-13.3%
Cash-on-Cash Return
3.1%
Cap rate
0.6%
Rent to Value Ratio
Active
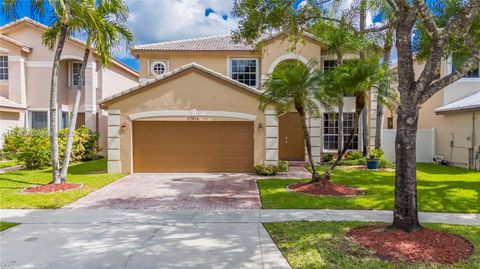
$649,900
4
bds
|
3
ba
|
2,216
sqft
|
built
1993
1040 NW 191st Ave, Pembroke Pines, FL 33029
$-1,613
Cash flow
-12.9%
Cash-on-Cash Return
3.2%
Cap rate
0.6%
Rent to Value Ratio
Active
$875,000
4
bds
|
3
ba
|
2,368
sqft
|
built
1994
1123 NW 195th Ave, Pembroke Pines, FL 33029
$-1,959
Cash flow
-11.7%
Cash-on-Cash Return
3.5%
Cap rate
0.7%
Rent to Value Ratio
Active
$610,000
4
bds
|
2
ba
|
1,663
sqft
|
built
1997
251 SW 203rd Ave, Pembroke Pines, FL 33029
$-1,654
Cash flow
-14.1%
Cash-on-Cash Return
2.9%
Cap rate
0.5%
Rent to Value Ratio
Active
$1,080,000
5
bds
|
6
ba
|
3,381
sqft
|
built
2022
17577 SW 41st St, Miramar, FL 33029
$-3,139
Cash flow
-15.2%
Cash-on-Cash Return
2.7%
Cap rate
0.5%
Rent to Value Ratio
Active
$720,000
3
bds
|
2
ba
|
1,262
sqft
|
built
1993
18336 NW 6th St, Pembroke Pines, FL 33029
$-1,795
Cash flow
-13.0%
Cash-on-Cash Return
3.2%
Cap rate
0.5%
Rent to Value Ratio
Active
$775,000
3
bds
|
3
ba
|
2,365
sqft
|
built
1993
19441 NW 3rd St, Pembroke Pines, FL 33029
$-1,807
Cash flow
-12.2%
Cash-on-Cash Return
3.3%
Cap rate
0.5%
Rent to Value Ratio
Active
$900,000
4
bds
|
3
ba
|
2,655
sqft
|
built
1994
1210 NW 193rd Ave, Pembroke Pines, FL 33029
$-855
Cash flow
-5.0%
Cash-on-Cash Return
5.0%
Cap rate
0.6%
Rent to Value Ratio
Active
$580,000
3
bds
|
2
ba
|
1,509
sqft
|
built
1993
2002 NW 184th Way, Pembroke Pines, FL 33029
$-1,160
Cash flow
-10.4%
Cash-on-Cash Return
3.7%
Cap rate
0.6%
Rent to Value Ratio
Active
$500,000
3
bds
|
2
ba
|
1,403
sqft
|
built
1992
18446 NW 21st St, Pembroke Pines, FL 33029
$-734
Cash flow
-7.7%
Cash-on-Cash Return
4.4%
Cap rate
0.7%
Rent to Value Ratio
Active
$925,000
5
bds
|
3
ba
|
2,814
sqft
|
built
1994
212 SW 179th Ave, Pembroke Pines, FL 33029
$-1,543
Cash flow
-8.7%
Cash-on-Cash Return
4.1%
Cap rate
0.7%
Rent to Value Ratio
Active
$1,198,800
5
bds
|
4
ba
|
3,380
sqft
|
built
2002
18640 SW 39th St, Miramar, FL 33029
$-3,172
Cash flow
-13.8%
Cash-on-Cash Return
3.0%
Cap rate
0.5%
Rent to Value Ratio
Active
$1,224,000
4
bds
|
3
ba
|
2,953
sqft
|
built
2006
5022 SW 173rd Ave, Miramar, FL 33029
$-3,548
Cash flow
-15.1%
Cash-on-Cash Return
2.7%
Cap rate
0.5%
Rent to Value Ratio
Active
$630,000
3
bds
|
2
ba
|
1,262
sqft
|
built
1993
18266 NW 6th St, Pembroke Pines, FL 33029
$-1,616
Cash flow
-13.4%
Cash-on-Cash Return
3.1%
Cap rate
0.6%
Rent to Value Ratio
Active
$845,000
4
bds
|
3
ba
|
2,347
sqft
|
built
1996
2103 SW 173rd Ave, Miramar, FL 33029
$-2,044
Cash flow
-12.6%
Cash-on-Cash Return
3.2%
Cap rate
0.5%
Rent to Value Ratio
Active
$689,000
4
bds
|
3
ba
|
2,213
sqft
|
built
1994
1378 SW 180th Ave, Pembroke Pines, FL 33029
$-1,842
Cash flow
-13.9%
Cash-on-Cash Return
2.9%
Cap rate
0.6%
Rent to Value Ratio
Active
$799,000
4
bds
|
3
ba
|
2,165
sqft
|
built
1993
1361 NW 185th Ave, Pembroke Pines, FL 33029
$-1,774
Cash flow
-11.6%
Cash-on-Cash Return
3.5%
Cap rate
0.6%
Rent to Value Ratio
Active
$990,000
4
bds
|
4
ba
|
3,439
sqft
|
built
1999
17933 SW 35th Ct, Miramar, FL 33029
$-2,129
Cash flow
-11.2%
Cash-on-Cash Return
3.6%
Cap rate
0.6%
Rent to Value Ratio
Active
$1,249,000
6
bds
|
4
ba
|
3,976
sqft
|
built
2001
2128 SW 176th Ter, Miramar, FL 33029
$-3,013
Cash flow
-12.6%
Cash-on-Cash Return
3.3%
Cap rate
0.6%
Rent to Value Ratio
Active
$1,199,999
6
bds
|
5
ba
|
3,766
sqft
|
built
2007
18900 SW 32nd Ct, Miramar, FL 33029
$-1,797
Cash flow
-7.8%
Cash-on-Cash Return
4.4%
Cap rate
0.7%
Rent to Value Ratio