33055 Investment Properties for Sale
Browse homes for sale and investment properties in 33055. Refine your search by price, property type, or more.
Best cash flowing properties in 33055

Active
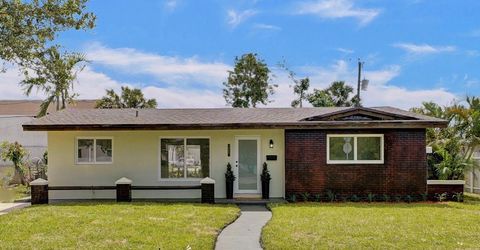
$315,000
3
bds
|
2
ba
|
1,058
sqft
|
built
1971
4534 NW 195th St, Miami Gardens, FL 33055
$-47
Cash flow
-0.8%
Cash-on-Cash Return
6.1%
Cap rate
0.9%
Rent to Value Ratio
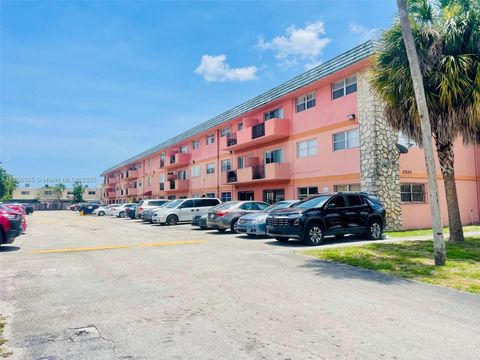
Active
$190,000
1
bds
|
1
ba
|
633
sqft
|
built
1969
17101 NW 57th Ave, Miami Gardens, FL 33055
$-83
Cash flow
-2.3%
Cash-on-Cash Return
5.6%
Cap rate
0.9%
Rent to Value Ratio
41 out of 51 properties for sale in 33055
Limited Results Shown
Create a free account, or log in to reveal all property listings and enjoy the complete experience.

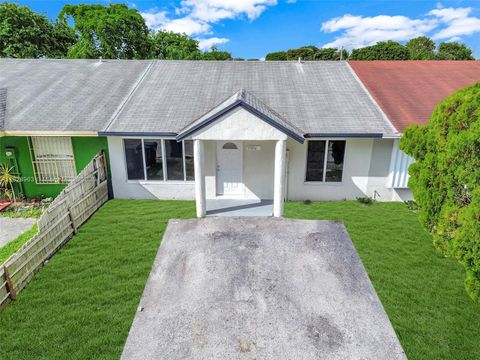
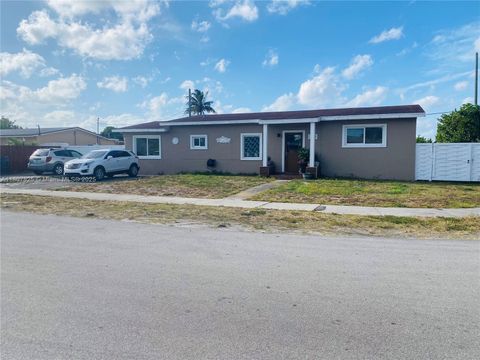
Active
$310,000
3
bds
|
2
ba
|
960
sqft
|
built
1983
18602 NW 46th Ave, Miami Gardens, FL 33055
$-199
Cash flow
-3.3%
Cash-on-Cash Return
5.5%
Cap rate
0.8%
Rent to Value Ratio
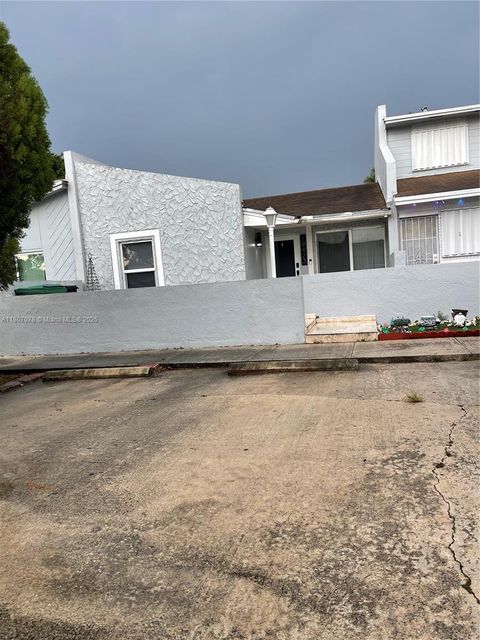
Active
$359,000
3
bds
|
2
ba
|
1,120
sqft
|
built
1990
18016 NW 40th Ct, Miami Gardens, FL 33055
$-418
Cash flow
-6.1%
Cash-on-Cash Return
4.7%
Cap rate
0.8%
Rent to Value Ratio

Active
$680,000
4
bds
|
2
ba
|
1,652
sqft
|
built
1995
5259 NW 184th Ln, Miami Gardens, FL 33055
$-1,419
Cash flow
-10.9%
Cash-on-Cash Return
3.6%
Cap rate
0.5%
Rent to Value Ratio

Active
$350,000
3
bds
|
2
ba
|
1,120
sqft
|
built
1983
18044 NW 41st Pl, Miami Gardens, FL 33055
$-452
Cash flow
-6.7%
Cash-on-Cash Return
4.7%
Cap rate
0.7%
Rent to Value Ratio
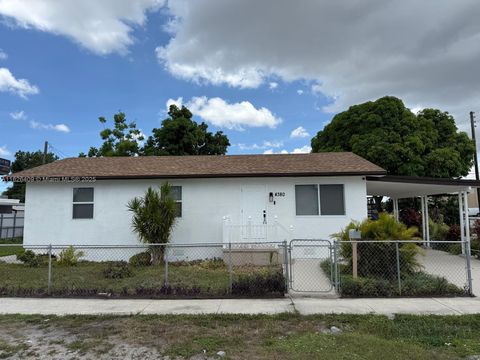
Active
$515,000
3
bds
|
1
ba
|
1,032
sqft
|
built
1970
4380 NW 168th Ter, Miami Gardens, FL 33055
$-693
Cash flow
-7.0%
Cash-on-Cash Return
4.7%
Cap rate
0.6%
Rent to Value Ratio

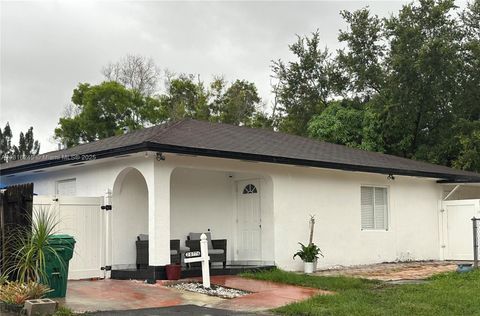
Active
$569,000
3
bds
|
1
ba
|
1,154
sqft
|
built
1960
18930 NW 43rd Ave, Miami Gardens, FL 33055
$-909
Cash flow
-8.3%
Cash-on-Cash Return
4.2%
Cap rate
0.6%
Rent to Value Ratio

Active
$585,000
3
bds
|
2
ba
|
1,500
sqft
|
built
1954
3811 NW 173rd Ter, Miami Gardens, FL 33055
$-1,901
Cash flow
-17.0%
Cash-on-Cash Return
2.2%
Cap rate
0.5%
Rent to Value Ratio

Active
$620,000
4
bds
|
2
ba
|
1,195
sqft
|
built
1959
19320 NW 47th Ave, Miami Gardens, FL 33055
$-1,499
Cash flow
-12.6%
Cash-on-Cash Return
3.2%
Cap rate
0.5%
Rent to Value Ratio
Active
$564,900
4
bds
|
2
ba
|
1,425
sqft
|
built
2001
20776 NW 41st Avenue Rd, Miami Gardens, FL 33055
$-1,397
Cash flow
-12.9%
Cash-on-Cash Return
3.2%
Cap rate
0.5%
Rent to Value Ratio

Active
$579,000
3
bds
|
2
ba
|
1,242
sqft
|
built
1955
3931 NW 172nd Ter, Miami Gardens, FL 33055
$-1,389
Cash flow
-12.5%
Cash-on-Cash Return
3.3%
Cap rate
0.6%
Rent to Value Ratio

Active
$650,000
6
bds
|
4
ba
|
2,506
sqft
|
built
1958
17435 NW 48th Ct, Miami Gardens, FL 33055
$-999
Cash flow
-8.0%
Cash-on-Cash Return
4.3%
Cap rate
0.6%
Rent to Value Ratio

Active
$799,000
6
bds
|
4
ba
|
2,292
sqft
|
built
1959
5350 NW 183rd St, Miami Gardens, FL 33055
$-1,874
Cash flow
-12.2%
Cash-on-Cash Return
3.3%
Cap rate
0.5%
Rent to Value Ratio
Active
$590,000
2
bds
|
1
ba
|
1,382
sqft
|
built
1963
18601 NW 38th Ave, Miami Gardens, FL 33055
$-986
Cash flow
-8.7%
Cash-on-Cash Return
4.1%
Cap rate
0.5%
Rent to Value Ratio
Active
$255,000
1
bds
|
1
ba
|
633
sqft
|
built
1969
17101 NW 57th Ave, Miami Gardens, FL 33055
$-326
Cash flow
-6.7%
Cash-on-Cash Return
4.6%
Cap rate
0.8%
Rent to Value Ratio
Active
$649,900
5
bds
|
3
ba
|
1,494
sqft
|
built
1955
3745 NW 171st Ter, Miami Gardens, FL 33055
$-1,895
Cash flow
-15.2%
Cash-on-Cash Return
2.6%
Cap rate
0.5%
Rent to Value Ratio
Active
$450,000
3
bds
|
2
ba
|
1,346
sqft
|
built
1976
19423 NW 53rd Pl, Miami Gardens, FL 33055
$-477
Cash flow
-5.5%
Cash-on-Cash Return
4.9%
Cap rate
0.6%
Rent to Value Ratio

Active
$399,900
2
bds
|
2
ba
|
1,030
sqft
|
built
1981
18719 NW 45th Ave, Miami Gardens, FL 33055
$-863
Cash flow
-11.3%
Cash-on-Cash Return
3.6%
Cap rate
0.7%
Rent to Value Ratio

Active
$795,000
4
bds
|
2
ba
|
1,473
sqft
|
built
1971
19631 NW 45th Ave, Miami Gardens, FL 33055
$-2,084
Cash flow
-13.7%
Cash-on-Cash Return
3.0%
Cap rate
0.5%
Rent to Value Ratio
Active
$560,000
3
bds
|
2
ba
|
1,334
sqft
|
built
1972
3800 NW 208th St, Miami Gardens, FL 33055
$-1,605
Cash flow
-15.0%
Cash-on-Cash Return
2.7%
Cap rate
0.5%
Rent to Value Ratio
Active
$620,000
3
bds
|
2
ba
|
1,692
sqft
|
built
1995
18625 NW 53rd Ave, Miami Gardens, FL 33055
$-1,801
Cash flow
-15.2%
Cash-on-Cash Return
2.7%
Cap rate
0.6%
Rent to Value Ratio

Active
$599,500
3
bds
|
2
ba
|
1,538
sqft
|
built
1961
18740 NW 42nd Pl, Miami Gardens, FL 33055
$-1,703
Cash flow
-14.8%
Cash-on-Cash Return
2.7%
Cap rate
0.5%
Rent to Value Ratio
Active
$699,900
4
bds
|
2
ba
|
2,111
sqft
|
built
1973
19704 NW 48th Ct, Miami Gardens, FL 33055
$-1,308
Cash flow
-9.8%
Cash-on-Cash Return
3.9%
Cap rate
0.5%
Rent to Value Ratio

Active
$510,000
3
bds
|
1
ba
|
1,012
sqft
|
built
1971
4494 NW 203rd St, Miami Gardens, FL 33055
$-1,030
Cash flow
-10.5%
Cash-on-Cash Return
3.7%
Cap rate
0.6%
Rent to Value Ratio

Active
$475,000
3
bds
|
2
ba
|
1,157
sqft
|
built
1983
5154 NW 194th Ln, Miami Gardens, FL 33055
$-761
Cash flow
-8.4%
Cash-on-Cash Return
4.2%
Cap rate
0.7%
Rent to Value Ratio

Active
$595,000
3
bds
|
1
ba
|
1,262
sqft
|
built
1957
4430 NW 175th St, Miami Gardens, FL 33055
$-1,103
Cash flow
-9.7%
Cash-on-Cash Return
3.9%
Cap rate
0.6%
Rent to Value Ratio

Active
$679,000
4
bds
|
2
ba
|
1,012
sqft
|
built
1970
5020 NW 170th St, Miami Gardens, FL 33055
$-1,909
Cash flow
-14.7%
Cash-on-Cash Return
2.8%
Cap rate
0.5%
Rent to Value Ratio

Active
$360,000
3
bds
|
2
ba
|
1,209
sqft
|
built
1991
3793 NW 213th Ter, Miami Gardens, FL 33055
$-575
Cash flow
-8.3%
Cash-on-Cash Return
4.2%
Cap rate
0.7%
Rent to Value Ratio

Active
$539,000
3
bds
|
3
ba
|
1,556
sqft
|
built
1994
5259 NW 186th Ln, Miami Gardens, FL 33055
$-936
Cash flow
-9.1%
Cash-on-Cash Return
4.1%
Cap rate
0.7%
Rent to Value Ratio

Active
$610,000
4
bds
|
2
ba
|
1,482
sqft
|
built
1959
18420 NW 42nd Ave, Miami Gardens, FL 33055
$-1,495
Cash flow
-12.8%
Cash-on-Cash Return
3.2%
Cap rate
0.5%
Rent to Value Ratio

Active
$549,999
3
bds
|
1
ba
|
1,599
sqft
|
built
1957
17930 NW 42nd Pl, Miami Gardens, FL 33055
$-848
Cash flow
-8.0%
Cash-on-Cash Return
4.3%
Cap rate
0.6%
Rent to Value Ratio

Active
$469,000
3
bds
|
1
ba
|
1,012
sqft
|
built
1970
18730 NW 47th Ave, Miami Gardens, FL 33055
$-583
Cash flow
-6.5%
Cash-on-Cash Return
4.7%
Cap rate
0.7%
Rent to Value Ratio

Active
$530,000
3
bds
|
2
ba
|
1,092
sqft
|
built
1970
4255 NW 170th St, Miami Gardens, FL 33055
$-1,149
Cash flow
-11.3%
Cash-on-Cash Return
3.5%
Cap rate
0.6%
Rent to Value Ratio
Active
$535,000
3
bds
|
1
ba
|
1,788
sqft
|
built
1971
4452 NW 204th St, Miami Gardens, FL 33055
$-727
Cash flow
-7.1%
Cash-on-Cash Return
4.5%
Cap rate
0.6%
Rent to Value Ratio

Active
$640,000
5
bds
|
3
ba
|
1,645
sqft
|
built
1958
18600 NW 42nd Pl, Miami Gardens, FL 33055
$-1,481
Cash flow
-12.1%
Cash-on-Cash Return
3.4%
Cap rate
0.5%
Rent to Value Ratio
Active
$630,000
3
bds
|
2
ba
|
1,222
sqft
|
built
1958
4410 NW 174th Dr, Miami Gardens, FL 33055
$-1,063
Cash flow
-8.8%
Cash-on-Cash Return
4.1%
Cap rate
0.6%
Rent to Value Ratio
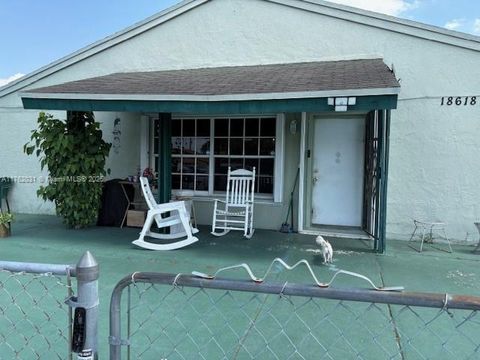
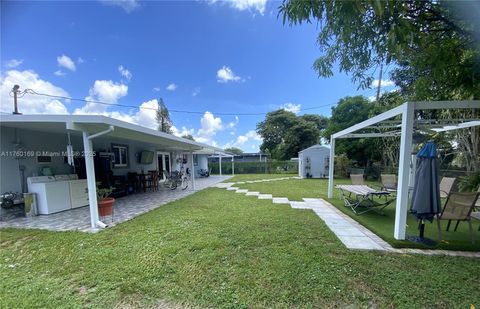
Active
$415,000
4
bds
|
2
ba
|
1,260
sqft
|
built
1982
18618 NW 45th Ave, Miami Gardens, FL 33055
$-273
Cash flow
-3.4%
Cash-on-Cash Return
5.4%
Cap rate
0.7%
Rent to Value Ratio

Active
$800,000
4
bds
|
2
ba
|
1,688
sqft
|
built
1972
20630 NW 37th Ct, Miami Gardens, FL 33055
$-2,607
Cash flow
-17.0%
Cash-on-Cash Return
2.2%
Cap rate
0.4%
Rent to Value Ratio

Active
$519,900
3
bds
|
2
ba
|
1,150
sqft
|
built
1955
3851 NW 172nd Ter, Miami Gardens, FL 33055
$-865
Cash flow
-8.7%
Cash-on-Cash Return
4.2%
Cap rate
0.7%
Rent to Value Ratio