33065 Investment Properties for Sale
Browse homes for sale and investment properties in 33065. Refine your search by price, property type, or more.
Best cash flowing properties in 33065
Active
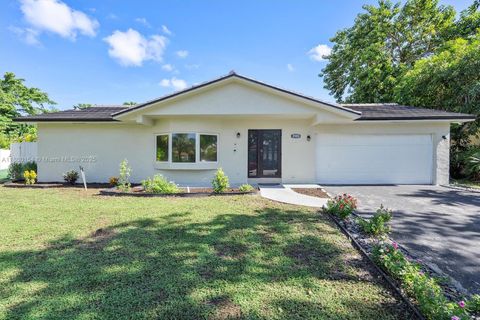
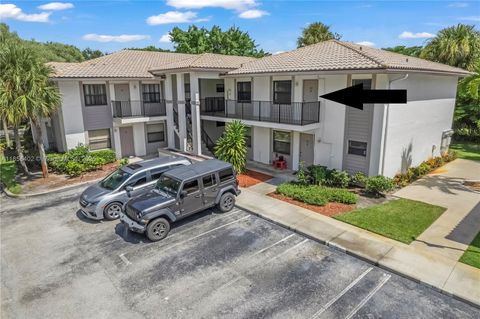
$149,000
2
bds
|
2
ba
|
1,085
sqft
|
built
1974
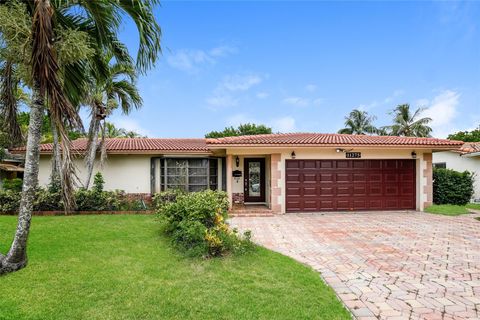
4113 NW 88th Ave, Coral Springs, FL 33065
$102
Cash flow
3.6%
Cash-on-Cash Return
7.0%
Cap rate
1.2%
Rent to Value Ratio
Active
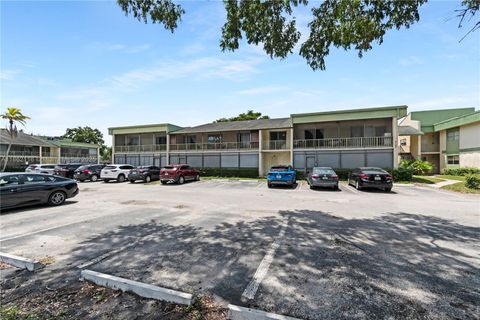
$135,000
1
bds
|
2
ba
|
690
sqft
|
built
1979
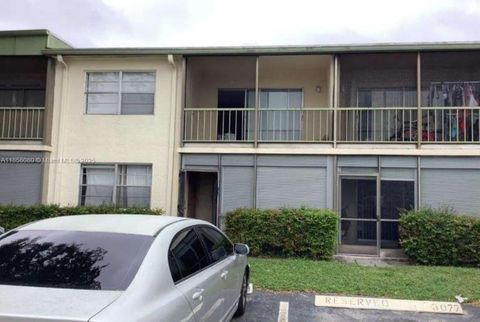
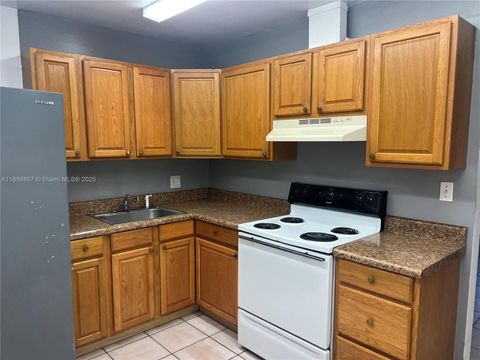
4149 NW 90th Ave, Coral Springs, FL 33065
$41
Cash flow
1.6%
Cash-on-Cash Return
6.5%
Cap rate
1.2%
Rent to Value Ratio
204 out of 267 properties for sale in 33065
Limited Results Shown
Create a free account, or log in to reveal all property listings and enjoy the complete experience.
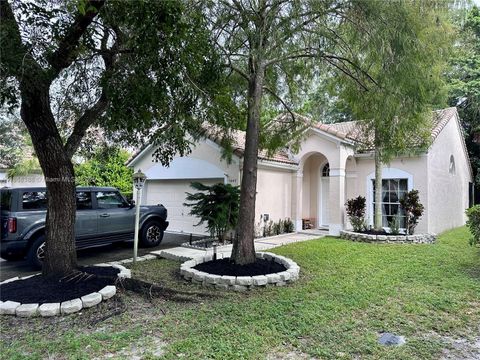
Active
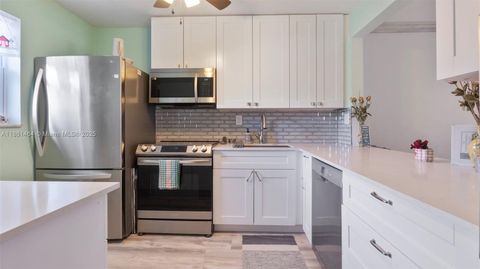
$345,000
3
bds
|
3
ba
|
1,720
sqft
|
built
1982
4299 Coral Springs Dr, Coral Springs, FL 33065
$-661
Cash flow
-10.0%
Cash-on-Cash Return
3.8%
Cap rate
0.8%
Rent to Value Ratio

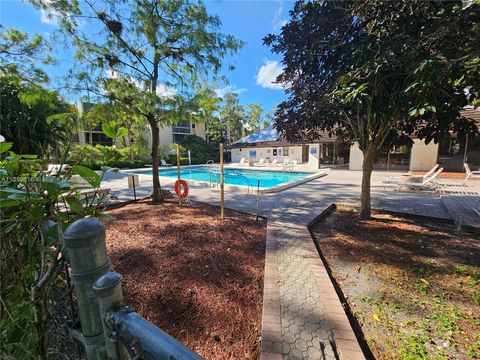
Active
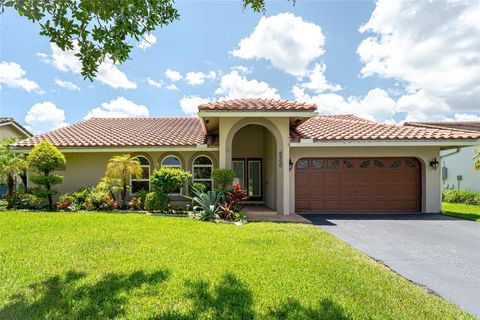
$785,000
5
bds
|
3
ba
|
2,822
sqft
|
built
1973
4320 NW 107th Ave, Coral Springs, FL 33065
$-2,705
Cash flow
-18.0%
Cash-on-Cash Return
2.0%
Cap rate
0.4%
Rent to Value Ratio
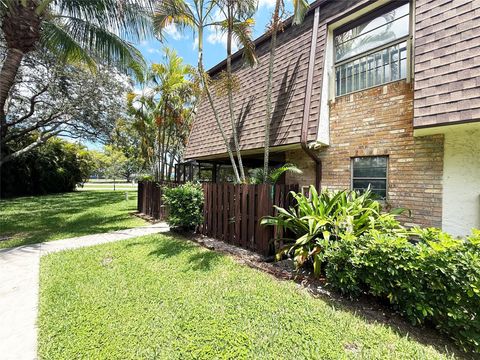
Active
$617,900
3
bds
|
2
ba
|
2,024
sqft
|
built
1972
2757 NW 83rd Ter, Coral Springs, FL 33065
$-1,551
Cash flow
-13.1%
Cash-on-Cash Return
3.1%
Cap rate
0.6%
Rent to Value Ratio
Active
$675,000
3
bds
|
2
ba
|
1,856
sqft
|
built
1973
8555 NW 25th Pl, Coral Springs, FL 33065
$-1,104
Cash flow
-8.5%
Cash-on-Cash Return
4.2%
Cap rate
0.7%
Rent to Value Ratio
Active
$165,000
2
bds
|
2
ba
|
1,085
sqft
|
built
1975
4133 NW 88th Ave, Coral Springs, FL 33065
$-95
Cash flow
-3.0%
Cash-on-Cash Return
5.5%
Cap rate
1.2%
Rent to Value Ratio
Active
$179,000
2
bds
|
2
ba
|
1,000
sqft
|
built
1975
8605 W Sample Rd, Coral Springs, FL 33065
$-575
Cash flow
-16.8%
Cash-on-Cash Return
2.3%
Cap rate
1.1%
Rent to Value Ratio
Active
$625,000
3
bds
|
2
ba
|
1,884
sqft
|
built
1994
8950 NW 45th Ct, Coral Springs, FL 33065
$-623
Cash flow
-5.2%
Cash-on-Cash Return
5.0%
Cap rate
0.7%
Rent to Value Ratio
Active
$260,000
3
bds
|
2
ba
|
1,080
sqft
|
built
1988
11160 W Sample Rd, Coral Springs, FL 33065
$-979
Cash flow
-19.6%
Cash-on-Cash Return
1.6%
Cap rate
0.7%
Rent to Value Ratio
Active
$522,500
3
bds
|
2
ba
|
1,318
sqft
|
built
1993
3947 Jasmine Ln, Coral Springs, FL 33065
$-1,157
Cash flow
-11.6%
Cash-on-Cash Return
3.5%
Cap rate
0.6%
Rent to Value Ratio
Active
$209,000
2
bds
|
2
ba
|
1,068
sqft
|
built
1978
8429 Forest Hills Dr, Coral Springs, FL 33065
$-523
Cash flow
-13.1%
Cash-on-Cash Return
3.1%
Cap rate
1.0%
Rent to Value Ratio

Active
$650,000
4
bds
|
3
ba
|
2,109
sqft
|
built
1972
2831 NW 88th Ter, Coral Springs, FL 33065
$-1,278
Cash flow
-10.3%
Cash-on-Cash Return
3.8%
Cap rate
0.6%
Rent to Value Ratio
Active
$365,000
3
bds
|
3
ba
|
1,434
sqft
|
built
1986
2561 NW 99th Ave, Coral Springs, FL 33065
$-736
Cash flow
-10.5%
Cash-on-Cash Return
3.7%
Cap rate
0.7%
Rent to Value Ratio

Active
$369,000
3
bds
|
3
ba
|
1,500
sqft
|
built
1980
9050 NW 28th St, Coral Springs, FL 33065
$-996
Cash flow
-14.1%
Cash-on-Cash Return
2.9%
Cap rate
0.8%
Rent to Value Ratio
Active
$565,000
4
bds
|
2
ba
|
1,769
sqft
|
built
1972
11275 NW 37th Ct, Coral Springs, FL 33065
$-1,003
Cash flow
-9.3%
Cash-on-Cash Return
4.0%
Cap rate
0.7%
Rent to Value Ratio

Active
$525,000
3
bds
|
3
ba
|
1,682
sqft
|
built
1993
3769 Wilderness Way, Coral Springs, FL 33065
$-1,732
Cash flow
-17.2%
Cash-on-Cash Return
2.2%
Cap rate
0.6%
Rent to Value Ratio
Active
$125,000
1
bds
|
2
ba
|
690
sqft
|
built
1979
4153 NW 90th Ave, Coral Springs, FL 33065
$-37
Cash flow
-1.5%
Cash-on-Cash Return
5.8%
Cap rate
1.1%
Rent to Value Ratio
Active
$699,000
4
bds
|
2
ba
|
2,028
sqft
|
built
1979
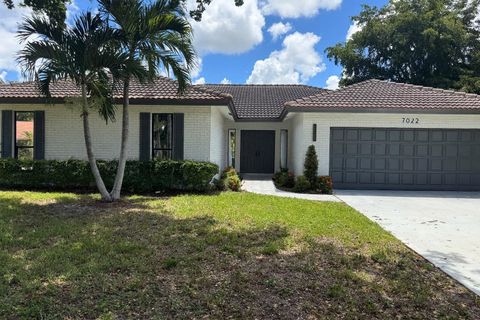
7022 NW 39th St, Coral Springs, FL 33065
$-382
Cash flow
-2.9%
Cash-on-Cash Return
5.5%
Cap rate
0.9%
Rent to Value Ratio
Active
$175,000
2
bds
|
1
ba
|
950
sqft
|
built
1969
9203 NW 38th Dr, Coral Springs, FL 33065
$-296
Cash flow
-8.8%
Cash-on-Cash Return
4.1%
Cap rate
1.0%
Rent to Value Ratio
Active
$425,000
3
bds
|
3
ba
|
1,434
sqft
|
built
1984
2678 NW 99th Ave, Coral Springs, FL 33065
$-1,110
Cash flow
-13.6%
Cash-on-Cash Return
3.0%
Cap rate
0.6%
Rent to Value Ratio
Active
$319,000
3
bds
|
3
ba
|
1,500
sqft
|
built
1980
9050 NW 28th St, Coral Springs, FL 33065
$-910
Cash flow
-14.9%
Cash-on-Cash Return
2.7%
Cap rate
0.8%
Rent to Value Ratio
Active
$649,900
4
bds
|
2
ba
|
1,780
sqft
|
built
1973
8695 NW 28th Dr, Coral Springs, FL 33065
$-1,687
Cash flow
-13.5%
Cash-on-Cash Return
3.0%
Cap rate
0.5%
Rent to Value Ratio
Active
$255,000
2
bds
|
2
ba
|
1,168
sqft
|
built
1981
2850 Forest Hills Blvd, Coral Springs, FL 33065
$-567
Cash flow
-11.6%
Cash-on-Cash Return
3.5%
Cap rate
0.8%
Rent to Value Ratio

Active
$470,000
4
bds
|
3
ba
|
1,939
sqft
|
built
1996
10172 Royal Palm Blvd, Coral Springs, FL 33065
$-1,253
Cash flow
-13.9%
Cash-on-Cash Return
2.9%
Cap rate
0.7%
Rent to Value Ratio
Active
$199,925
2
bds
|
2
ba
|
840
sqft
|
built
1984
11441 NW 39th Ct, Coral Springs, FL 33065
$-536
Cash flow
-14.0%
Cash-on-Cash Return
2.9%
Cap rate
1.0%
Rent to Value Ratio
Active
$125,000
1
bds
|
1
ba
|
468
sqft
|
built
1984
2701 Riverside Dr, Coral Springs, FL 33065
$-171
Cash flow
-7.1%
Cash-on-Cash Return
4.5%
Cap rate
1.1%
Rent to Value Ratio
Active
$179,000
2
bds
|
2
ba
|
1,059
sqft
|
built
1974
10701 Royal Palm Blvd, Coral Springs, FL 33065
$-453
Cash flow
-13.2%
Cash-on-Cash Return
3.1%
Cap rate
1.1%
Rent to Value Ratio
Active
$389,000
3
bds
|
3
ba
|
1,800
sqft
|
built
1984
4271 Coral Springs Dr, Coral Springs, FL 33065
$-922
Cash flow
-12.4%
Cash-on-Cash Return
3.3%
Cap rate
0.7%
Rent to Value Ratio
Active
$270,000
3
bds
|
2
ba
|
1,200
sqft
|
built
2003
2901 Riverside Dr, Coral Springs, FL 33065
$-963
Cash flow
-18.6%
Cash-on-Cash Return
1.9%
Cap rate
0.9%
Rent to Value Ratio
Active
$319,000
2
bds
|
3
ba
|
1,753
sqft
|
built
1971
8605 NW 35th Ct, Coral Springs, FL 33065
$-1,012
Cash flow
-16.6%
Cash-on-Cash Return
2.3%
Cap rate
0.8%
Rent to Value Ratio
Active
$685,000
4
bds
|
3
ba
|
2,598
sqft
|
built
1970
3881 NW 100th Ave, Coral Springs, FL 33065
$-1,258
Cash flow
-9.6%
Cash-on-Cash Return
3.9%
Cap rate
0.7%
Rent to Value Ratio

Active
$359,800
3
bds
|
3
ba
|
1,800
sqft
|
built
1981
8707 NW 35th St, Coral Springs, FL 33065
$-524
Cash flow
-7.6%
Cash-on-Cash Return
4.4%
Cap rate
0.9%
Rent to Value Ratio
Active
$224,900
2
bds
|
2
ba
|
950
sqft
|
built
1985
2568 Riverside Dr, Coral Springs, FL 33065
$-517
Cash flow
-12.0%
Cash-on-Cash Return
3.4%
Cap rate
0.9%
Rent to Value Ratio
Active
$720,000
5
bds
|
2
ba
|
2,103
sqft
|
built
1976
11957 NW 26th Pl, Coral Springs, FL 33065
$-1,687
Cash flow
-12.2%
Cash-on-Cash Return
3.3%
Cap rate
0.5%
Rent to Value Ratio
Active
$642,900
4
bds
|
2
ba
|
1,999
sqft
|
built
1973
11390 NW 37th St, Coral Springs, FL 33065
$-1,784
Cash flow
-14.5%
Cash-on-Cash Return
2.8%
Cap rate
0.6%
Rent to Value Ratio
Active
$325,000
2
bds
|
3
ba
|
1,284
sqft
|
built
1987
2644 NW 99th Ave, Coral Springs, FL 33065
$-648
Cash flow
-10.4%
Cash-on-Cash Return
3.8%
Cap rate
0.8%
Rent to Value Ratio
Active
$775,000
4
bds
|
3
ba
|
2,853
sqft
|
built
1973
8608 NW 26th Ct, Coral Springs, FL 33065
$-1,665
Cash flow
-11.2%
Cash-on-Cash Return
3.6%
Cap rate
0.6%
Rent to Value Ratio
Active
$109,999
1
bds
|
2
ba
|
690
sqft
|
built
1980
4167 NW 90th Ave, Coral Springs, FL 33065
$5
Cash flow
0.2%
Cash-on-Cash Return
6.2%
Cap rate
1.5%
Rent to Value Ratio
Active
$945,000
bds
|
0
ba
|
3,600
sqft
|
built
1974
4100 NW 110th Ave, Coral Springs, FL 33065
$-4,856
Cash flow
-26.8%
Cash-on-Cash Return
0.0%
Cap rate
0.2%
Rent to Value Ratio