33125 Investment Properties for Sale
Browse homes for sale and investment properties in 33125. Refine your search by price, property type, or more.
Best cash flowing properties in 33125

Active
$174,900
1
bds
|
1
ba
|
603
sqft
|
built
1963
2330 NW 11th St, Miami, FL 33125
$-218
Cash flow
-6.5%
Cash-on-Cash Return
4.7%
Cap rate
0.9%
Rent to Value Ratio
Active
$215,000
2
bds
|
1
ba
|
632
sqft
|
built
1972
747 NW 13th Ave, Miami, FL 33125
$-245
Cash flow
-5.9%
Cash-on-Cash Return
4.8%
Cap rate
0.9%
Rent to Value Ratio
85 out of 95 properties for sale in 33125
Limited Results Shown
Create a free account, or log in to reveal all property listings and enjoy the complete experience.
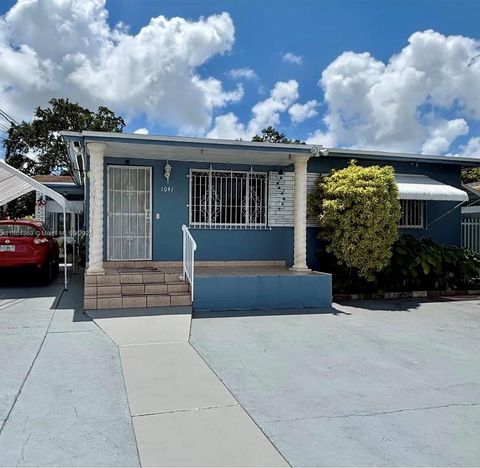
Active
$699,999
3
bds
|
0
ba
|
1,776
sqft
|
built
1962
1041 NW 33rd Ave, Miami, FL 33125
$-1,343
Cash flow
-10.0%
Cash-on-Cash Return
3.8%
Cap rate
0.5%
Rent to Value Ratio
Active
$730,000
6
bds
|
3
ba
|
2,473
sqft
|
built
1948
3281 NW 14th Ter, Miami, FL 33125
$-2,864
Cash flow
-20.5%
Cash-on-Cash Return
1.4%
Cap rate
0.3%
Rent to Value Ratio

Active
$765,000
4
bds
|
0
ba
|
1,770
sqft
|
built
1967
1709 NW 22nd Ct, Miami, FL 33125
$-2,852
Cash flow
-19.5%
Cash-on-Cash Return
1.7%
Cap rate
0.3%
Rent to Value Ratio

Active
$1,150,000
2
bds
|
0
ba
|
2,295
sqft
|
built
1955
1781 NW 19th St, Miami, FL 33125
$-4,814
Cash flow
-21.8%
Cash-on-Cash Return
1.1%
Cap rate
0.2%
Rent to Value Ratio

Active
$350,000
1
bds
|
1
ba
|
736
sqft
|
built
2005
60 NW 37th Ave, Miami, FL 33125
$-1,036
Cash flow
-15.4%
Cash-on-Cash Return
2.6%
Cap rate
0.7%
Rent to Value Ratio

Active
$480,000
2
bds
|
2
ba
|
1,022
sqft
|
built
2010
1861 NW South River Dr, Miami, FL 33125
$-2,091
Cash flow
-22.7%
Cash-on-Cash Return
0.9%
Cap rate
0.6%
Rent to Value Ratio
Active
$299,999
2
bds
|
2
ba
|
842
sqft
|
built
2006
2475 NW 16th Street Rd, Miami, FL 33125
$-876
Cash flow
-15.2%
Cash-on-Cash Return
2.6%
Cap rate
0.8%
Rent to Value Ratio
Active
$1,600,000
8
bds
|
0
ba
|
3,462
sqft
|
built
1975
1927 NW 20th Ave, Miami, FL 33125
$-7,631
Cash flow
-24.9%
Cash-on-Cash Return
0.4%
Cap rate
0.1%
Rent to Value Ratio
Active
$319,000
2
bds
|
2
ba
|
1,043
sqft
|
built
2006
1627 NW 18th St, Miami, FL 33125
$-666
Cash flow
-10.9%
Cash-on-Cash Return
3.6%
Cap rate
0.8%
Rent to Value Ratio
Active
$624,800
3
bds
|
2
ba
|
1,291
sqft
|
built
1941
3011 NW 1st St, Miami, FL 33125
$-1,559
Cash flow
-13.0%
Cash-on-Cash Return
3.2%
Cap rate
0.5%
Rent to Value Ratio

Active
$490,000
2
bds
|
2
ba
|
1,022
sqft
|
built
2010
1861 NW South River Dr, Miami, FL 33125
$-1,715
Cash flow
-18.3%
Cash-on-Cash Return
1.9%
Cap rate
0.8%
Rent to Value Ratio
Active
$579,000
5
bds
|
4
ba
|
1,400
sqft
|
built
1979
3301 NW 13th Ter, Miami, FL 33125
$-1,449
Cash flow
-13.1%
Cash-on-Cash Return
3.1%
Cap rate
0.5%
Rent to Value Ratio
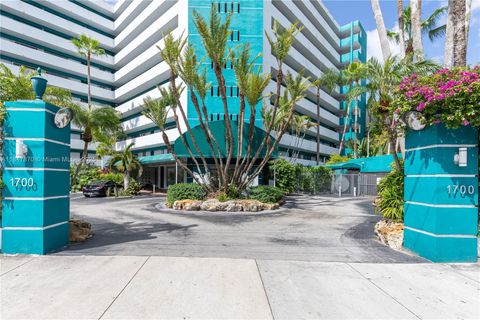
Active
$374,987
2
bds
|
2
ba
|
883
sqft
|
built
1982
1700 NW North River Dr, Miami, FL 33125
$-1,037
Cash flow
-14.4%
Cash-on-Cash Return
2.8%
Cap rate
0.6%
Rent to Value Ratio

Active
$495,000
2
bds
|
2
ba
|
1,474
sqft
|
built
1950
3450 NW 14th St, Miami, FL 33125
$-846
Cash flow
-8.9%
Cash-on-Cash Return
4.1%
Cap rate
0.6%
Rent to Value Ratio
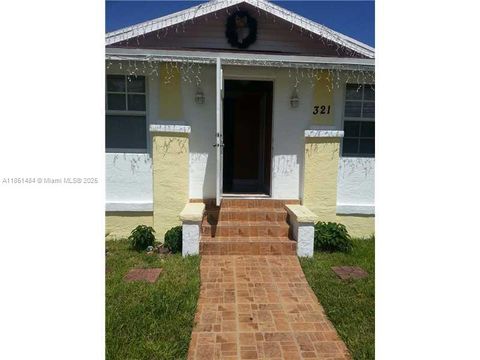
Active
$895,000
2
bds
|
1
ba
|
1,086
sqft
|
built
1923
321 NW 13th Ave, Miami, FL 33125
$-2,949
Cash flow
-17.2%
Cash-on-Cash Return
2.2%
Cap rate
0.3%
Rent to Value Ratio

Active
$715,000
3
bds
|
3
ba
|
1,322
sqft
|
built
1948
860 NW 17th Ct, Miami, FL 33125
$-1,592
Cash flow
-11.6%
Cash-on-Cash Return
3.5%
Cap rate
0.6%
Rent to Value Ratio
Active
$1,450,000
5
bds
|
0
ba
|
3,628
sqft
|
built
1925
600 NW 25th Ct, Miami, FL 33125
$-6,449
Cash flow
-23.2%
Cash-on-Cash Return
0.8%
Cap rate
0.2%
Rent to Value Ratio
Active
$349,000
2
bds
|
2
ba
|
883
sqft
|
built
1982
1700 NW North River Dr, Miami, FL 33125
$-1,106
Cash flow
-16.5%
Cash-on-Cash Return
2.3%
Cap rate
0.7%
Rent to Value Ratio

Active
$840,000
2
bds
|
0
ba
|
1,905
sqft
|
built
1935
2012 NW 2nd St, Miami, FL 33125
$-3,311
Cash flow
-20.6%
Cash-on-Cash Return
1.4%
Cap rate
0.3%
Rent to Value Ratio
Active
$240,000
2
bds
|
2
ba
|
767
sqft
|
built
1974
1800 NW 24th Ave, Miami, FL 33125
$-492
Cash flow
-10.7%
Cash-on-Cash Return
3.7%
Cap rate
0.9%
Rent to Value Ratio

Active
$380,000
2
bds
|
2
ba
|
1,000
sqft
|
built
1986
1740 NW North River Dr, Miami, FL 33125
$-1,404
Cash flow
-19.3%
Cash-on-Cash Return
1.7%
Cap rate
0.7%
Rent to Value Ratio
Active
$259,000
2
bds
|
1
ba
|
830
sqft
|
built
1986
1720 NW North River Dr, Miami, FL 33125
$-638
Cash flow
-12.9%
Cash-on-Cash Return
3.2%
Cap rate
1.0%
Rent to Value Ratio
Active
$232,500
2
bds
|
1
ba
|
603
sqft
|
built
1963
2330 NW 11th St, Miami, FL 33125
$-290
Cash flow
-6.5%
Cash-on-Cash Return
4.7%
Cap rate
0.9%
Rent to Value Ratio
Active
$290,000
1
bds
|
1
ba
|
0
sqft
|
built
1974
1800 NW 24th Ave, Miami, FL 33125
$-787
Cash flow
-14.2%
Cash-on-Cash Return
2.9%
Cap rate
0.7%
Rent to Value Ratio
Active
$633,500
2
bds
|
1
ba
|
1,100
sqft
|
built
1947
1030 NW 30th Ave, Miami, FL 33125
$-1,270
Cash flow
-10.5%
Cash-on-Cash Return
3.7%
Cap rate
0.5%
Rent to Value Ratio

Active
$375,000
2
bds
|
2
ba
|
967
sqft
|
built
2010
1861 NW South River Dr, Miami, FL 33125
$-1,447
Cash flow
-20.1%
Cash-on-Cash Return
1.5%
Cap rate
0.8%
Rent to Value Ratio
Active
$996,000
6
bds
|
0
ba
|
2,920
sqft
|
built
1976
1136 NW 34th Ave, Miami, FL 33125
$-4,503
Cash flow
-23.6%
Cash-on-Cash Return
0.7%
Cap rate
0.3%
Rent to Value Ratio
Active
$270,000
1
bds
|
1
ba
|
637
sqft
|
built
2010
1871 NW South River Dr, Miami, FL 33125
$-795
Cash flow
-15.4%
Cash-on-Cash Return
2.6%
Cap rate
0.9%
Rent to Value Ratio
Active
$328,000
1
bds
|
2
ba
|
804
sqft
|
built
2010
1871 NW South River Dr, Miami, FL 33125
$-1,608
Cash flow
-25.6%
Cash-on-Cash Return
0.3%
Cap rate
0.7%
Rent to Value Ratio
Active
$700,000
3
bds
|
2
ba
|
1,208
sqft
|
built
1956
201 NW 14th Ave, Miami, FL 33125
$-1,033
Cash flow
-7.7%
Cash-on-Cash Return
4.4%
Cap rate
0.6%
Rent to Value Ratio
Active
$649,000
3
bds
|
2
ba
|
1,334
sqft
|
built
1946
1232 NW 32nd Pl, Miami, FL 33125
$-1,393
Cash flow
-11.2%
Cash-on-Cash Return
3.6%
Cap rate
0.5%
Rent to Value Ratio
Active
$599,000
3
bds
|
2
ba
|
1,384
sqft
|
built
1944
511 NW 33rd Ave, Miami, FL 33125
$-1,180
Cash flow
-10.3%
Cash-on-Cash Return
3.8%
Cap rate
0.6%
Rent to Value Ratio

Active
$1,200,000
6
bds
|
0
ba
|
0
sqft
|
built
1936
2247 NW 2nd St, Miami, FL 33125
$-4,599
Cash flow
-20.0%
Cash-on-Cash Return
1.5%
Cap rate
0.3%
Rent to Value Ratio
Active
$1,450,000
8
bds
|
0
ba
|
3,148
sqft
|
built
1975
37 NW 19th Ave, Miami, FL 33125
$-7,181
Cash flow
-25.8%
Cash-on-Cash Return
0.2%
Cap rate
0.1%
Rent to Value Ratio

Active
$665,000
2
bds
|
2
ba
|
1,945
sqft
|
built
1951
3082 NW 4th St, Miami, FL 33125
$-1,038
Cash flow
-8.1%
Cash-on-Cash Return
4.3%
Cap rate
0.5%
Rent to Value Ratio

Active
$320,000
2
bds
|
2
ba
|
767
sqft
|
built
1974
1800 NW 24th Ave, Miami, FL 33125
$-786
Cash flow
-12.8%
Cash-on-Cash Return
3.2%
Cap rate
0.8%
Rent to Value Ratio
Active
$1,495,000
8
bds
|
0
ba
|
3,728
sqft
|
built
1978
1621 NW 16th St, Miami, FL 33125
$-7,160
Cash flow
-25.0%
Cash-on-Cash Return
0.4%
Cap rate
0.2%
Rent to Value Ratio

Active
$820,000
3
bds
|
2
ba
|
1,470
sqft
|
built
1954
3430 NW 16th St, Miami, FL 33125
$-2,311
Cash flow
-14.7%
Cash-on-Cash Return
2.8%
Cap rate
0.4%
Rent to Value Ratio