33126 Investment Properties for Sale
Browse homes for sale and investment properties in 33126. Refine your search by price, property type, or more.
Best cash flowing properties in 33126

Active
$180,000
1
bds
|
1
ba
|
624
sqft
|
built
1973
5050 NW 7th St, Miami, FL 33126
$-100
Cash flow
-2.9%
Cash-on-Cash Return
5.5%
Cap rate
1.0%
Rent to Value Ratio
Active
$185,000
1
bds
|
1
ba
|
506
sqft
|
built
1973
5050 NW 7th St, Miami, FL 33126
$-205
Cash flow
-5.8%
Cash-on-Cash Return
4.8%
Cap rate
0.9%
Rent to Value Ratio
98 out of 123 properties for sale in 33126
Limited Results Shown
Create a free account, or log in to reveal all property listings and enjoy the complete experience.
Active
$329,000
2
bds
|
3
ba
|
1,020
sqft
|
built
1996
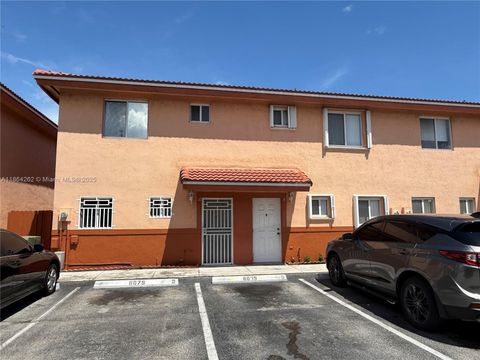
8079 NW 8th St, Miami, FL 33126
$-277
Cash flow
-4.4%
Cash-on-Cash Return
5.1%
Cap rate
0.8%
Rent to Value Ratio

Active
$750,000
3
bds
|
2
ba
|
1,290
sqft
|
built
1961
260 NW 57th Ct, Miami, FL 33126
$-1,974
Cash flow
-13.7%
Cash-on-Cash Return
3.0%
Cap rate
0.5%
Rent to Value Ratio

Active
$720,000
4
bds
|
3
ba
|
1,790
sqft
|
built
1955
7330 NW 6th St, Miami, FL 33126
$-1,764
Cash flow
-12.8%
Cash-on-Cash Return
3.2%
Cap rate
0.5%
Rent to Value Ratio
Active
$779,000
4
bds
|
2
ba
|
1,462
sqft
|
built
1948
941 NW 40th Ave, Miami, FL 33126
$-1,684
Cash flow
-11.3%
Cash-on-Cash Return
3.6%
Cap rate
0.5%
Rent to Value Ratio

Active
$310,000
2
bds
|
2
ba
|
986
sqft
|
built
1984
8500 NW 8th St, Miami, FL 33126
$-420
Cash flow
-7.1%
Cash-on-Cash Return
4.5%
Cap rate
0.7%
Rent to Value Ratio

Active
$465,000
2
bds
|
2
ba
|
874
sqft
|
built
1953
411 NW 59th Ct, Miami, FL 33126
$-463
Cash flow
-5.2%
Cash-on-Cash Return
5.0%
Cap rate
0.7%
Rent to Value Ratio
Active
$330,000
2
bds
|
2
ba
|
1,099
sqft
|
built
1977
8501 NW 8th St, Miami, FL 33126
$-353
Cash flow
-5.6%
Cash-on-Cash Return
4.9%
Cap rate
0.8%
Rent to Value Ratio

Active
$355,000
3
bds
|
2
ba
|
1,208
sqft
|
built
1984
8401 NW 8th St, Miami, FL 33126
$-536
Cash flow
-7.9%
Cash-on-Cash Return
4.3%
Cap rate
0.8%
Rent to Value Ratio
Active
$580,000
2
bds
|
1
ba
|
1,183
sqft
|
built
1960
7230 NW 5th St, Miami, FL 33126
$-1,711
Cash flow
-15.4%
Cash-on-Cash Return
2.6%
Cap rate
0.6%
Rent to Value Ratio

Active
$937,000
5
bds
|
0
ba
|
2,172
sqft
|
built
1984
97 NW 47th Ct, Miami, FL 33126
$-3,247
Cash flow
-18.1%
Cash-on-Cash Return
2.0%
Cap rate
0.3%
Rent to Value Ratio

Active
$629,900
3
bds
|
2
ba
|
2,145
sqft
|
built
1980
261 NW 59th Ct, Miami, FL 33126
$-1,474
Cash flow
-12.2%
Cash-on-Cash Return
3.3%
Cap rate
0.6%
Rent to Value Ratio
Active
$569,000
2
bds
|
1
ba
|
1,183
sqft
|
built
1961
221 NW 59th Ave, Miami, FL 33126
$-1,038
Cash flow
-9.5%
Cash-on-Cash Return
4.0%
Cap rate
0.6%
Rent to Value Ratio

Active
$614,600
3
bds
|
2
ba
|
1,172
sqft
|
built
1960
250 NW 61st Ave, Miami, FL 33126
$-1,015
Cash flow
-8.6%
Cash-on-Cash Return
4.2%
Cap rate
0.6%
Rent to Value Ratio

Active
$205,000
1
bds
|
1
ba
|
605
sqft
|
built
1972
4550 NW 9th St, Miami, FL 33126
$-506
Cash flow
-12.9%
Cash-on-Cash Return
3.2%
Cap rate
0.9%
Rent to Value Ratio

Active
$395,000
2
bds
|
3
ba
|
1,250
sqft
|
built
1996
8260 NW 10th St, Miami, FL 33126
$-866
Cash flow
-11.4%
Cash-on-Cash Return
3.5%
Cap rate
0.7%
Rent to Value Ratio

Active
$450,000
2
bds
|
2
ba
|
1,009
sqft
|
built
2006
4242 NW 2nd St, Miami, FL 33126
$-1,311
Cash flow
-15.2%
Cash-on-Cash Return
2.7%
Cap rate
0.6%
Rent to Value Ratio

Active
$285,000
2
bds
|
2
ba
|
935
sqft
|
built
1973
5055 NW 7th St, Miami, FL 33126
$-691
Cash flow
-12.6%
Cash-on-Cash Return
3.2%
Cap rate
0.7%
Rent to Value Ratio
Active
$425,000
2
bds
|
2
ba
|
1,028
sqft
|
built
2006
117 NW 42nd Ave, Miami, FL 33126
$-943
Cash flow
-11.6%
Cash-on-Cash Return
3.5%
Cap rate
0.7%
Rent to Value Ratio

Active
$375,000
2
bds
|
1
ba
|
1,023
sqft
|
built
2003
5091 NW 7th St, Miami, FL 33126
$-1,176
Cash flow
-16.4%
Cash-on-Cash Return
2.4%
Cap rate
0.7%
Rent to Value Ratio

Active
$365,000
2
bds
|
3
ba
|
1,020
sqft
|
built
1996
8085 NW 8th St, Miami, FL 33126
$-751
Cash flow
-10.7%
Cash-on-Cash Return
3.7%
Cap rate
0.7%
Rent to Value Ratio
Active
$369,000
3
bds
|
2
ba
|
1,208
sqft
|
built
1984
8425 NW 8th St, Miami, FL 33126
$-761
Cash flow
-10.8%
Cash-on-Cash Return
3.7%
Cap rate
0.7%
Rent to Value Ratio

Active
$250,000
1
bds
|
1
ba
|
708
sqft
|
built
1972
495 NW 72nd Ave, Miami, FL 33126
$-602
Cash flow
-12.6%
Cash-on-Cash Return
3.3%
Cap rate
0.7%
Rent to Value Ratio

Active
$265,000
2
bds
|
2
ba
|
935
sqft
|
built
1973
5055 NW 7th St, Miami, FL 33126
$-310
Cash flow
-6.1%
Cash-on-Cash Return
4.7%
Cap rate
0.9%
Rent to Value Ratio

Active
$899,000
3
bds
|
2
ba
|
1,700
sqft
|
built
1962
480 NW 53rd Ave, Miami, FL 33126
$-2,451
Cash flow
-14.2%
Cash-on-Cash Return
2.9%
Cap rate
0.5%
Rent to Value Ratio

Active
$1,250,000
5
bds
|
4
ba
|
2,071
sqft
|
built
1990
66 NW 73rd Pl, Miami, FL 33126
$-3,358
Cash flow
-14.0%
Cash-on-Cash Return
2.9%
Cap rate
0.4%
Rent to Value Ratio

Active
$210,000
1
bds
|
1
ba
|
605
sqft
|
built
1972
801 NW 47th Ave, Miami, FL 33126
$-571
Cash flow
-14.2%
Cash-on-Cash Return
2.9%
Cap rate
0.8%
Rent to Value Ratio

Active
$320,000
2
bds
|
2
ba
|
992
sqft
|
built
1988
8251 NW 8th St, Miami, FL 33126
$-786
Cash flow
-12.8%
Cash-on-Cash Return
3.2%
Cap rate
0.7%
Rent to Value Ratio

Active
$280,000
2
bds
|
2
ba
|
870
sqft
|
built
1988
8075 NW 7th St, Miami, FL 33126
$-549
Cash flow
-10.2%
Cash-on-Cash Return
3.8%
Cap rate
0.8%
Rent to Value Ratio
Active
$850,000
3
bds
|
1
ba
|
3,174
sqft
|
built
1947
3915 NW 4th Ter, Miami, FL 33126
$-1,890
Cash flow
-11.6%
Cash-on-Cash Return
3.5%
Cap rate
0.5%
Rent to Value Ratio
Active
$440,000
3
bds
|
3
ba
|
1,780
sqft
|
built
1996
8260 NW 10th St, Miami, FL 33126
$-1,064
Cash flow
-12.6%
Cash-on-Cash Return
3.2%
Cap rate
0.7%
Rent to Value Ratio

Active
$410,000
2
bds
|
3
ba
|
1,090
sqft
|
built
1998
8366 NW 10th St, Miami, FL 33126
$-827
Cash flow
-10.5%
Cash-on-Cash Return
3.7%
Cap rate
0.6%
Rent to Value Ratio
Active
$265,000
2
bds
|
2
ba
|
1,030
sqft
|
built
1981
8635 NW 8th St, Miami, FL 33126
$-273
Cash flow
-5.4%
Cash-on-Cash Return
4.9%
Cap rate
0.9%
Rent to Value Ratio
Active
$350,000
1
bds
|
1
ba
|
696
sqft
|
built
2006
117 NW 42nd Ave, Miami, FL 33126
$-887
Cash flow
-13.2%
Cash-on-Cash Return
3.1%
Cap rate
0.7%
Rent to Value Ratio

Active
$285,000
2
bds
|
2
ba
|
848
sqft
|
built
1985
5249 NW 7th St, Miami, FL 33126
$-711
Cash flow
-13.0%
Cash-on-Cash Return
3.2%
Cap rate
0.8%
Rent to Value Ratio

Active
$270,000
2
bds
|
1
ba
|
840
sqft
|
built
1973
295 NW 72nd Ave, Miami, FL 33126
$-429
Cash flow
-8.3%
Cash-on-Cash Return
4.2%
Cap rate
0.8%
Rent to Value Ratio

Active
$1,100,000
7
bds
|
0
ba
|
3,031
sqft
|
built
1952
77 Northwest Blvd, Miami, FL 33126
$-4,416
Cash flow
-20.9%
Cash-on-Cash Return
1.3%
Cap rate
0.2%
Rent to Value Ratio
Active
$425,000
2
bds
|
2
ba
|
1,084
sqft
|
built
2006
4242 NW 2nd St, Miami, FL 33126
$-633
Cash flow
-7.8%
Cash-on-Cash Return
4.4%
Cap rate
0.7%
Rent to Value Ratio

Active
$3,000,000
8
bds
|
0
ba
|
3,768
sqft
|
built
1960
251 NW 57th Ave, Miami, FL 33126
$-14,684
Cash flow
-25.5%
Cash-on-Cash Return
0.3%
Cap rate
0.1%
Rent to Value Ratio