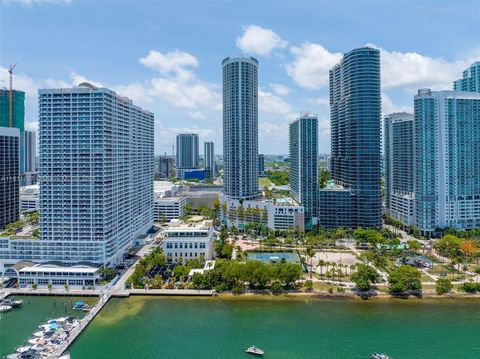
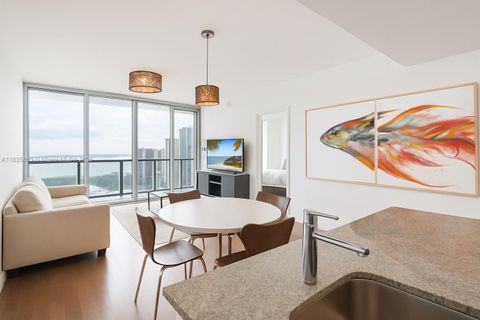
33132 Investment Properties for Sale
Browse homes for sale and investment properties in 33132. Refine your search by price, property type, or more.
Best cash flowing properties in 33132
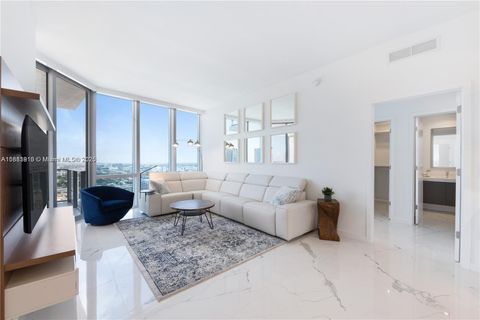
Active
$279,000
bds
|
1
ba
|
508
sqft
|
built
2007
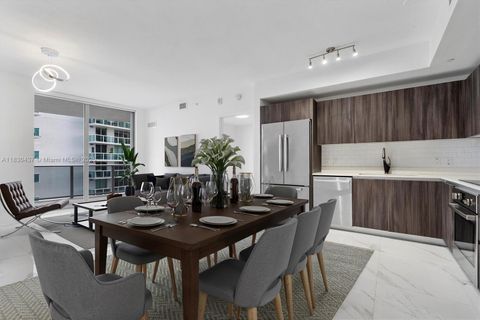
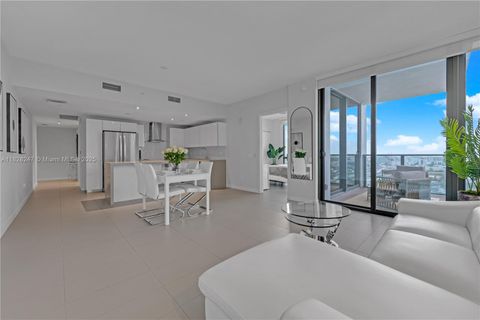
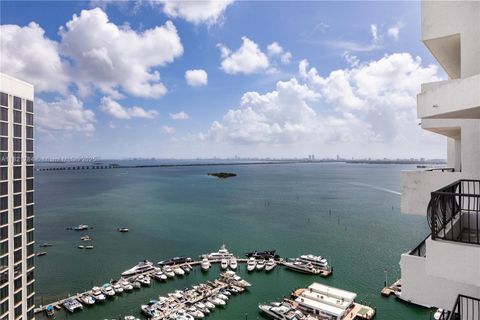
1750 N Bayshore Dr, Miami, FL 33132
$-656
Cash flow
-12.3%
Cash-on-Cash Return
3.3%
Cap rate
0.9%
Rent to Value Ratio
Active
$260,000
bds
|
1
ba
|
401
sqft
|
built
2007
1750 N Bayshore Dr, Miami, FL 33132
$-828
Cash flow
-16.6%
Cash-on-Cash Return
2.3%
Cap rate
0.9%
Rent to Value Ratio
396 out of 477 properties for sale in 33132
Limited Results Shown
Create a free account, or log in to reveal all property listings and enjoy the complete experience.
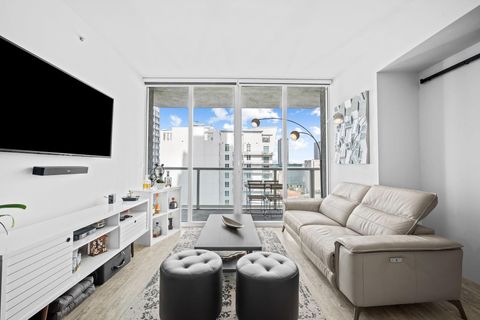
Active
$429,000
1
bds
|
2
ba
|
1,048
sqft
|
built
1986
1717 N Bayshore Dr, Miami, FL 33132
$-1,340
Cash flow
-16.3%
Cash-on-Cash Return
2.4%
Cap rate
0.8%
Rent to Value Ratio
Active
$1,699,000
2
bds
|
3
ba
|
1,802
sqft
|
built
2007
1040 Biscayne Blvd, Miami, FL 33132
$-7,935
Cash flow
-24.4%
Cash-on-Cash Return
0.5%
Cap rate
0.5%
Rent to Value Ratio
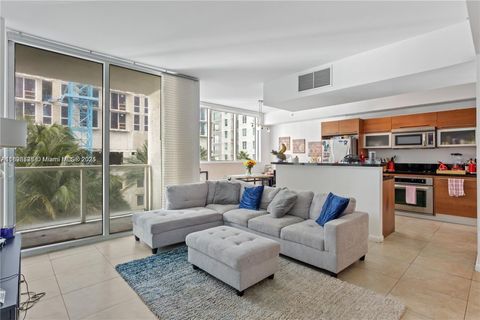
Active
$620,000
1
bds
|
2
ba
|
948
sqft
|
built
2008
888 Biscayne Blvd, Miami, FL 33132
$-2,112
Cash flow
-17.8%
Cash-on-Cash Return
2.1%
Cap rate
0.6%
Rent to Value Ratio

Active
$750,000
2
bds
|
3
ba
|
1,524
sqft
|
built
1986
1717 N Bayshore Dr, Miami, FL 33132
$-2,930
Cash flow
-20.4%
Cash-on-Cash Return
1.5%
Cap rate
0.7%
Rent to Value Ratio
Active
$669,900
2
bds
|
3
ba
|
1,038
sqft
|
built
2018
488 NE 18th St, Miami, FL 33132
$-1,249
Cash flow
-9.7%
Cash-on-Cash Return
3.9%
Cap rate
0.8%
Rent to Value Ratio
Active
$499,000
2
bds
|
2
ba
|
1,108
sqft
|
built
2007
50 Biscayne Blvd, Miami, FL 33132
$-2,036
Cash flow
-21.3%
Cash-on-Cash Return
1.3%
Cap rate
0.7%
Rent to Value Ratio
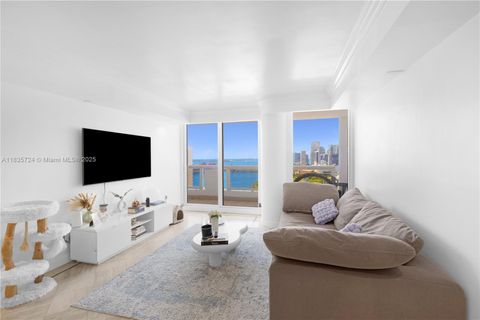
Active
$729,000
2
bds
|
2
ba
|
1,239
sqft
|
built
2008
1900 N Bayshore Dr, Miami, FL 33132
$-2,705
Cash flow
-19.4%
Cash-on-Cash Return
1.7%
Cap rate
0.6%
Rent to Value Ratio
Active
$525,000
1
bds
|
2
ba
|
759
sqft
|
built
2018
488 NE 18th St, Miami, FL 33132
$-1,346
Cash flow
-13.4%
Cash-on-Cash Return
3.1%
Cap rate
0.8%
Rent to Value Ratio
Active
$750,000
2
bds
|
2
ba
|
1,464
sqft
|
built
1986
1717 N Bayshore Dr, Miami, FL 33132
$-2,417
Cash flow
-16.8%
Cash-on-Cash Return
2.3%
Cap rate
0.7%
Rent to Value Ratio
Active
$399,900
1
bds
|
1
ba
|
888
sqft
|
built
2008
244 Biscayne Blvd, Miami, FL 33132
$-1,756
Cash flow
-22.9%
Cash-on-Cash Return
0.9%
Cap rate
0.7%
Rent to Value Ratio
Active
$649,000
1
bds
|
1
ba
|
430
sqft
|
built
2022
398 NE 5th St, Miami, FL 33132
$-2,010
Cash flow
-16.2%
Cash-on-Cash Return
2.4%
Cap rate
0.6%
Rent to Value Ratio
Active
$1,250,000
1
bds
|
2
ba
|
1,675
sqft
|
built
2009
1100 Biscayne Blvd, Miami, FL 33132
$-2,939
Cash flow
-12.3%
Cash-on-Cash Return
3.3%
Cap rate
0.6%
Rent to Value Ratio
Active
$590,000
2
bds
|
2
ba
|
882
sqft
|
built
2018
1600 NE 1st Ave, Miami, FL 33132
$-1,993
Cash flow
-17.6%
Cash-on-Cash Return
2.1%
Cap rate
0.7%
Rent to Value Ratio
Active
$864,995
3
bds
|
3
ba
|
1,494
sqft
|
built
2008
1900 N Bayshore Dr, Miami, FL 33132
$-2,594
Cash flow
-15.6%
Cash-on-Cash Return
2.5%
Cap rate
0.7%
Rent to Value Ratio
Active
$780,000
1
bds
|
1
ba
|
443
sqft
|
built
2022
398 NE 5th St, Miami, FL 33132
$-2,744
Cash flow
-18.4%
Cash-on-Cash Return
1.9%
Cap rate
0.5%
Rent to Value Ratio
Active
$650,000
2
bds
|
2
ba
|
1,315
sqft
|
built
2008
888 Biscayne Blvd, Miami, FL 33132
$-1,994
Cash flow
-16.0%
Cash-on-Cash Return
2.5%
Cap rate
0.8%
Rent to Value Ratio
Active
$435,000
1
bds
|
1
ba
|
806
sqft
|
built
2008
244 Biscayne Blvd, Miami, FL 33132
$-1,997
Cash flow
-24.0%
Cash-on-Cash Return
0.6%
Cap rate
0.7%
Rent to Value Ratio
Active
$750,000
1
bds
|
1
ba
|
430
sqft
|
built
2022
398 NE 5th St, Miami, FL 33132
$-2,559
Cash flow
-17.8%
Cash-on-Cash Return
2.1%
Cap rate
0.6%
Rent to Value Ratio
Active
$875,000
2
bds
|
2
ba
|
1,322
sqft
|
built
2007
50 Biscayne Blvd, Miami, FL 33132
$-3,947
Cash flow
-23.5%
Cash-on-Cash Return
0.7%
Cap rate
0.5%
Rent to Value Ratio
Active
$580,000
2
bds
|
2
ba
|
1,055
sqft
|
built
2018
1600 NE 1st Ave, Miami, FL 33132
$-1,533
Cash flow
-13.8%
Cash-on-Cash Return
3.0%
Cap rate
0.8%
Rent to Value Ratio
Active
$265,000
bds
|
1
ba
|
508
sqft
|
built
2007
1750 N Bayshore Dr, Miami, FL 33132
$-1,341
Cash flow
-26.4%
Cash-on-Cash Return
0.1%
Cap rate
0.8%
Rent to Value Ratio
Active
$475,000
1
bds
|
1
ba
|
845
sqft
|
built
2007
50 Biscayne Blvd, Miami, FL 33132
$-1,454
Cash flow
-16.0%
Cash-on-Cash Return
2.5%
Cap rate
0.7%
Rent to Value Ratio
Active
$3,295,000
4
bds
|
5
ba
|
3,292
sqft
|
built
2019
851 NE 1st Ave, Miami, FL 33132
$-22,186
Cash flow
-35.1%
Cash-on-Cash Return
-1.9%
Cap rate
0.3%
Rent to Value Ratio
Active
$1,075,000
2
bds
|
3
ba
|
1,498
sqft
|
built
2019
851 NE 1st Ave, Miami, FL 33132
$-4,801
Cash flow
-23.3%
Cash-on-Cash Return
0.8%
Cap rate
0.7%
Rent to Value Ratio
Active
$535,000
2
bds
|
2
ba
|
929
sqft
|
built
2008
244 Biscayne Blvd, Miami, FL 33132
$-2,015
Cash flow
-19.7%
Cash-on-Cash Return
1.6%
Cap rate
0.7%
Rent to Value Ratio
Active
$465,000
2
bds
|
2
ba
|
1,006
sqft
|
built
2008
253 NE 2nd St, Miami, FL 33132
$-1,991
Cash flow
-22.3%
Cash-on-Cash Return
1.0%
Cap rate
0.7%
Rent to Value Ratio

Active
$442,700
1
bds
|
1
ba
|
752
sqft
|
built
2018
1600 NE 1st Ave, Miami, FL 33132
$-1,638
Cash flow
-19.3%
Cash-on-Cash Return
1.7%
Cap rate
0.7%
Rent to Value Ratio
Active
$455,000
1
bds
|
2
ba
|
997
sqft
|
built
1986
1717 N Bayshore Dr, Miami, FL 33132
$-1,756
Cash flow
-20.1%
Cash-on-Cash Return
1.5%
Cap rate
0.6%
Rent to Value Ratio
Active
$2,188,000
3
bds
|
4
ba
|
2,018
sqft
|
built
2018
488 NE 18th St, Miami, FL 33132
$-8,747
Cash flow
-20.9%
Cash-on-Cash Return
1.3%
Cap rate
0.5%
Rent to Value Ratio
Active
$509,000
bds
|
0
ba
|
704
sqft
|
built
2019
851 NE 1st St, Miami, FL 33132
$-2,228
Cash flow
-22.8%
Cash-on-Cash Return
0.9%
Cap rate
0.7%
Rent to Value Ratio
Active
$684,900
2
bds
|
2
ba
|
1,293
sqft
|
built
2008
244 Biscayne Blvd, Miami, FL 33132
$-2,580
Cash flow
-19.7%
Cash-on-Cash Return
1.6%
Cap rate
0.7%
Rent to Value Ratio
Active
$410,000
1
bds
|
1
ba
|
794
sqft
|
built
2007
1900 N Bayshore Dr, Miami, FL 33132
$-1,195
Cash flow
-15.2%
Cash-on-Cash Return
2.6%
Cap rate
0.8%
Rent to Value Ratio

Active
$7,795,000
4
bds
|
6
ba
|
4,600
sqft
|
built
2019
1000 Biscayne Blvd, Miami, FL 33132
$-50,814
Cash flow
-34.0%
Cash-on-Cash Return
-1.7%
Cap rate
0.1%
Rent to Value Ratio
Active
$325,000
1
bds
|
2
ba
|
860
sqft
|
built
1980
555 NE 15th St, Miami, FL 33132
$-1,109
Cash flow
-17.8%
Cash-on-Cash Return
2.1%
Cap rate
1.0%
Rent to Value Ratio
Active
$715,000
2
bds
|
2
ba
|
1,239
sqft
|
built
2007
1900 N Bayshore Dr, Miami, FL 33132
$-2,629
Cash flow
-19.2%
Cash-on-Cash Return
1.7%
Cap rate
0.6%
Rent to Value Ratio
Active
$1,199,000
2
bds
|
3
ba
|
1,161
sqft
|
built
2018
488 NE 18th St, Miami, FL 33132
$-4,702
Cash flow
-20.5%
Cash-on-Cash Return
1.4%
Cap rate
0.5%
Rent to Value Ratio
Active
$914,900
2
bds
|
3
ba
|
1,498
sqft
|
built
2019
851 NE 1st St, Miami, FL 33132
$-4,579
Cash flow
-26.1%
Cash-on-Cash Return
0.1%
Cap rate
0.7%
Rent to Value Ratio
Active
$1,600,000
3
bds
|
3
ba
|
976
sqft
|
built
2022
398 NE 5th St, Miami, FL 33132
$-3,798
Cash flow
-12.4%
Cash-on-Cash Return
3.3%
Cap rate
0.6%
Rent to Value Ratio