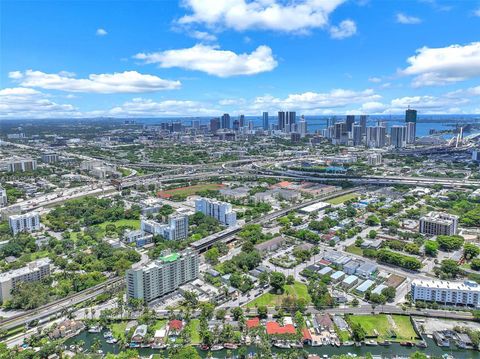
33136 Investment Properties for Sale
Browse homes for sale and investment properties in 33136. Refine your search by price, property type, or more.
Best cash flowing properties in 33136
Active
$240,000
2
bds
|
1
ba
|
782
sqft
|
built
1973
483 NW 19th St, Miami, FL 33136
$-444
Cash flow
-9.7%
Cash-on-Cash Return
3.9%
Cap rate
0.9%
Rent to Value Ratio

Active
$299,800
3
bds
|
2
ba
|
1,026
sqft
|
built
1973
1990 NW 4th Ct, Miami, FL 33136
$-478
Cash flow
-8.3%
Cash-on-Cash Return
4.2%
Cap rate
0.8%
Rent to Value Ratio
28 out of 30 properties for sale in 33136
Limited Results Shown
Create a free account, or log in to reveal all property listings and enjoy the complete experience.
Active
$290,000
2
bds
|
2
ba
|
929
sqft
|
built
1997
1010 NW 11th St, Miami, FL 33136
$-683
Cash flow
-12.3%
Cash-on-Cash Return
3.3%
Cap rate
0.8%
Rent to Value Ratio

Active
$380,000
2
bds
|
2
ba
|
891
sqft
|
built
2004
816 NW 11th St, Miami, FL 33136
$-1,106
Cash flow
-15.2%
Cash-on-Cash Return
2.7%
Cap rate
0.7%
Rent to Value Ratio

Active
$285,000
2
bds
|
2
ba
|
882
sqft
|
built
2004
816 NW 11th St, Miami, FL 33136
$-936
Cash flow
-17.1%
Cash-on-Cash Return
2.2%
Cap rate
0.8%
Rent to Value Ratio

Active
$298,999
2
bds
|
2
ba
|
795
sqft
|
built
2003
1060 NW 7th St, Miami, FL 33136
$-820
Cash flow
-14.3%
Cash-on-Cash Return
2.9%
Cap rate
0.8%
Rent to Value Ratio

Active
$379,999
2
bds
|
2
ba
|
914
sqft
|
built
1989
850 N Miami Ave, Miami, FL 33136
$-1,005
Cash flow
-13.8%
Cash-on-Cash Return
3.0%
Cap rate
0.7%
Rent to Value Ratio
Active
$285,000
1
bds
|
1
ba
|
575
sqft
|
built
1989
800 N Miami Ave, Miami, FL 33136
$-777
Cash flow
-14.2%
Cash-on-Cash Return
2.9%
Cap rate
0.8%
Rent to Value Ratio
Active
$389,000
2
bds
|
2
ba
|
1,067
sqft
|
built
2004
816 NW 11th St, Miami, FL 33136
$-1,097
Cash flow
-14.7%
Cash-on-Cash Return
2.8%
Cap rate
0.7%
Rent to Value Ratio
Active
$385,000
2
bds
|
2
ba
|
1,067
sqft
|
built
2004
816 NW 11th St, Miami, FL 33136
$-1,262
Cash flow
-17.1%
Cash-on-Cash Return
2.2%
Cap rate
0.7%
Rent to Value Ratio

Active
$1,855,000
4
bds
|
3
ba
|
1,756
sqft
|
built
1939
842 NW 9th Ct, Miami, FL 33136
$-5,424
Cash flow
-15.3%
Cash-on-Cash Return
2.6%
Cap rate
0.4%
Rent to Value Ratio

Active
$309,900
2
bds
|
2
ba
|
914
sqft
|
built
1989
850 N Miami Ave, Miami, FL 33136
$-1,178
Cash flow
-19.8%
Cash-on-Cash Return
1.6%
Cap rate
0.9%
Rent to Value Ratio

Active
$395,000
1
bds
|
1
ba
|
593
sqft
|
built
1989
800 N Miami Ave, Miami, FL 33136
$-1,461
Cash flow
-19.3%
Cash-on-Cash Return
1.7%
Cap rate
0.6%
Rent to Value Ratio
Active
$350,000
2
bds
|
2
ba
|
914
sqft
|
built
1989
850 N Miami Ave, Miami, FL 33136
$-1,438
Cash flow
-21.4%
Cash-on-Cash Return
1.2%
Cap rate
0.7%
Rent to Value Ratio

Active
$315,000
2
bds
|
2
ba
|
914
sqft
|
built
1989
850 N Miami Ave, Miami, FL 33136
$-1,058
Cash flow
-17.5%
Cash-on-Cash Return
2.1%
Cap rate
0.9%
Rent to Value Ratio

Active
$379,900
2
bds
|
2
ba
|
914
sqft
|
built
1989
850 N Miami Ave, Miami, FL 33136
$-1,241
Cash flow
-17.0%
Cash-on-Cash Return
2.2%
Cap rate
0.8%
Rent to Value Ratio

Active
$305,000
1
bds
|
1
ba
|
593
sqft
|
built
1989
850 N Miami Ave, Miami, FL 33136
$-619
Cash flow
-10.6%
Cash-on-Cash Return
3.7%
Cap rate
0.9%
Rent to Value Ratio

Active
$359,000
2
bds
|
2
ba
|
918
sqft
|
built
1997
1010 NW 11th St, Miami, FL 33136
$-739
Cash flow
-10.7%
Cash-on-Cash Return
3.7%
Cap rate
0.8%
Rent to Value Ratio
Active
$1,150,000
3
bds
|
0
ba
|
2,952
sqft
|
built
1937
1033 NW 6th St, Miami, FL 33136
$-4,930
Cash flow
-22.4%
Cash-on-Cash Return
1.0%
Cap rate
0.2%
Rent to Value Ratio

Active
$2,550,000
8
bds
|
9
ba
|
4,691
sqft
|
built
1976
1061 NW North River Dr, Miami, FL 33136
$-8,575
Cash flow
-17.5%
Cash-on-Cash Return
2.1%
Cap rate
0.4%
Rent to Value Ratio
Active
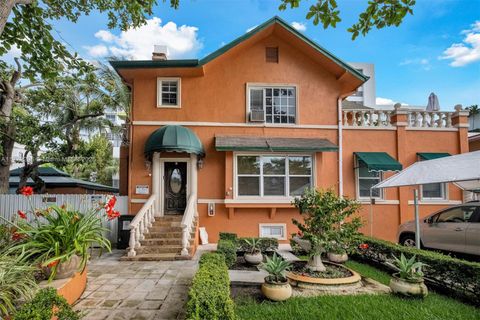
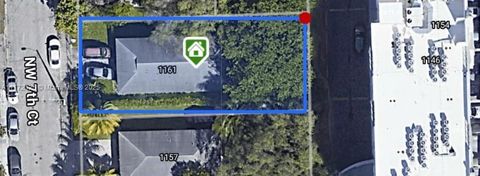
$1,300,000
4
bds
|
2
ba
|
1,326
sqft
|
built
2001
1161 NW 7th Ct, Miami, FL 33136
$-3,903
Cash flow
-15.7%
Cash-on-Cash Return
2.5%
Cap rate
0.3%
Rent to Value Ratio

Active
$365,000
2
bds
|
2
ba
|
927
sqft
|
built
1989
850 N Miami Ave, Miami, FL 33136
$-820
Cash flow
-11.7%
Cash-on-Cash Return
3.5%
Cap rate
1.0%
Rent to Value Ratio

Active
$305,000
1
bds
|
1
ba
|
689
sqft
|
built
1989
800 N Miami Ave, Miami, FL 33136
$-898
Cash flow
-15.4%
Cash-on-Cash Return
2.6%
Cap rate
0.8%
Rent to Value Ratio

Active
$2,600,000
4
bds
|
4
ba
|
0
sqft
|
built
1975
1044 NW North River Dr, Miami, FL 33136
$-9,056
Cash flow
-18.2%
Cash-on-Cash Return
2.0%
Cap rate
0.4%
Rent to Value Ratio

Active
$450,000
3
bds
|
2
ba
|
1,363
sqft
|
built
1990
269 NW 7th St, Miami, FL 33136
$-555
Cash flow
-6.4%
Cash-on-Cash Return
4.7%
Cap rate
0.8%
Rent to Value Ratio

Active
$1,385,000
8
bds
|
0
ba
|
3,856
sqft
|
built
1977
519 NW 10th Ave, Miami, FL 33136
$-6,282
Cash flow
-23.7%
Cash-on-Cash Return
0.7%
Cap rate
0.2%
Rent to Value Ratio

Active
$279,000
1
bds
|
1
ba
|
593
sqft
|
built
1989
800 N Miami Ave, Miami, FL 33136
$-1,036
Cash flow
-19.4%
Cash-on-Cash Return
1.7%
Cap rate
0.7%
Rent to Value Ratio
Active
$599,900
3
bds
|
2
ba
|
1,649
sqft
|
built
1920
1104 NW 6th St, Miami, FL 33136
$-966
Cash flow
-8.4%
Cash-on-Cash Return
4.2%
Cap rate
0.5%
Rent to Value Ratio