33138 Investment Properties for Sale
Browse homes for sale and investment properties in 33138. Refine your search by price, property type, or more.
Best cash flowing properties in 33138
Active
$550,000
4
bds
|
4
ba
|
2,391
sqft
|
built
1924
8320 NE 3rd Ave, Miami, FL 33138
$-345
Cash flow
-3.3%
Cash-on-Cash Return
5.4%
Cap rate
0.8%
Rent to Value Ratio
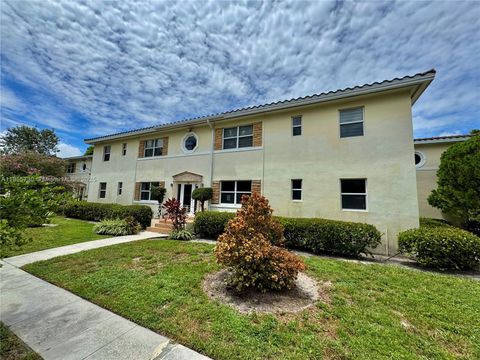
Active
$337,000
2
bds
|
1
ba
|
894
sqft
|
built
1949
726 NE 92nd St, Miami Shores, FL 33138
$-540
Cash flow
-8.4%
Cash-on-Cash Return
4.2%
Cap rate
0.7%
Rent to Value Ratio
148 out of 157 properties for sale in 33138
Limited Results Shown
Create a free account, or log in to reveal all property listings and enjoy the complete experience.
Active
$2,799,000
4
bds
|
4
ba
|
2,251
sqft
|
built
1947
899 NE 71st St, Miami, FL 33138
$-9,766
Cash flow
-18.2%
Cash-on-Cash Return
2.0%
Cap rate
0.3%
Rent to Value Ratio
Active
$339,000
1
bds
|
2
ba
|
828
sqft
|
built
1982
780 NE 69th St, Miami, FL 33138
$-1,520
Cash flow
-23.4%
Cash-on-Cash Return
0.8%
Cap rate
0.7%
Rent to Value Ratio

Active
$1,900,000
4
bds
|
4
ba
|
1,713
sqft
|
built
2000
9655 Biscayne Blvd, Miami Shores, FL 33138
$-7,919
Cash flow
-21.7%
Cash-on-Cash Return
1.1%
Cap rate
0.3%
Rent to Value Ratio
Active
$4,695,000
6
bds
|
7
ba
|
0
sqft
|
built
2017
1000 NE Little River Dr, Miami, FL 33138
$-23,547
Cash flow
-26.2%
Cash-on-Cash Return
0.1%
Cap rate
0.2%
Rent to Value Ratio
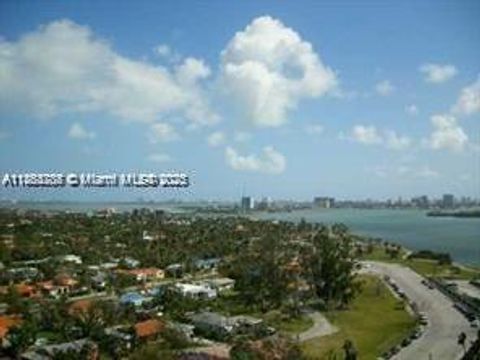
Active
$480,000
2
bds
|
2
ba
|
1,520
sqft
|
built
1981
1000 Quayside Ter, Miami Shores, FL 33138
$-1,973
Cash flow
-21.4%
Cash-on-Cash Return
1.2%
Cap rate
0.8%
Rent to Value Ratio
Active
$1,200,000
5
bds
|
3
ba
|
2,005
sqft
|
built
1942
1025 NE 81st St, Miami, FL 33138
$-4,865
Cash flow
-21.2%
Cash-on-Cash Return
1.3%
Cap rate
0.4%
Rent to Value Ratio
Active
$379,000
1
bds
|
2
ba
|
1,200
sqft
|
built
1981
1000 Quayside Ter, Miami Shores, FL 33138
$-1,821
Cash flow
-25.1%
Cash-on-Cash Return
0.4%
Cap rate
0.7%
Rent to Value Ratio
Active
$280,000
1
bds
|
1
ba
|
775
sqft
|
built
1983
650 NE 64th St, Miami, FL 33138
$-931
Cash flow
-17.3%
Cash-on-Cash Return
2.2%
Cap rate
0.9%
Rent to Value Ratio
Active
$2,350,000
3
bds
|
3
ba
|
2,509
sqft
|
built
1955
1361 NE 104th St, Miami Shores, FL 33138
$-6,469
Cash flow
-14.4%
Cash-on-Cash Return
2.8%
Cap rate
0.4%
Rent to Value Ratio
Active
$350,000
2
bds
|
2
ba
|
1,242
sqft
|
built
1982
780 NE 69th St, Miami, FL 33138
$-1,551
Cash flow
-23.1%
Cash-on-Cash Return
0.8%
Cap rate
0.9%
Rent to Value Ratio
Active
$449,000
2
bds
|
2
ba
|
1,520
sqft
|
built
1981
2000 Towerside Ter, Miami, FL 33138
$-1,936
Cash flow
-22.5%
Cash-on-Cash Return
1.0%
Cap rate
0.9%
Rent to Value Ratio
Active
$3,249,000
4
bds
|
3
ba
|
2,934
sqft
|
built
1979
1090 NE 92nd St, Miami Shores, FL 33138
$-13,506
Cash flow
-21.7%
Cash-on-Cash Return
1.2%
Cap rate
0.3%
Rent to Value Ratio
Active
$1,750,000
4
bds
|
3
ba
|
2,521
sqft
|
built
1938
117 NE 95th St, Miami Shores, FL 33138
$-6,536
Cash flow
-19.5%
Cash-on-Cash Return
1.7%
Cap rate
0.4%
Rent to Value Ratio
Active
$1,250,000
3
bds
|
3
ba
|
1,816
sqft
|
built
1950
10551 NE 3rd Ave, Miami Shores, FL 33138
$-3,721
Cash flow
-15.5%
Cash-on-Cash Return
2.6%
Cap rate
0.4%
Rent to Value Ratio
Active
$1,698,000
3
bds
|
3
ba
|
1,890
sqft
|
built
1937
775 NE 76th St, Miami, FL 33138
$-7,987
Cash flow
-24.5%
Cash-on-Cash Return
0.5%
Cap rate
0.2%
Rent to Value Ratio
Active
$799,900
6
bds
|
2
ba
|
2,696
sqft
|
built
1930
796 NE 85th St, Miami, FL 33138
$-2,819
Cash flow
-18.4%
Cash-on-Cash Return
1.9%
Cap rate
0.5%
Rent to Value Ratio
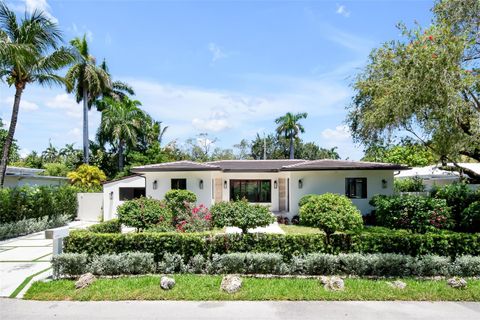
Active
$450,000
2
bds
|
2
ba
|
990
sqft
|
built
1972
750 NE 64th St, Miami, FL 33138
$-706
Cash flow
-8.2%
Cash-on-Cash Return
4.3%
Cap rate
0.7%
Rent to Value Ratio
Active
$2,195,000
4
bds
|
3
ba
|
2,589
sqft
|
built
1951
575 NE 97th St, Miami Shores, FL 33138
$-6,418
Cash flow
-15.3%
Cash-on-Cash Return
2.6%
Cap rate
0.4%
Rent to Value Ratio
Active
$299,000
2
bds
|
2
ba
|
1,200
sqft
|
built
1965
1700 NE 105th St, Miami Shores, FL 33138
$-755
Cash flow
-13.2%
Cash-on-Cash Return
3.1%
Cap rate
1.1%
Rent to Value Ratio
Active
$1,200,000
4
bds
|
3
ba
|
1,838
sqft
|
built
1920
275 NE 89th St, El Portal, FL 33138
$-3,912
Cash flow
-17.0%
Cash-on-Cash Return
2.2%
Cap rate
0.5%
Rent to Value Ratio
Active
$499,000
1
bds
|
2
ba
|
1,200
sqft
|
built
1981
2000 Towerside Ter, Miami, FL 33138
$-2,330
Cash flow
-24.4%
Cash-on-Cash Return
0.5%
Cap rate
0.6%
Rent to Value Ratio
Active
$495,000
2
bds
|
2
ba
|
1,268
sqft
|
built
1982
4000 Towerside Ter, Miami, FL 33138
$-1,425
Cash flow
-15.0%
Cash-on-Cash Return
2.7%
Cap rate
0.9%
Rent to Value Ratio
Active
$415,000
2
bds
|
2
ba
|
1,312
sqft
|
built
1981
2000 Towerside Ter, Miami, FL 33138
$-2,064
Cash flow
-25.9%
Cash-on-Cash Return
0.2%
Cap rate
0.7%
Rent to Value Ratio
Active
$217,000
bds
|
1
ba
|
449
sqft
|
built
1925
421 Grand Concourse, Miami Shores, FL 33138
$-758
Cash flow
-18.2%
Cash-on-Cash Return
2.0%
Cap rate
0.8%
Rent to Value Ratio
Active
$450,000
2
bds
|
2
ba
|
1,520
sqft
|
built
1981
1000 Quayside Ter, Miami, FL 33138
$-1,338
Cash flow
-15.5%
Cash-on-Cash Return
2.6%
Cap rate
0.7%
Rent to Value Ratio
Active
$1,250,000
4
bds
|
3
ba
|
2,463
sqft
|
built
1953
10619 NE 10th Pl, Miami Shores, FL 33138
$-2,592
Cash flow
-10.8%
Cash-on-Cash Return
3.7%
Cap rate
0.6%
Rent to Value Ratio
Active
$1,849,000
4
bds
|
4
ba
|
3,669
sqft
|
built
1975
1558 NE Quayside Ter, Miami, FL 33138
$-6,897
Cash flow
-19.5%
Cash-on-Cash Return
1.7%
Cap rate
0.5%
Rent to Value Ratio
Active
$395,000
2
bds
|
2
ba
|
1,268
sqft
|
built
1982
4000 Towerside Ter, Miami, FL 33138
$-2,080
Cash flow
-27.5%
Cash-on-Cash Return
-0.2%
Cap rate
1.0%
Rent to Value Ratio
Active
$350,000
2
bds
|
2
ba
|
1,268
sqft
|
built
1982
4000 Towerside Ter, Miami, FL 33138
$-764
Cash flow
-11.4%
Cash-on-Cash Return
3.5%
Cap rate
0.8%
Rent to Value Ratio
Active
$1,255,000
3
bds
|
2
ba
|
0
sqft
|
built
1938
318 NE 105th St, Miami Shores, FL 33138
$-3,508
Cash flow
-14.6%
Cash-on-Cash Return
2.8%
Cap rate
0.4%
Rent to Value Ratio
Active
$7,750,000
4
bds
|
4
ba
|
4,031
sqft
|
built
2005
755 NE 77th St, Miami, FL 33138
$-34,263
Cash flow
-23.1%
Cash-on-Cash Return
0.8%
Cap rate
0.1%
Rent to Value Ratio
Active
$435,000
2
bds
|
2
ba
|
1,520
sqft
|
built
1981
1000 Quayside Ter, Miami, FL 33138
$-1,966
Cash flow
-23.6%
Cash-on-Cash Return
0.7%
Cap rate
0.8%
Rent to Value Ratio
Active
$1,499,000
3
bds
|
2
ba
|
2,337
sqft
|
built
1948
541 NE 105th St, Miami Shores, FL 33138
$-3,320
Cash flow
-11.6%
Cash-on-Cash Return
3.5%
Cap rate
0.6%
Rent to Value Ratio
Active
$3,000,000
2
bds
|
3
ba
|
2,043
sqft
|
built
1951
1051 NE 86th St, Miami, FL 33138
$-11,982
Cash flow
-20.8%
Cash-on-Cash Return
1.4%
Cap rate
0.2%
Rent to Value Ratio
Active
$1,795,000
3
bds
|
2
ba
|
1,884
sqft
|
built
1950
480 NE 103rd St, Miami Shores, FL 33138
$-6,624
Cash flow
-19.3%
Cash-on-Cash Return
1.7%
Cap rate
0.3%
Rent to Value Ratio
Active
$205,000
1
bds
|
1
ba
|
608
sqft
|
built
1974
8950 NE 8th Ave, Miami, FL 33138
$-630
Cash flow
-16.0%
Cash-on-Cash Return
2.5%
Cap rate
0.8%
Rent to Value Ratio
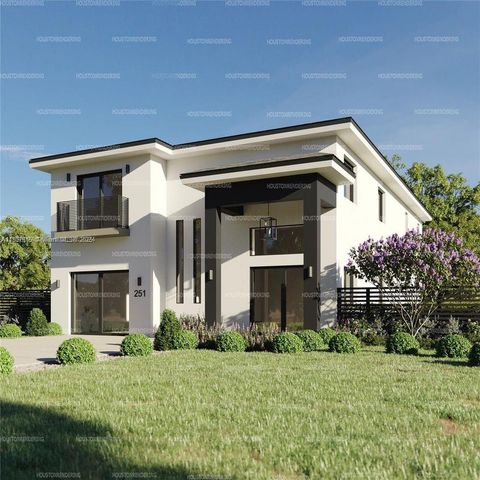
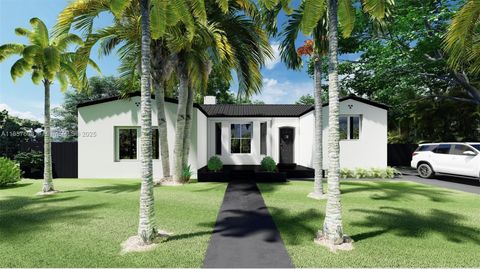
Active
$1,700,000
4
bds
|
4
ba
|
3,008
sqft
|
built
2025
10618 NE 11th Ave, Miami Shores, FL 33138
$-3,072
Cash flow
-9.4%
Cash-on-Cash Return
4.0%
Cap rate
0.6%
Rent to Value Ratio
Active
$720,000
4
bds
|
2
ba
|
1,496
sqft
|
built
1939
370 NE 87th St, El Portal, FL 33138
$-2,217
Cash flow
-16.1%
Cash-on-Cash Return
2.5%
Cap rate
0.5%
Rent to Value Ratio