33140 Investment Properties for Sale
Browse homes for sale and investment properties in 33140. Refine your search by price, property type, or more.
Best cash flowing properties in 33140
Active
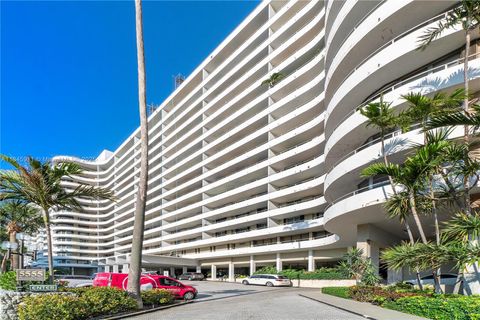
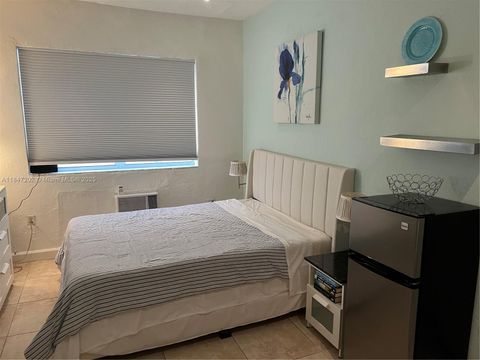
$324,999
2
bds
|
2
ba
|
1,048
sqft
|
built
1967
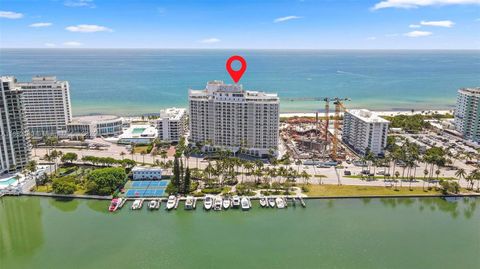
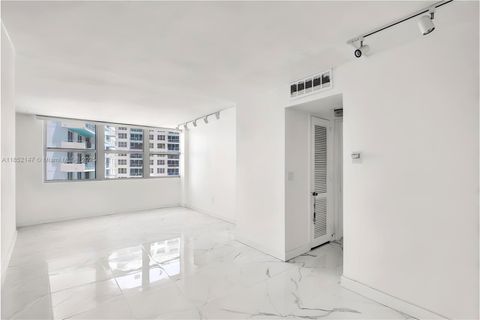
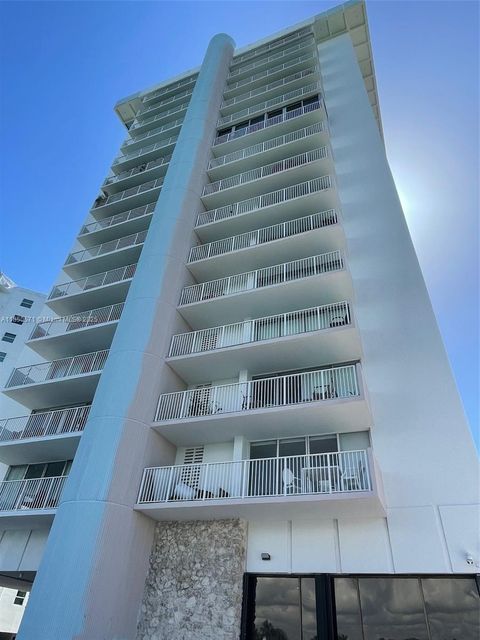
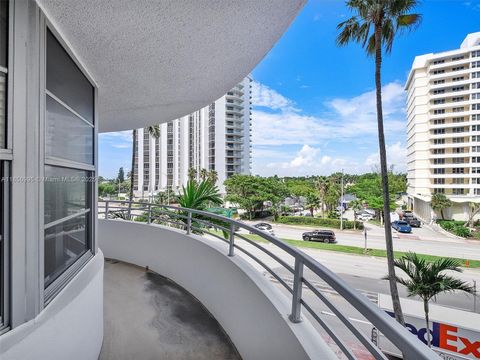
5555 Collins Ave, Miami Beach, FL 33140
$259
Cash flow
4.2%
Cash-on-Cash Return
7.1%
Cap rate
1.1%
Rent to Value Ratio
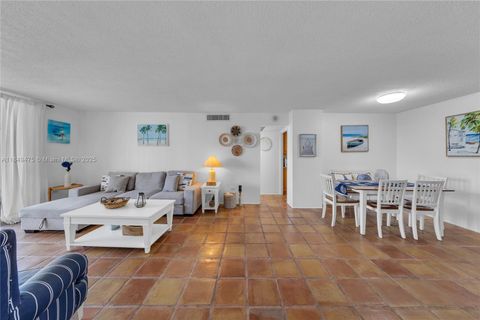
Active
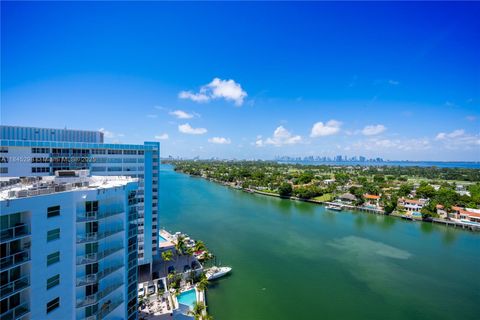
$399,000
2
bds
|
2
ba
|
1,048
sqft
|
built
1967
5555 Collins Ave, Miami Beach, FL 33140
$-139
Cash flow
-1.8%
Cash-on-Cash Return
5.7%
Cap rate
0.9%
Rent to Value Ratio
400 out of 442 properties for sale in 33140
Limited Results Shown
Create a free account, or log in to reveal all property listings and enjoy the complete experience.
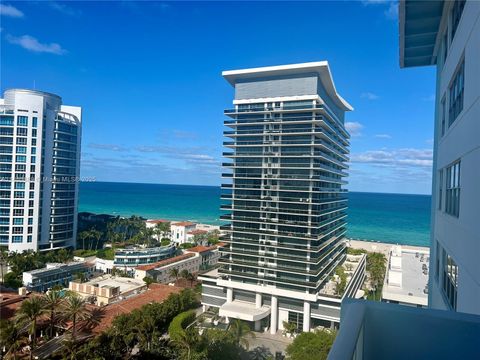
Active
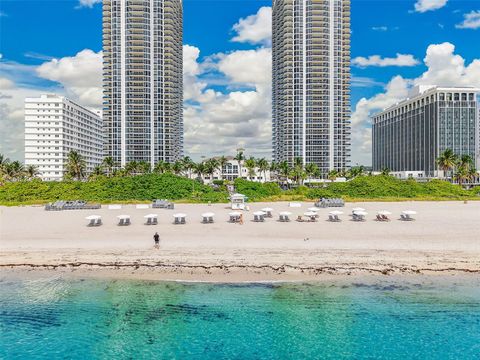
$440,000
1
bds
|
2
ba
|
855
sqft
|
built
1970
5838 Collins Ave, Miami Beach, FL 33140
$-1,713
Cash flow
-20.3%
Cash-on-Cash Return
1.5%
Cap rate
0.6%
Rent to Value Ratio
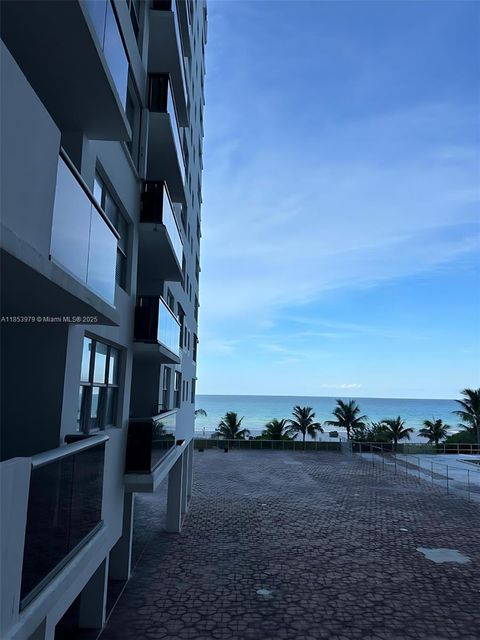
Active
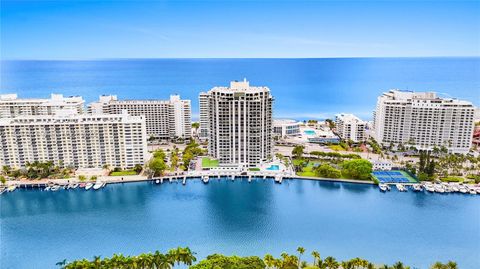
$420,000
2
bds
|
2
ba
|
1,360
sqft
|
built
1971
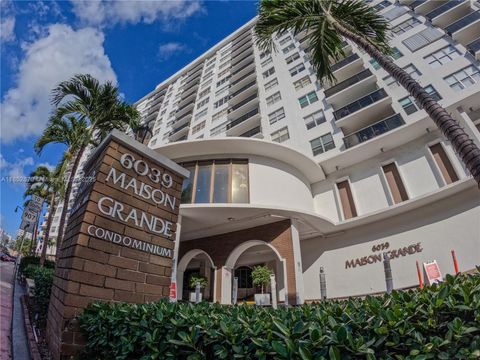
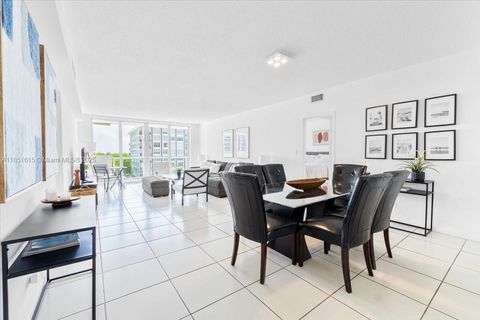
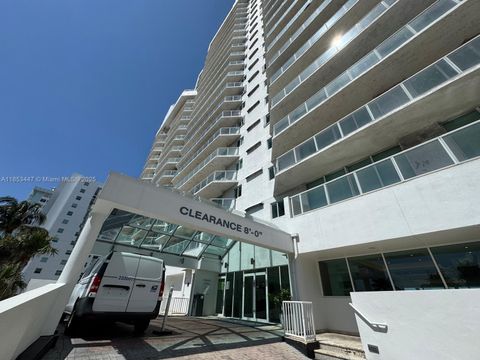
6039 Collins Ave, Miami Beach, FL 33140
$-1,493
Cash flow
-18.5%
Cash-on-Cash Return
1.9%
Cap rate
0.8%
Rent to Value Ratio
Active
$545,000
2
bds
|
2
ba
|
1,206
sqft
|
built
1971
6039 Collins Ave, Miami Beach, FL 33140
$-1,022
Cash flow
-9.8%
Cash-on-Cash Return
3.9%
Cap rate
0.9%
Rent to Value Ratio
Active
$717,000
2
bds
|
2
ba
|
1,290
sqft
|
built
1968
5601 Collins Ave, Miami Beach, FL 33140
$-3,430
Cash flow
-25.0%
Cash-on-Cash Return
0.4%
Cap rate
0.5%
Rent to Value Ratio
Active
$825,000
3
bds
|
2
ba
|
1,180
sqft
|
built
1998
5900 Collins Ave, Miami Beach, FL 33140
$-3,572
Cash flow
-22.6%
Cash-on-Cash Return
1.0%
Cap rate
0.6%
Rent to Value Ratio
Active
$1,750,000
3
bds
|
2
ba
|
1,932
sqft
|
built
1957
4322 Alton Rd, Miami Beach, FL 33140
$-4,823
Cash flow
-14.4%
Cash-on-Cash Return
2.8%
Cap rate
0.4%
Rent to Value Ratio
Active
$450,000
1
bds
|
1
ba
|
790
sqft
|
built
1962
4747 Collins Ave, Miami Beach, FL 33140
$-1,787
Cash flow
-20.7%
Cash-on-Cash Return
1.4%
Cap rate
0.6%
Rent to Value Ratio
Active
$2,150,000
3
bds
|
3
ba
|
1,980
sqft
|
built
1991
5757 Collins Ave, Miami Beach, FL 33140
$-6,804
Cash flow
-16.5%
Cash-on-Cash Return
2.3%
Cap rate
0.4%
Rent to Value Ratio
Active
$545,000
2
bds
|
2
ba
|
1,290
sqft
|
built
1971
6039 Collins Ave, Miami Beach, FL 33140
$-2,179
Cash flow
-20.9%
Cash-on-Cash Return
1.3%
Cap rate
0.6%
Rent to Value Ratio
Active
$895,000
2
bds
|
2
ba
|
1,935
sqft
|
built
1967
5640 Collins Ave, Miami, FL 33140
$-2,967
Cash flow
-17.3%
Cash-on-Cash Return
2.2%
Cap rate
0.6%
Rent to Value Ratio
Active
$425,000
1
bds
|
2
ba
|
980
sqft
|
built
1967
5401 Collins Ave, Miami Beach, FL 33140
$-1,341
Cash flow
-16.5%
Cash-on-Cash Return
2.4%
Cap rate
0.8%
Rent to Value Ratio
Active
$424,900
1
bds
|
2
ba
|
1,019
sqft
|
built
1961
5055 Collins Ave, Miami Beach, FL 33140
$-1,997
Cash flow
-24.5%
Cash-on-Cash Return
0.5%
Cap rate
0.7%
Rent to Value Ratio
Active
$349,000
1
bds
|
2
ba
|
815
sqft
|
built
1970
5838 Collins Ave, Miami Beach, FL 33140
$-1,616
Cash flow
-24.2%
Cash-on-Cash Return
0.6%
Cap rate
0.6%
Rent to Value Ratio

Active
$399,000
1
bds
|
2
ba
|
746
sqft
|
built
1989
5880 Collins Ave, Miami Beach, FL 33140
$-1,163
Cash flow
-15.2%
Cash-on-Cash Return
2.6%
Cap rate
0.6%
Rent to Value Ratio
Active
$325,000
1
bds
|
1
ba
|
912
sqft
|
built
1967
5555 Collins Ave, Miami Beach, FL 33140
$-2,067
Cash flow
-33.2%
Cash-on-Cash Return
-1.5%
Cap rate
0.9%
Rent to Value Ratio
Active
$38,995,000
5
bds
|
5
ba
|
9,237
sqft
|
built
2023
1510 W 23rd St, Miami Beach, FL 33140
$-209,788
Cash flow
-28.1%
Cash-on-Cash Return
-0.3%
Cap rate
0.0%
Rent to Value Ratio
Active
$790,000
2
bds
|
2
ba
|
1,030
sqft
|
built
1966
5151 Collins Ave, Miami Beach, FL 33140
$-3,627
Cash flow
-24.0%
Cash-on-Cash Return
0.6%
Cap rate
0.4%
Rent to Value Ratio
Active
$679,000
2
bds
|
2
ba
|
1,368
sqft
|
built
1980
2401 Collins Ave, Miami Beach, FL 33140
$-1,949
Cash flow
-15.0%
Cash-on-Cash Return
2.7%
Cap rate
0.7%
Rent to Value Ratio
Active
$575,000
2
bds
|
2
ba
|
1,362
sqft
|
built
1968
5750 Collins Ave, Miami Beach, FL 33140
$-1,831
Cash flow
-16.6%
Cash-on-Cash Return
2.3%
Cap rate
0.6%
Rent to Value Ratio
Active
$850,000
2
bds
|
2
ba
|
1,290
sqft
|
built
1968
5601 Collins Ave, Miami Beach, FL 33140
$-3,849
Cash flow
-23.6%
Cash-on-Cash Return
0.7%
Cap rate
0.5%
Rent to Value Ratio

Active
$1,100,000
bds
|
1
ba
|
538
sqft
|
built
2008
4391 Collins Ave, Miami Beach, FL 33140
$-3,702
Cash flow
-17.6%
Cash-on-Cash Return
2.1%
Cap rate
0.4%
Rent to Value Ratio
Active
$475,000
1
bds
|
2
ba
|
930
sqft
|
built
1966
5161 Collins Ave, Miami Beach, FL 33140
$-2,121
Cash flow
-23.3%
Cash-on-Cash Return
0.8%
Cap rate
0.6%
Rent to Value Ratio
Active
$665,000
1
bds
|
2
ba
|
930
sqft
|
built
1968
5601 Collins Ave, Miami Beach, FL 33140
$-2,705
Cash flow
-21.2%
Cash-on-Cash Return
1.3%
Cap rate
0.5%
Rent to Value Ratio

Active
$1,195,000
bds
|
1
ba
|
544
sqft
|
built
2008
4391 Collins Ave, Miami Beach, FL 33140
$-4,588
Cash flow
-20.0%
Cash-on-Cash Return
1.5%
Cap rate
0.4%
Rent to Value Ratio
Active
$465,000
bds
|
1
ba
|
536
sqft
|
built
1936
2421 Lake Pancoast Dr, Miami Beach, FL 33140
$-1,701
Cash flow
-19.1%
Cash-on-Cash Return
1.8%
Cap rate
0.5%
Rent to Value Ratio
Active
$335,500
1
bds
|
2
ba
|
530
sqft
|
built
1940
3801 Indian Creek Dr, Miami Beach, FL 33140
$-871
Cash flow
-13.5%
Cash-on-Cash Return
3.0%
Cap rate
0.5%
Rent to Value Ratio
Active
$1,190,000
3
bds
|
2
ba
|
1,390
sqft
|
built
1998
5900 Collins Ave, Miami Beach, FL 33140
$-4,518
Cash flow
-19.8%
Cash-on-Cash Return
1.6%
Cap rate
0.6%
Rent to Value Ratio
Active
$1,650,000
2
bds
|
2
ba
|
1,550
sqft
|
built
2000
4775 Collins Ave, Miami Beach, FL 33140
$-6,410
Cash flow
-20.3%
Cash-on-Cash Return
1.5%
Cap rate
0.5%
Rent to Value Ratio
Active
$1,900,000
4
bds
|
5
ba
|
2,827
sqft
|
built
1974
5500 Collins Ave, Miami Beach, FL 33140
$-9,700
Cash flow
-26.6%
Cash-on-Cash Return
0.0%
Cap rate
0.4%
Rent to Value Ratio
Active
$4,950,000
3
bds
|
3
ba
|
1,837
sqft
|
built
2008
3737 Collins Ave, Miami Beach, FL 33140
$-28,231
Cash flow
-29.8%
Cash-on-Cash Return
-0.7%
Cap rate
0.2%
Rent to Value Ratio
Active
$975,000
3
bds
|
3
ba
|
1,460
sqft
|
built
2004
5970 Indian Creek Dr, Miami Beach, FL 33140
$-3,162
Cash flow
-16.9%
Cash-on-Cash Return
2.3%
Cap rate
0.6%
Rent to Value Ratio
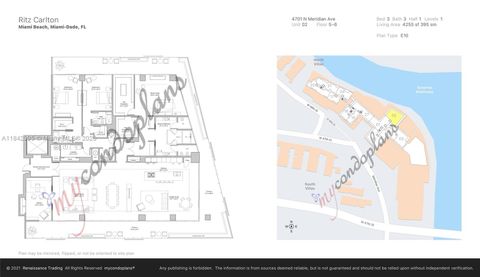
Active
$7,800,000
3
bds
|
4
ba
|
4,247
sqft
|
built
2019
4701 N Meridian Ave, Miami Beach, FL 33140
$-52,759
Cash flow
-35.3%
Cash-on-Cash Return
-2.0%
Cap rate
0.1%
Rent to Value Ratio
Active
$830,000
2
bds
|
2
ba
|
1,700
sqft
|
built
2010
6000 Collins Ave, Miami Beach, FL 33140
$-3,691
Cash flow
-23.2%
Cash-on-Cash Return
0.8%
Cap rate
0.6%
Rent to Value Ratio
Active
$2,450,000
2
bds
|
3
ba
|
1,870
sqft
|
built
1995
5025 Collins Ave, Miami Beach, FL 33140
$-11,928
Cash flow
-25.4%
Cash-on-Cash Return
0.3%
Cap rate
0.4%
Rent to Value Ratio
Active
$299,000
0
bds
|
1
ba
|
570
sqft
|
built
1967
5401 Collins Ave, Miami Beach, FL 33140
$-1,261
Cash flow
-22.0%
Cash-on-Cash Return
1.1%
Cap rate
0.8%
Rent to Value Ratio
Active
$850,000
2
bds
|
2
ba
|
1,030
sqft
|
built
1966
5151 Collins Ave, Miami Beach, FL 33140
$-3,063
Cash flow
-18.8%
Cash-on-Cash Return
1.8%
Cap rate
0.5%
Rent to Value Ratio
Active
$495,000
1
bds
|
1
ba
|
912
sqft
|
built
1967
5555 Collins Ave, Miami Beach, FL 33140
$-2,239
Cash flow
-23.6%
Cash-on-Cash Return
0.7%
Cap rate
0.6%
Rent to Value Ratio
Active
$4,650,000
4
bds
|
5
ba
|
3,807
sqft
|
built
2005
5959 Collins Ave, Miami Beach, FL 33140
$-25,716
Cash flow
-28.9%
Cash-on-Cash Return
-0.5%
Cap rate
0.2%
Rent to Value Ratio