33142 Investment Properties for Sale
Browse homes for sale and investment properties in 33142. Refine your search by price, property type, or more.
Best cash flowing properties in 33142

Active
$499,900
4
bds
|
2
ba
|
1,376
sqft
|
built
2007
1845 NW 44th St, Miami, FL 33142
$-436
Cash flow
-4.6%
Cash-on-Cash Return
5.1%
Cap rate
0.6%
Rent to Value Ratio
Active
$395,000
2
bds
|
2
ba
|
940
sqft
|
built
1920
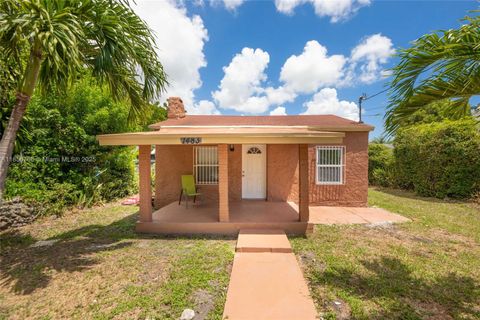
1483 NW 58th St, Miami, FL 33142
$-443
Cash flow
-5.9%
Cash-on-Cash Return
4.8%
Cap rate
0.7%
Rent to Value Ratio
124 out of 130 properties for sale in 33142
Limited Results Shown
Create a free account, or log in to reveal all property listings and enjoy the complete experience.

Active
$425,000
3
bds
|
2
ba
|
1,247
sqft
|
built
1937
3175 NW 34th St, Miami, FL 33142
$-1,132
Cash flow
-13.9%
Cash-on-Cash Return
3.0%
Cap rate
0.5%
Rent to Value Ratio

Active
$625,000
4
bds
|
2
ba
|
1,568
sqft
|
built
1949
1321 NW 44th St, Miami, FL 33142
$-1,352
Cash flow
-11.3%
Cash-on-Cash Return
3.6%
Cap rate
0.5%
Rent to Value Ratio
Active
$470,000
3
bds
|
2
ba
|
1,280
sqft
|
built
2020
3020 NW 45th St, Miami, FL 33142
$-444
Cash flow
-4.9%
Cash-on-Cash Return
5.0%
Cap rate
0.7%
Rent to Value Ratio

Active
$630,000
4
bds
|
0
ba
|
1,512
sqft
|
built
1965
1831 NW 41st St, Miami, FL 33142
$-2,295
Cash flow
-19.0%
Cash-on-Cash Return
1.8%
Cap rate
0.4%
Rent to Value Ratio

Active
$425,555
3
bds
|
1
ba
|
1,141
sqft
|
built
1947
1875 NW 53rd St, Miami, FL 33142
$-528
Cash flow
-6.5%
Cash-on-Cash Return
4.7%
Cap rate
0.7%
Rent to Value Ratio

Active
$1,695,000
2
bds
|
0
ba
|
2,888
sqft
|
built
1925
3123 NW 22nd Ct, Miami, FL 33142
$-7,843
Cash flow
-24.1%
Cash-on-Cash Return
0.6%
Cap rate
0.1%
Rent to Value Ratio

Active
$1,399,000
4
bds
|
0
ba
|
4,900
sqft
|
built
2023
1890 NW 26th St, Miami, FL 33142
$-5,449
Cash flow
-20.3%
Cash-on-Cash Return
1.5%
Cap rate
0.3%
Rent to Value Ratio

Active
$399,000
2
bds
|
1
ba
|
1,120
sqft
|
built
1937
1304 NW 43rd St, Miami, FL 33142
$-594
Cash flow
-7.8%
Cash-on-Cash Return
4.4%
Cap rate
0.7%
Rent to Value Ratio

Active
$399,900
3
bds
|
2
ba
|
1,367
sqft
|
built
1935
1853 NW 47th St, Miami, FL 33142
$-480
Cash flow
-6.3%
Cash-on-Cash Return
4.7%
Cap rate
0.8%
Rent to Value Ratio

Active
$515,000
3
bds
|
2
ba
|
810
sqft
|
built
1965
2951 NW 47th St, Miami, FL 33142
$-998
Cash flow
-10.1%
Cash-on-Cash Return
3.8%
Cap rate
0.5%
Rent to Value Ratio

Active
$675,000
4
bds
|
0
ba
|
2,105
sqft
|
built
1967
2364 NW 31st St, Miami, FL 33142
$-1,940
Cash flow
-15.0%
Cash-on-Cash Return
2.7%
Cap rate
0.3%
Rent to Value Ratio
Active
$1,350,000
8
bds
|
0
ba
|
3,386
sqft
|
built
1925
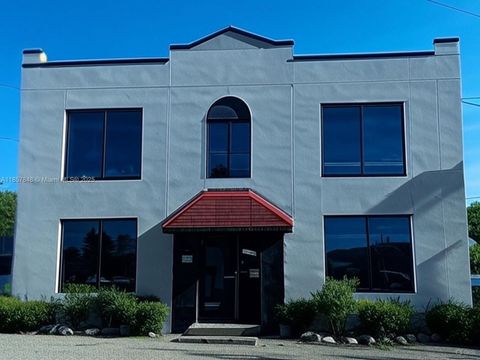
1376 NW 35th St, Miami, FL 33142
$-5,017
Cash flow
-19.4%
Cash-on-Cash Return
1.7%
Cap rate
0.4%
Rent to Value Ratio
Active
$950,000
3
bds
|
0
ba
|
2,283
sqft
|
built
1920
2180 NW 18th Ave, Miami, FL 33142
$-3,646
Cash flow
-20.0%
Cash-on-Cash Return
1.5%
Cap rate
0.3%
Rent to Value Ratio

Active
$449,900
5
bds
|
0
ba
|
1,532
sqft
|
built
1936
4816 NW 21st Ave, Miami, FL 33142
$-1,078
Cash flow
-12.5%
Cash-on-Cash Return
3.3%
Cap rate
0.6%
Rent to Value Ratio

Active
$664,900
3
bds
|
2
ba
|
1,468
sqft
|
built
1950
3139 NW 45th St, Miami, FL 33142
$-1,563
Cash flow
-12.3%
Cash-on-Cash Return
3.3%
Cap rate
0.5%
Rent to Value Ratio
Active
$670,000
2
bds
|
1
ba
|
1,716
sqft
|
built
1941
1855 NW 32nd St, Miami, FL 33142
$-1,936
Cash flow
-15.1%
Cash-on-Cash Return
2.7%
Cap rate
0.4%
Rent to Value Ratio

Active
$550,000
3
bds
|
0
ba
|
1,365
sqft
|
built
1962
4647 NW 15th Ct, Miami, FL 33142
$-737
Cash flow
-7.0%
Cash-on-Cash Return
4.5%
Cap rate
0.6%
Rent to Value Ratio
Active
$688,000
2
bds
|
0
ba
|
1,656
sqft
|
built
1941
1554 NW 58th St, Miami, FL 33142
$-2,473
Cash flow
-18.8%
Cash-on-Cash Return
1.8%
Cap rate
0.3%
Rent to Value Ratio

Active
$619,999
2
bds
|
0
ba
|
1,512
sqft
|
built
1947
2425 NW 28th St, Miami, FL 33142
$-1,403
Cash flow
-11.8%
Cash-on-Cash Return
3.4%
Cap rate
0.6%
Rent to Value Ratio
Active
$400,000
3
bds
|
1
ba
|
968
sqft
|
built
1936
4133 NW 22nd Ct, Miami, FL 33142
$-494
Cash flow
-6.4%
Cash-on-Cash Return
4.7%
Cap rate
0.7%
Rent to Value Ratio

Active
$700,000
5
bds
|
0
ba
|
2,400
sqft
|
built
1973
2311 NW 33rd St, Miami, FL 33142
$-2,376
Cash flow
-17.7%
Cash-on-Cash Return
2.1%
Cap rate
0.3%
Rent to Value Ratio

Active
$585,000
3
bds
|
2
ba
|
1,396
sqft
|
built
1926
1940 NW 27th St, Miami, FL 33142
$-935
Cash flow
-8.3%
Cash-on-Cash Return
4.2%
Cap rate
0.7%
Rent to Value Ratio

Active
$600,000
4
bds
|
3
ba
|
1,963
sqft
|
built
1941
2501 NW 22nd Ave, Miami, FL 33142
$-2,197
Cash flow
-19.1%
Cash-on-Cash Return
1.8%
Cap rate
0.4%
Rent to Value Ratio

Active
$409,900
2
bds
|
0
ba
|
1,273
sqft
|
built
1947
1746 NW 47th Ter, Miami, FL 33142
$-933
Cash flow
-11.9%
Cash-on-Cash Return
3.4%
Cap rate
0.5%
Rent to Value Ratio

Active
$1,100,000
3
bds
|
0
ba
|
3,665
sqft
|
built
1930
1499 NW 32nd St, Miami, FL 33142
$-4,491
Cash flow
-21.3%
Cash-on-Cash Return
1.2%
Cap rate
0.2%
Rent to Value Ratio

Active
$480,000
4
bds
|
2
ba
|
1,255
sqft
|
built
1962
2238 NW 58th St, Miami, FL 33142
$-479
Cash flow
-5.2%
Cash-on-Cash Return
5.0%
Cap rate
0.7%
Rent to Value Ratio

Active
$659,000
4
bds
|
3
ba
|
1,785
sqft
|
built
2005
3039 NW 51st Ter, Miami, FL 33142
$-1,949
Cash flow
-15.4%
Cash-on-Cash Return
2.6%
Cap rate
0.4%
Rent to Value Ratio

Active
$690,000
2
bds
|
0
ba
|
1,949
sqft
|
built
1935
2223 NW 32nd St, Miami, FL 33142
$-2,709
Cash flow
-20.5%
Cash-on-Cash Return
1.4%
Cap rate
0.3%
Rent to Value Ratio

Active
$610,000
4
bds
|
0
ba
|
1,440
sqft
|
built
1959
1574 NW 58th St, Miami, FL 33142
$-2,356
Cash flow
-20.2%
Cash-on-Cash Return
1.5%
Cap rate
0.3%
Rent to Value Ratio
Active
$539,900
3
bds
|
2
ba
|
1,077
sqft
|
built
1946
1361 NW 55th St, Miami, FL 33142
$-920
Cash flow
-8.9%
Cash-on-Cash Return
4.1%
Cap rate
0.6%
Rent to Value Ratio

Active
$525,000
3
bds
|
2
ba
|
1,184
sqft
|
built
1972
2160 NW 45th St, Miami, FL 33142
$-847
Cash flow
-8.4%
Cash-on-Cash Return
4.2%
Cap rate
0.6%
Rent to Value Ratio

Active
$960,000
8
bds
|
0
ba
|
3,024
sqft
|
built
1958
1277 NW 58th St, Miami, FL 33142
$-3,764
Cash flow
-20.5%
Cash-on-Cash Return
1.4%
Cap rate
0.3%
Rent to Value Ratio

Active
$790,000
2
bds
|
0
ba
|
2,106
sqft
|
built
1924
2035 NW 34th St, Miami, FL 33142
$-3,363
Cash flow
-22.2%
Cash-on-Cash Return
1.0%
Cap rate
0.3%
Rent to Value Ratio

Active
$640,000
5
bds
|
3
ba
|
1,917
sqft
|
built
1937
2708 NW 22nd Ct, Miami, FL 33142
$-1,683
Cash flow
-13.7%
Cash-on-Cash Return
3.0%
Cap rate
0.5%
Rent to Value Ratio

Active
$520,000
3
bds
|
2
ba
|
1,167
sqft
|
built
2005
2475 NW 55th St, Miami, FL 33142
$-1,135
Cash flow
-11.4%
Cash-on-Cash Return
3.5%
Cap rate
0.6%
Rent to Value Ratio

Active
$429,900
3
bds
|
2
ba
|
1,120
sqft
|
built
1960
2961 NW 59th St, Miami, FL 33142
$-684
Cash flow
-8.3%
Cash-on-Cash Return
4.2%
Cap rate
0.6%
Rent to Value Ratio
Active
$399,999
2
bds
|
1
ba
|
540
sqft
|
built
1944
3143 NW 59th St, Miami, FL 33142
$-1,169
Cash flow
-15.2%
Cash-on-Cash Return
2.6%
Cap rate
0.5%
Rent to Value Ratio

Active
$860,000
4
bds
|
0
ba
|
2,399
sqft
|
built
1952
2215 NW 33rd St, Miami, FL 33142
$-3,565
Cash flow
-21.6%
Cash-on-Cash Return
1.2%
Cap rate
0.3%
Rent to Value Ratio