33142 Investment Properties for Sale
Browse homes for sale and investment properties in 33142. Refine your search by price, property type, or more.
Best cash flowing properties in 33142

Active
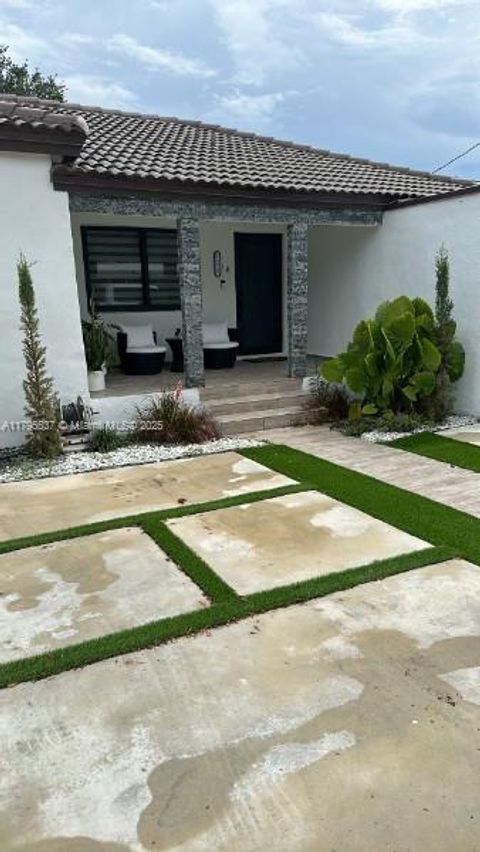
$260,000
2
bds
|
1
ba
|
860
sqft
|
built
1954
1846 NW 49th St, Miami, FL 33142
$53
Cash flow
1.1%
Cash-on-Cash Return
6.4%
Cap rate
1.0%
Rent to Value Ratio

Active
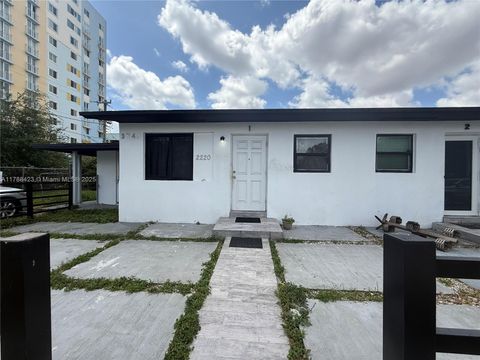
$339,000
1
bds
|
1
ba
|
781
sqft
|
built
1939
2158 NW 32nd St, Miami, FL 33142
$-201
Cash flow
-3.1%
Cash-on-Cash Return
5.4%
Cap rate
0.7%
Rent to Value Ratio
114 out of 121 properties for sale in 33142
Limited Results Shown
Create a free account, or log in to reveal all property listings and enjoy the complete experience.

Pending
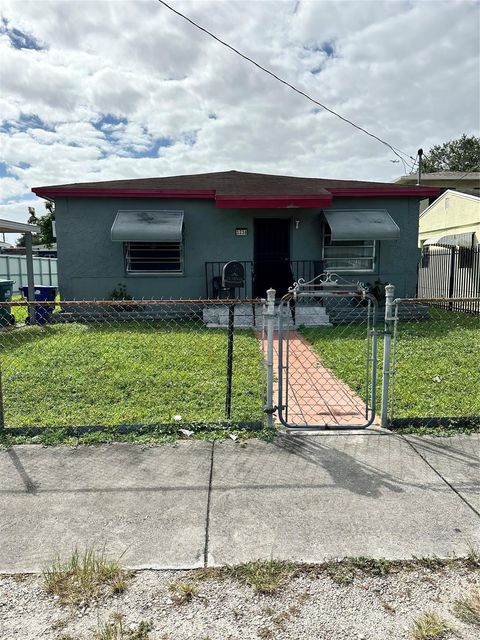
$524,000
4
bds
|
0
ba
|
1,961
sqft
|
built
1957
2535 NW 34th St, Miami, FL 33142
$-1,680
Cash flow
-16.7%
Cash-on-Cash Return
2.3%
Cap rate
0.4%
Rent to Value Ratio
Active
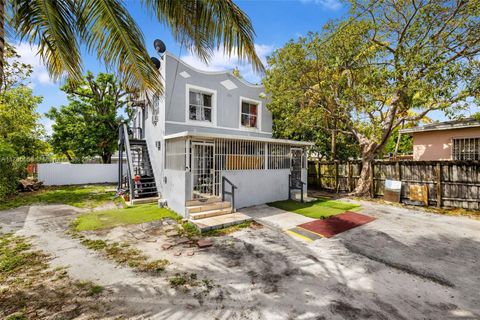
$530,000
4
bds
|
2
ba
|
1,368
sqft
|
built
1939
1218 NW 41st St, Miami, FL 33142
$-1,036
Cash flow
-10.2%
Cash-on-Cash Return
3.8%
Cap rate
0.6%
Rent to Value Ratio

Active
$950,000
8
bds
|
0
ba
|
3,404
sqft
|
built
1964
1243 NW 61st St, Miami, FL 33142
$-4,007
Cash flow
-22.0%
Cash-on-Cash Return
1.1%
Cap rate
0.3%
Rent to Value Ratio

Active
$545,000
5
bds
|
3
ba
|
1,102
sqft
|
built
1960
1384 NW 55th Ter, Miami, FL 33142
$-1,314
Cash flow
-12.6%
Cash-on-Cash Return
3.3%
Cap rate
0.5%
Rent to Value Ratio

Active
$500,000
4
bds
|
2
ba
|
1,046
sqft
|
built
1947
1810 NW 47th St, Miami, FL 33142
$-1,205
Cash flow
-12.6%
Cash-on-Cash Return
3.3%
Cap rate
0.5%
Rent to Value Ratio

Pending
$444,999
3
bds
|
2
ba
|
1,051
sqft
|
built
1938
1945 NW 51st Ter, Miami, FL 33142
$-362
Cash flow
-4.2%
Cash-on-Cash Return
5.2%
Cap rate
0.8%
Rent to Value Ratio

Active
$655,000
2
bds
|
0
ba
|
1,476
sqft
|
built
1944
3058 NW 61st St, Miami, FL 33142
$-2,029
Cash flow
-16.2%
Cash-on-Cash Return
2.4%
Cap rate
0.4%
Rent to Value Ratio
Active
$975,000
4
bds
|
0
ba
|
1,824
sqft
|
built
1964
3745 NW 22nd Ct, Miami, FL 33142
$-3,317
Cash flow
-17.7%
Cash-on-Cash Return
2.1%
Cap rate
0.4%
Rent to Value Ratio
Active
$365,000
2
bds
|
1
ba
|
841
sqft
|
built
1950
3238 NW 50th St, Miami, FL 33142
$-797
Cash flow
-11.4%
Cash-on-Cash Return
3.5%
Cap rate
0.6%
Rent to Value Ratio

Active
$535,000
4
bds
|
2
ba
|
1,440
sqft
|
built
2006
1446 NW 61st St, Miami, FL 33142
$-1,082
Cash flow
-10.6%
Cash-on-Cash Return
3.7%
Cap rate
0.6%
Rent to Value Ratio
Active
$260,000
2
bds
|
1
ba
|
860
sqft
|
built
1954
1846 NW 49th St, Miami, FL 33142
$53
Cash flow
1.1%
Cash-on-Cash Return
6.4%
Cap rate
1.0%
Rent to Value Ratio

Active
$430,000
3
bds
|
2
ba
|
1,224
sqft
|
built
1988
1253 NW 44th St, Miami, FL 33142
$-683
Cash flow
-8.3%
Cash-on-Cash Return
4.2%
Cap rate
0.7%
Rent to Value Ratio

Active
$640,000
4
bds
|
2
ba
|
1,508
sqft
|
built
2019
2326 NW 56th St, Miami, FL 33142
$-862
Cash flow
-7.0%
Cash-on-Cash Return
4.5%
Cap rate
0.6%
Rent to Value Ratio
Active
$950,000
4
bds
|
0
ba
|
1,320
sqft
|
built
1930
1236 NW 28th St, Miami, FL 33142
$-3,853
Cash flow
-21.2%
Cash-on-Cash Return
1.3%
Cap rate
0.3%
Rent to Value Ratio

Active
$439,000
3
bds
|
1
ba
|
792
sqft
|
built
1957
3050 NW 52nd St, Miami, FL 33142
$-488
Cash flow
-5.8%
Cash-on-Cash Return
4.8%
Cap rate
0.7%
Rent to Value Ratio
Active
$479,900
3
bds
|
2
ba
|
1,228
sqft
|
built
1940
1429 NW 38th St, Miami, FL 33142
$-730
Cash flow
-7.9%
Cash-on-Cash Return
4.3%
Cap rate
0.5%
Rent to Value Ratio
Active
$749,000
2
bds
|
0
ba
|
1,566
sqft
|
built
2025
3040 NW 13th Ave, Miami, FL 33142
$-2,868
Cash flow
-20.0%
Cash-on-Cash Return
1.6%
Cap rate
0.3%
Rent to Value Ratio

Active
$470,000
3
bds
|
2
ba
|
946
sqft
|
built
1947
2254 NW 58th St, Miami, FL 33142
$-573
Cash flow
-6.4%
Cash-on-Cash Return
4.7%
Cap rate
0.7%
Rent to Value Ratio
Active
$649,000
4
bds
|
0
ba
|
1,850
sqft
|
built
1970
2917 NW 23rd Ave, Miami, FL 33142
$-2,422
Cash flow
-19.5%
Cash-on-Cash Return
1.7%
Cap rate
0.3%
Rent to Value Ratio
Pending
$649,000
4
bds
|
0
ba
|
1,890
sqft
|
built
1947
2469 NW 35th St, Miami, FL 33142
$-2,559
Cash flow
-20.6%
Cash-on-Cash Return
1.4%
Cap rate
0.3%
Rent to Value Ratio
Active
$485,000
2
bds
|
0
ba
|
1,400
sqft
|
built
1953
1740 NW 41st St, Miami, FL 33142
$-1,628
Cash flow
-17.5%
Cash-on-Cash Return
2.1%
Cap rate
0.4%
Rent to Value Ratio

Active
$565,000
2
bds
|
2
ba
|
1,022
sqft
|
built
1937
1923 NW 48th St, Miami, FL 33142
$-1,512
Cash flow
-14.0%
Cash-on-Cash Return
2.9%
Cap rate
0.4%
Rent to Value Ratio

Active
$639,000
2
bds
|
0
ba
|
1,440
sqft
|
built
1956
1320 NW 44th St, Miami, FL 33142
$-2,261
Cash flow
-18.5%
Cash-on-Cash Return
1.9%
Cap rate
0.3%
Rent to Value Ratio
Active
$465,000
4
bds
|
2
ba
|
1,250
sqft
|
built
1971
2221 NW 59th St, Miami, FL 33142
$-665
Cash flow
-7.5%
Cash-on-Cash Return
4.4%
Cap rate
0.7%
Rent to Value Ratio
Active
$428,000
2
bds
|
1
ba
|
726
sqft
|
built
1948
1819 NW 57th St, Miami, FL 33142
$-770
Cash flow
-9.4%
Cash-on-Cash Return
4.0%
Cap rate
0.6%
Rent to Value Ratio

Pending
$395,999
2
bds
|
1
ba
|
864
sqft
|
built
1941
1239 NW 31st St, Miami, FL 33142
$-482
Cash flow
-6.4%
Cash-on-Cash Return
4.7%
Cap rate
0.7%
Rent to Value Ratio
Active
$730,000
4
bds
|
0
ba
|
2,453
sqft
|
built
1931
2035 NW 26th St, Miami, FL 33142
$-2,382
Cash flow
-17.0%
Cash-on-Cash Return
2.2%
Cap rate
0.3%
Rent to Value Ratio

Pending
$539,900
4
bds
|
2
ba
|
1,452
sqft
|
built
2018
3257 NW 51st St, Miami, FL 33142
$-667
Cash flow
-6.4%
Cash-on-Cash Return
4.7%
Cap rate
0.6%
Rent to Value Ratio

Active
$550,000
2
bds
|
1
ba
|
750
sqft
|
built
1935
2911 NW 30th St, Miami, FL 33142
$-1,172
Cash flow
-11.1%
Cash-on-Cash Return
3.6%
Cap rate
0.5%
Rent to Value Ratio

Active
$2,800,000
5
bds
|
0
ba
|
3,773
sqft
|
built
1973
1441 NW 34th St, Miami, FL 33142
$-13,299
Cash flow
-24.8%
Cash-on-Cash Return
0.4%
Cap rate
0.1%
Rent to Value Ratio

Active
$545,000
4
bds
|
2
ba
|
1,650
sqft
|
built
1926
2162 NW 26th St, Miami, FL 33142
$-1,008
Cash flow
-9.6%
Cash-on-Cash Return
3.9%
Cap rate
0.6%
Rent to Value Ratio

Active
$1,395,000
8
bds
|
0
ba
|
0
sqft
|
built
1986
2154 NW 61st St, Miami, FL 33142
$-7,154
Cash flow
-26.8%
Cash-on-Cash Return
0.0%
Cap rate
0.1%
Rent to Value Ratio

Active
$550,000
3
bds
|
2
ba
|
2,041
sqft
|
built
1940
2931 NW 27th St, Miami, FL 33142
$-1,070
Cash flow
-10.2%
Cash-on-Cash Return
3.8%
Cap rate
0.6%
Rent to Value Ratio
Active
$630,000
3
bds
|
2
ba
|
2,044
sqft
|
built
1925
1236 NW 32nd St, Miami, FL 33142
$-1,279
Cash flow
-10.6%
Cash-on-Cash Return
3.7%
Cap rate
0.5%
Rent to Value Ratio
Active
$439,000
3
bds
|
2
ba
|
1,152
sqft
|
built
1947
1770 NW 51st Ter, Miami, FL 33142
$-943
Cash flow
-11.2%
Cash-on-Cash Return
3.6%
Cap rate
0.6%
Rent to Value Ratio

Active
$575,000
3
bds
|
2
ba
|
1,387
sqft
|
built
1962
1243 NW 42nd St, Miami, FL 33142
$-1,332
Cash flow
-12.1%
Cash-on-Cash Return
3.4%
Cap rate
0.5%
Rent to Value Ratio

Active
$450,000
3
bds
|
2
ba
|
1,165
sqft
|
built
1940
1283 NW 45th St, Miami, FL 33142
$-687
Cash flow
-8.0%
Cash-on-Cash Return
4.3%
Cap rate
0.7%
Rent to Value Ratio

Active
$369,000
2
bds
|
1
ba
|
1,020
sqft
|
built
1939
2156 NW 32nd St, Miami, FL 33142
$-218
Cash flow
-3.1%
Cash-on-Cash Return
5.4%
Cap rate
0.8%
Rent to Value Ratio

Active
$489,000
3
bds
|
2
ba
|
1,107
sqft
|
built
1956
3085 NW 51st St, Miami, FL 33142
$-459
Cash flow
-4.9%
Cash-on-Cash Return
5.0%
Cap rate
0.7%
Rent to Value Ratio
Active
$339,000
1
bds
|
1
ba
|
781
sqft
|
built
1939
2158 NW 32nd St, Miami, FL 33142
$-201
Cash flow
-3.1%
Cash-on-Cash Return
5.4%
Cap rate
0.7%
Rent to Value Ratio