33143 Investment Properties for Sale
Browse homes for sale and investment properties in 33143. Refine your search by price, property type, or more.
Best cash flowing properties in 33143
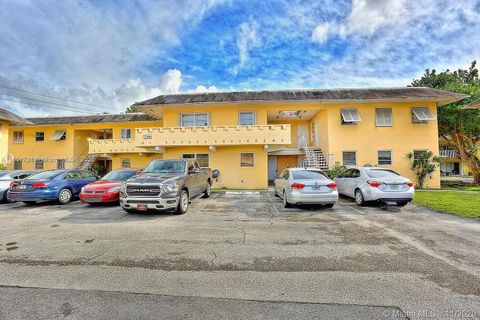
Active
$173,000
1
bds
|
1
ba
|
635
sqft
|
built
1968
7370 SW 82nd St, Miami, FL 33143
$-326
Cash flow
-9.8%
Cash-on-Cash Return
3.9%
Cap rate
1.0%
Rent to Value Ratio

Active
$195,000
1
bds
|
1
ba
|
700
sqft
|
built
1968
7426 SW 82nd St, Miami, FL 33143
$-531
Cash flow
-14.2%
Cash-on-Cash Return
2.9%
Cap rate
0.9%
Rent to Value Ratio
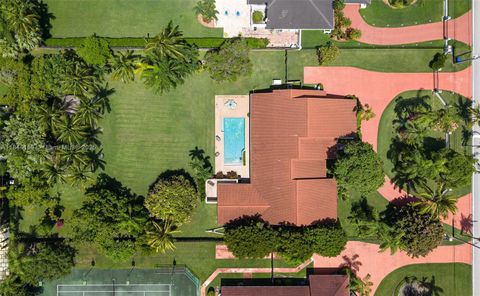
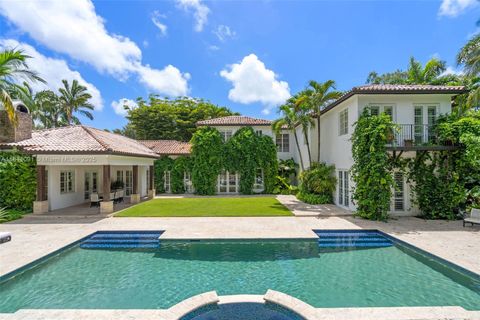
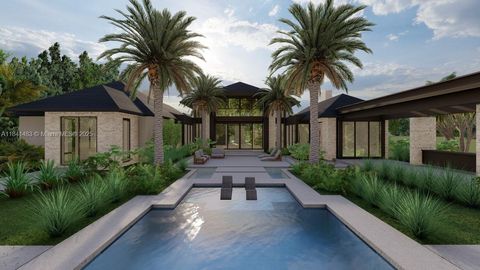
111 out of 128 properties for sale in 33143
Limited Results Shown
Create a free account, or log in to reveal all property listings and enjoy the complete experience.

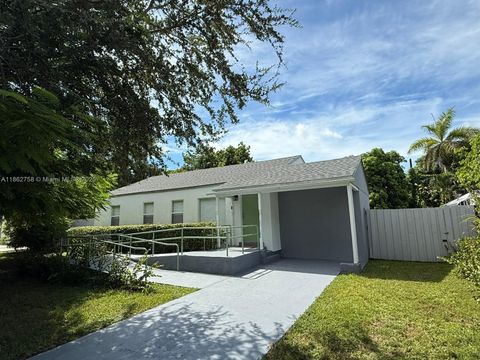
Active
$380,000
1
bds
|
1
ba
|
612
sqft
|
built
1973
5839 SW 74th Ter, South Miami, FL 33143
$-1,473
Cash flow
-20.2%
Cash-on-Cash Return
1.5%
Cap rate
0.5%
Rent to Value Ratio

Active
$995,000
3
bds
|
2
ba
|
1,568
sqft
|
built
1991
7045 SW 83rd Pl, Miami, FL 33143
$-2,629
Cash flow
-13.8%
Cash-on-Cash Return
3.0%
Cap rate
0.4%
Rent to Value Ratio

Active
$3,495,000
4
bds
|
4
ba
|
2,425
sqft
|
built
1980
7255 SW 55th Ave, Miami, FL 33143
$-12,749
Cash flow
-19.0%
Cash-on-Cash Return
1.8%
Cap rate
0.3%
Rent to Value Ratio

Active
$1,195,000
3
bds
|
2
ba
|
1,488
sqft
|
built
1957
6601 SW 64th St, South Miami, FL 33143
$-2,814
Cash flow
-12.3%
Cash-on-Cash Return
3.3%
Cap rate
0.5%
Rent to Value Ratio

Active
$330,000
2
bds
|
2
ba
|
1,044
sqft
|
built
1969
8315 SW 72nd Ave, Miami, FL 33143
$-687
Cash flow
-10.9%
Cash-on-Cash Return
3.6%
Cap rate
0.8%
Rent to Value Ratio
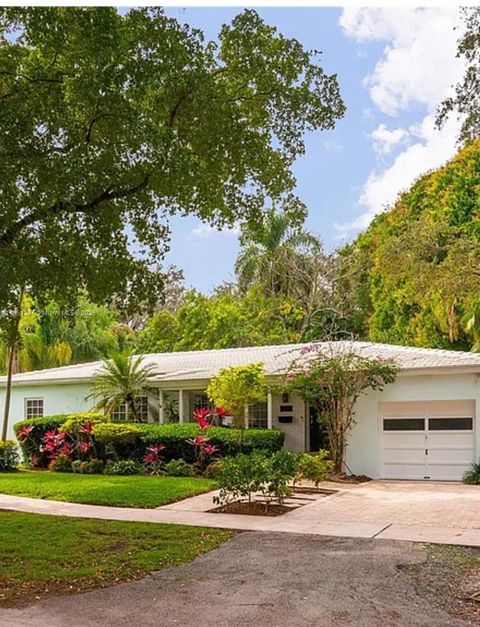
Active
$875,000
3
bds
|
2
ba
|
1,199
sqft
|
built
1948
5822 SW 60th St, Miami, FL 33143
$-2,746
Cash flow
-16.4%
Cash-on-Cash Return
2.4%
Cap rate
0.4%
Rent to Value Ratio

Active
$259,900
1
bds
|
2
ba
|
809
sqft
|
built
1969
7705 SW 86th St, Miami, FL 33143
$-693
Cash flow
-13.9%
Cash-on-Cash Return
2.9%
Cap rate
0.8%
Rent to Value Ratio
Active
$7,850,000
6
bds
|
5
ba
|
6,580
sqft
|
built
2001
5100 SW 86th St, Miami, FL 33143
$-40,396
Cash flow
-26.8%
Cash-on-Cash Return
0.0%
Cap rate
0.1%
Rent to Value Ratio

Active
$275,000
1
bds
|
1
ba
|
510
sqft
|
built
1962
6310 SW 79th St, South Miami, FL 33143
$-625
Cash flow
-11.9%
Cash-on-Cash Return
3.4%
Cap rate
0.7%
Rent to Value Ratio

Active
$2,800,000
5
bds
|
4
ba
|
3,483
sqft
|
built
1996
5750 SW 67th Ave, South Miami, FL 33143
$-8,232
Cash flow
-15.3%
Cash-on-Cash Return
2.6%
Cap rate
0.4%
Rent to Value Ratio

Active
$400,000
2
bds
|
1
ba
|
786
sqft
|
built
1947
7621 SW 55th Ave, Miami, FL 33143
$-857
Cash flow
-11.2%
Cash-on-Cash Return
3.6%
Cap rate
0.7%
Rent to Value Ratio
Active
$6,350,000
5
bds
|
6
ba
|
4,304
sqft
|
built
2025
5835 SW 81st St, South Miami, FL 33143
$-27,436
Cash flow
-22.5%
Cash-on-Cash Return
1.0%
Cap rate
0.1%
Rent to Value Ratio
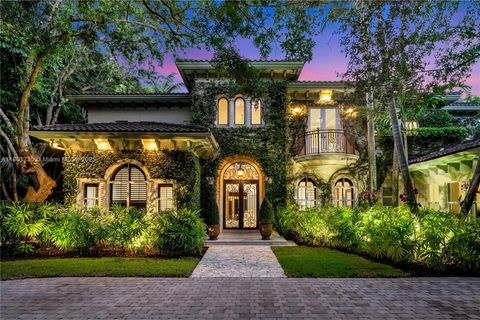
Active
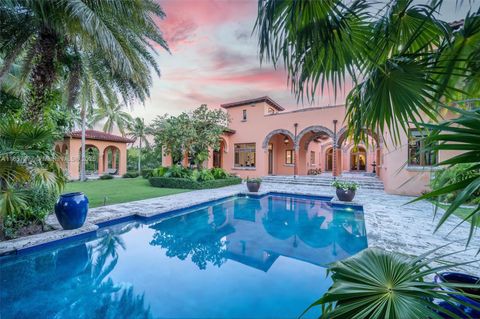
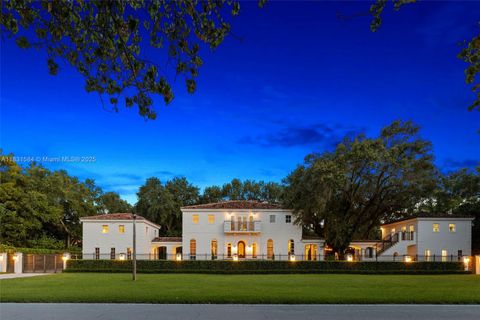
$27,500,000
8
bds
|
10
ba
|
11,847
sqft
|
built
2000
221 Casuarina Concourse, Coral Gables, FL 33143
$-148,616
Cash flow
-28.2%
Cash-on-Cash Return
-0.3%
Cap rate
0.0%
Rent to Value Ratio
Active
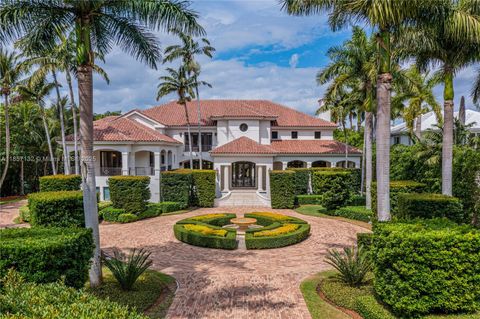
$12,900,000
6
bds
|
7
ba
|
7,057
sqft
|
built
1992
3 Tahiti Beach Island Rd, Coral Gables, FL 33143
$-75,458
Cash flow
-30.5%
Cash-on-Cash Return
-0.9%
Cap rate
0.1%
Rent to Value Ratio
Active
$340,000
1
bds
|
1
ba
|
720
sqft
|
built
2004
6001 SW 70th St, South Miami, FL 33143
$-1,111
Cash flow
-17.0%
Cash-on-Cash Return
2.2%
Cap rate
0.6%
Rent to Value Ratio
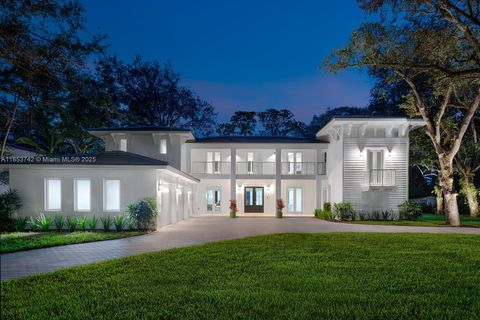
Active
$16,750,000
7
bds
|
8
ba
|
6,702
sqft
|
built
2008
8301 SW 53rd Ave, Miami, FL 33143
$-84,040
Cash flow
-26.2%
Cash-on-Cash Return
0.1%
Cap rate
0.1%
Rent to Value Ratio

Active
$290,000
2
bds
|
2
ba
|
1,075
sqft
|
built
1969
7715 SW 86th St, Miami, FL 33143
$-850
Cash flow
-15.3%
Cash-on-Cash Return
2.6%
Cap rate
0.8%
Rent to Value Ratio
Active
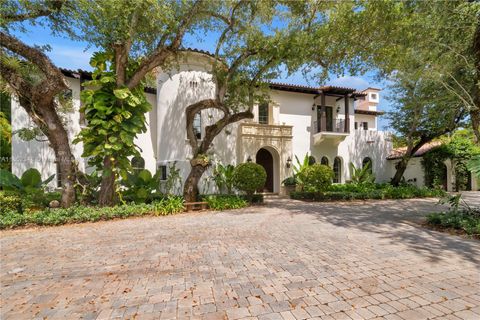
$9,950,000
6
bds
|
7
ba
|
7,354
sqft
|
built
2008
506 Sunset Dr, Coral Gables, FL 33143
$-49,768
Cash flow
-26.1%
Cash-on-Cash Return
0.1%
Cap rate
0.1%
Rent to Value Ratio
Active
$2,700,000
4
bds
|
3
ba
|
1,752
sqft
|
built
1954
7300 Mindello St, Coral Gables, FL 33143
$-8,248
Cash flow
-15.9%
Cash-on-Cash Return
2.5%
Cap rate
0.3%
Rent to Value Ratio

Active
$4,800,000
6
bds
|
7
ba
|
4,646
sqft
|
built
2016
7621 SW 59th Ct, South Miami, FL 33143
$-21,815
Cash flow
-23.7%
Cash-on-Cash Return
0.7%
Cap rate
0.2%
Rent to Value Ratio
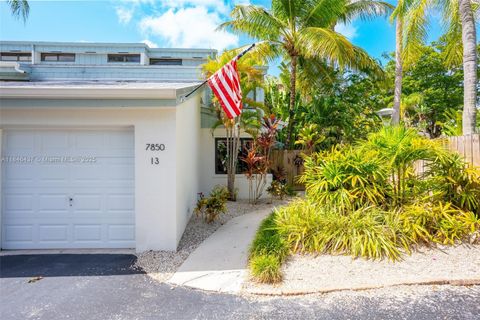
Active
$699,000
2
bds
|
3
ba
|
1,800
sqft
|
built
1981
7850 SW 86th St, Miami, FL 33143
$-2,213
Cash flow
-16.5%
Cash-on-Cash Return
2.3%
Cap rate
0.6%
Rent to Value Ratio

Active
$265,000
2
bds
|
1
ba
|
832
sqft
|
built
1967
7505 SW 82nd St, Miami, FL 33143
$-1,029
Cash flow
-20.3%
Cash-on-Cash Return
1.5%
Cap rate
0.8%
Rent to Value Ratio
Active
$3,999,999
5
bds
|
5
ba
|
3,719
sqft
|
built
2005
5776 SW 77th Ter, South Miami, FL 33143
$-16,158
Cash flow
-21.1%
Cash-on-Cash Return
1.3%
Cap rate
0.2%
Rent to Value Ratio
Active
$3,199,000
5
bds
|
5
ba
|
4,500
sqft
|
built
1988
8375 SW 78th St, Miami, FL 33143
$-12,130
Cash flow
-19.8%
Cash-on-Cash Return
1.6%
Cap rate
0.3%
Rent to Value Ratio

Active
$675,000
2
bds
|
3
ba
|
1,282
sqft
|
built
1973
8225 SW 81st Ct, Miami, FL 33143
$-2,067
Cash flow
-16.0%
Cash-on-Cash Return
2.5%
Cap rate
0.5%
Rent to Value Ratio
Active
$6,390,000
8
bds
|
10
ba
|
7,464
sqft
|
built
2005
7320 SW 79th Ct, Miami, FL 33143
$-30,329
Cash flow
-24.8%
Cash-on-Cash Return
0.5%
Cap rate
0.2%
Rent to Value Ratio
Active
$2,900,000
4
bds
|
3
ba
|
3,685
sqft
|
built
1990
6002 SW 79th Ct, Miami, FL 33143
$-10,502
Cash flow
-18.9%
Cash-on-Cash Return
1.8%
Cap rate
0.3%
Rent to Value Ratio

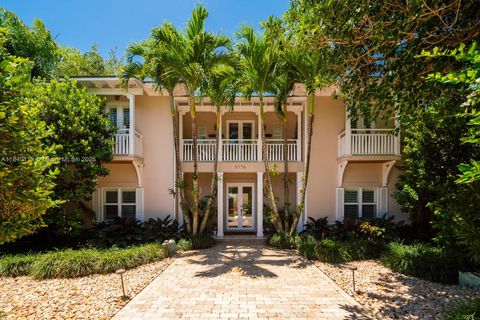
Active
$2,200,000
2
bds
|
1
ba
|
1,108
sqft
|
built
1941
7260 SW 76th St, Miami, FL 33143
$-8,889
Cash flow
-21.1%
Cash-on-Cash Return
1.3%
Cap rate
0.2%
Rent to Value Ratio
Active
$2,050,000
3
bds
|
3
ba
|
3,443
sqft
|
built
1998
6867 SW 62nd Ter, South Miami, FL 33143
$-6,180
Cash flow
-15.7%
Cash-on-Cash Return
2.5%
Cap rate
0.3%
Rent to Value Ratio

Active
$1,750,000
5
bds
|
3
ba
|
3,209
sqft
|
built
1970
8501 SW 72nd Ter, Miami, FL 33143
$-5,208
Cash flow
-15.5%
Cash-on-Cash Return
2.6%
Cap rate
0.4%
Rent to Value Ratio

Active
$429,000
2
bds
|
2
ba
|
1,010
sqft
|
built
2004
6001 SW 70th St, South Miami, FL 33143
$-1,421
Cash flow
-17.3%
Cash-on-Cash Return
2.2%
Cap rate
0.7%
Rent to Value Ratio

Active
$3,199,900
5
bds
|
6
ba
|
3,863
sqft
|
built
2015
7635 SW 84th Ct, Miami, FL 33143
$-13,494
Cash flow
-22.0%
Cash-on-Cash Return
1.1%
Cap rate
0.2%
Rent to Value Ratio

Active
$249,000
1
bds
|
1
ba
|
665
sqft
|
built
1968
7483 SW 82nd St, Miami, FL 33143
$-595
Cash flow
-12.5%
Cash-on-Cash Return
3.3%
Cap rate
0.8%
Rent to Value Ratio

Active
$2,333,000
3
bds
|
5
ba
|
2,678
sqft
|
built
2011
7560 SW 56th Ct, Miami, FL 33143
$-7,719
Cash flow
-17.3%
Cash-on-Cash Return
2.2%
Cap rate
0.4%
Rent to Value Ratio

Active
$2,295,000
3
bds
|
2
ba
|
2,226
sqft
|
built
1955
711 Sunset Rd, Coral Gables, FL 33143
$-6,277
Cash flow
-14.3%
Cash-on-Cash Return
2.9%
Cap rate
0.4%
Rent to Value Ratio

Active
$889,995
3
bds
|
2
ba
|
1,832
sqft
|
built
1975
8445 SW 80th Pl, Miami, FL 33143
$-2,344
Cash flow
-13.7%
Cash-on-Cash Return
3.0%
Cap rate
0.4%
Rent to Value Ratio
Active
$1,450,000
2
bds
|
2
ba
|
1,327
sqft
|
built
1950
6400 SW 81st St, Miami, FL 33143
$-4,692
Cash flow
-16.9%
Cash-on-Cash Return
2.3%
Cap rate
0.3%
Rent to Value Ratio

Active
$2,600,000
3
bds
|
4
ba
|
3,335
sqft
|
built
1939
7345 SW 54th Ct, Miami, FL 33143
$-8,607
Cash flow
-17.3%
Cash-on-Cash Return
2.2%
Cap rate
0.3%
Rent to Value Ratio