33147 Investment Properties for Sale
Browse homes for sale and investment properties in 33147. Refine your search by price, property type, or more.
Best cash flowing properties in 33147
Active
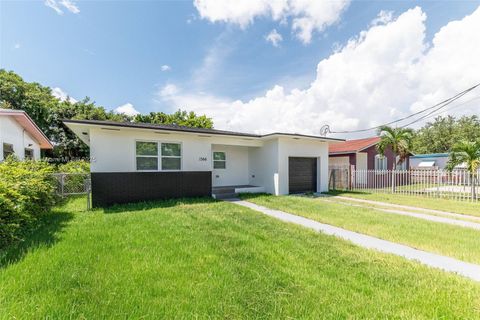
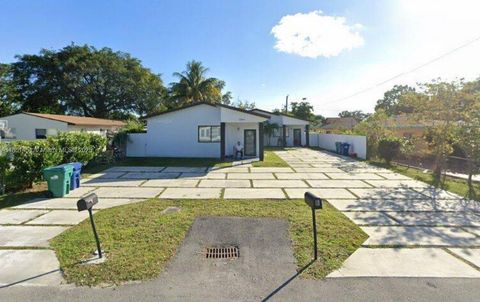
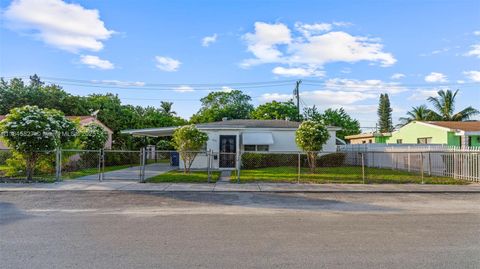
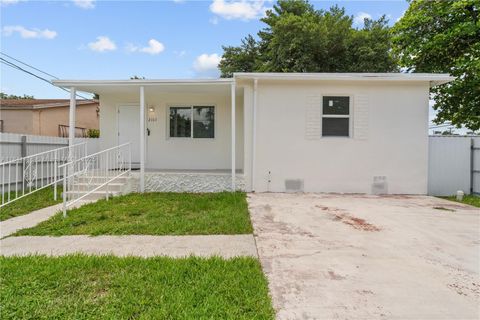
$300,000
2
bds
|
1
ba
|
725
sqft
|
built
1948
2250 NW 86th Ter, Miami, FL 33147
$-174
Cash flow
-3.0%
Cash-on-Cash Return
5.5%
Cap rate
0.8%
Rent to Value Ratio

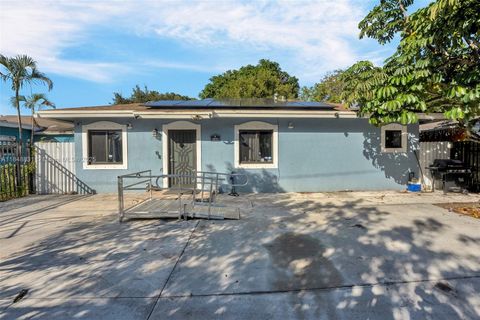
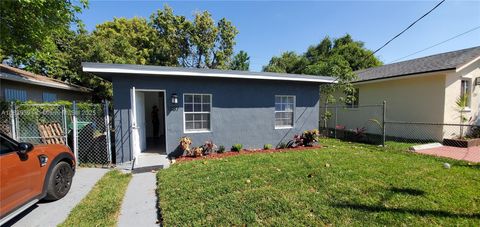
Active
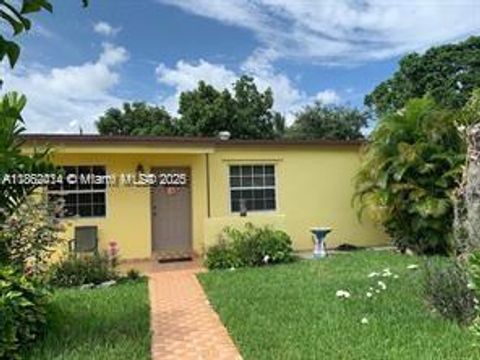
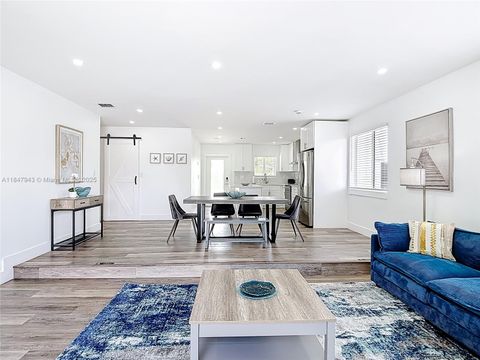
$264,000
2
bds
|
1
ba
|
656
sqft
|
built
1936
2365 NW 79th Ter, Miami, FL 33147
$-241
Cash flow
-4.8%
Cash-on-Cash Return
5.1%
Cap rate
0.8%
Rent to Value Ratio
101 out of 108 properties for sale in 33147
Limited Results Shown
Create a free account, or log in to reveal all property listings and enjoy the complete experience.
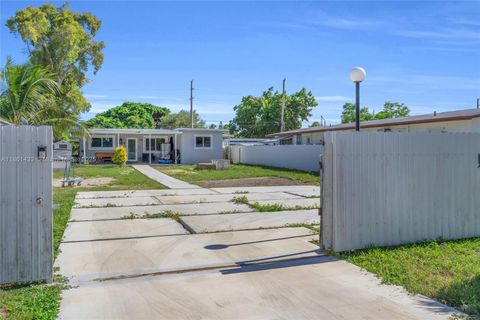
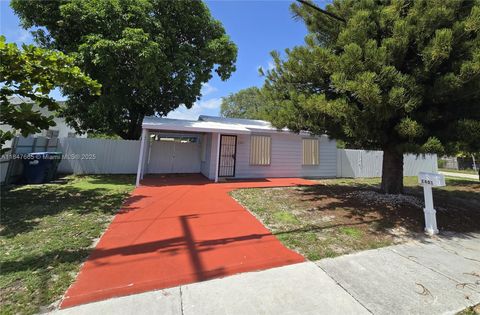
Active
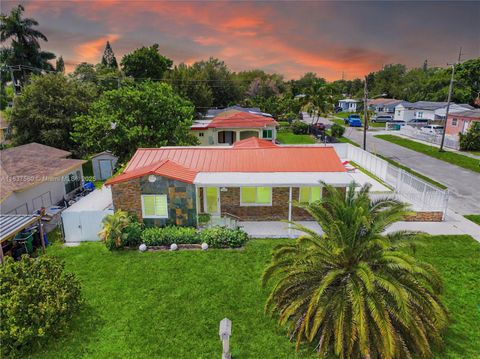
$650,000
3
bds
|
2
ba
|
1,489
sqft
|
built
1956
1220 NW 88th St, Miami, FL 33147
$-1,347
Cash flow
-10.8%
Cash-on-Cash Return
3.7%
Cap rate
0.5%
Rent to Value Ratio
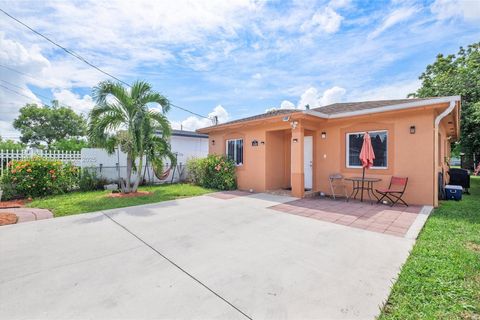
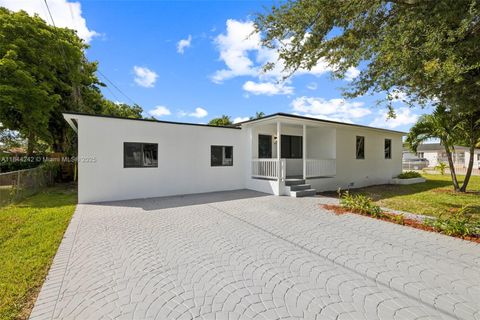
Active
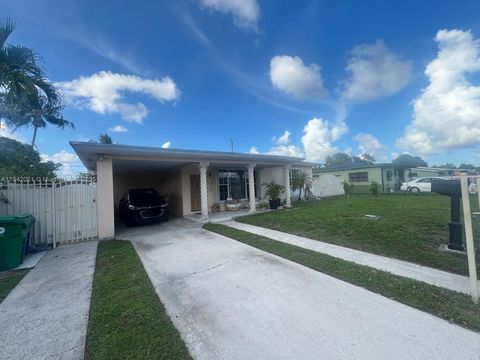
$790,000
4
bds
|
0
ba
|
2,077
sqft
|
built
1965
3121 NW 103rd St, Miami, FL 33147
$-3,049
Cash flow
-20.1%
Cash-on-Cash Return
1.5%
Cap rate
0.4%
Rent to Value Ratio
Active
$450,000
2
bds
|
1
ba
|
882
sqft
|
built
1947
2429 NW 86th St, Miami, FL 33147
$-1,130
Cash flow
-13.1%
Cash-on-Cash Return
3.1%
Cap rate
0.5%
Rent to Value Ratio
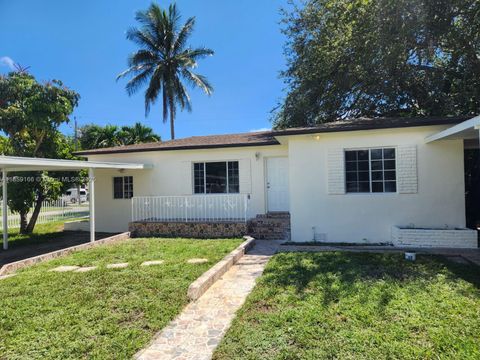
Active
$529,000
3
bds
|
2
ba
|
1,416
sqft
|
built
1964
1366 NW 75th St, Miami, FL 33147
$-1,563
Cash flow
-15.4%
Cash-on-Cash Return
2.6%
Cap rate
0.4%
Rent to Value Ratio
Active
$480,000
3
bds
|
1
ba
|
1,700
sqft
|
built
1953
3515 NW 98th St, Miami, FL 33147
$-728
Cash flow
-7.9%
Cash-on-Cash Return
4.3%
Cap rate
0.6%
Rent to Value Ratio
Active
$455,000
2
bds
|
1
ba
|
720
sqft
|
built
1957
2930 NW 90th St, Miami, FL 33147
$-1,153
Cash flow
-13.2%
Cash-on-Cash Return
3.1%
Cap rate
0.5%
Rent to Value Ratio
Active
$560,000
4
bds
|
2
ba
|
1,476
sqft
|
built
2017
2130 NW 66th St, Miami, FL 33147
$-1,075
Cash flow
-10.0%
Cash-on-Cash Return
3.8%
Cap rate
0.6%
Rent to Value Ratio
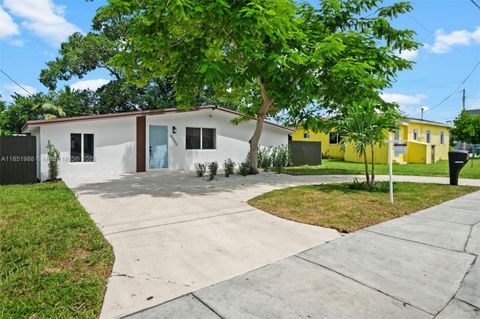
Active
$420,000
3
bds
|
2
ba
|
1,121
sqft
|
built
1947
8741 NW 15th Ave, Miami, FL 33147
$-258
Cash flow
-3.2%
Cash-on-Cash Return
5.4%
Cap rate
0.7%
Rent to Value Ratio
Active
$595,000
4
bds
|
2
ba
|
1,341
sqft
|
built
1961
6965 NW 21st Ct, Miami, FL 33147
$-1,763
Cash flow
-15.5%
Cash-on-Cash Return
2.6%
Cap rate
0.4%
Rent to Value Ratio
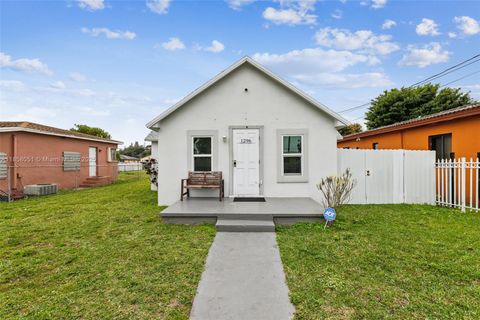
Active
$445,000
2
bds
|
1
ba
|
837
sqft
|
built
1937
1296 NW 72nd St, Miami, FL 33147
$-824
Cash flow
-9.7%
Cash-on-Cash Return
3.9%
Cap rate
0.6%
Rent to Value Ratio

Active
$685,000
bds
|
0
ba
|
2,057
sqft
|
built
1935
3285 NW 92nd St, Miami, FL 33147
$-2,320
Cash flow
-17.7%
Cash-on-Cash Return
2.1%
Cap rate
0.4%
Rent to Value Ratio
Active
$345,000
3
bds
|
1
ba
|
905
sqft
|
built
1959
1785 NW 67th St, Miami, FL 33147
$-288
Cash flow
-4.4%
Cash-on-Cash Return
5.1%
Cap rate
0.7%
Rent to Value Ratio
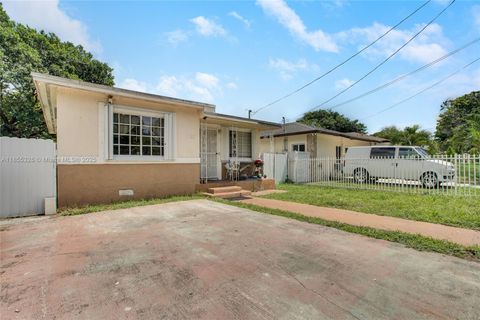
Active
$419,999
2
bds
|
1
ba
|
776
sqft
|
built
1947
2377 NW 84th St, Miami, FL 33147
$-954
Cash flow
-11.9%
Cash-on-Cash Return
3.4%
Cap rate
0.6%
Rent to Value Ratio
Active
$494,000
3
bds
|
2
ba
|
1,430
sqft
|
built
1946
7312 NW 17th Ct, Miami, FL 33147
$-582
Cash flow
-6.1%
Cash-on-Cash Return
4.7%
Cap rate
0.6%
Rent to Value Ratio
Active
$650,000
6
bds
|
3
ba
|
2,410
sqft
|
built
1951
8900 NW 33rd Avenue Rd, Miami, FL 33147
$-697
Cash flow
-5.6%
Cash-on-Cash Return
4.9%
Cap rate
0.8%
Rent to Value Ratio
Active
$369,000
2
bds
|
1
ba
|
702
sqft
|
built
1955
1475 NW 83rd St, Miami, FL 33147
$-595
Cash flow
-8.4%
Cash-on-Cash Return
4.2%
Cap rate
0.6%
Rent to Value Ratio
Active
$590,000
3
bds
|
1
ba
|
892
sqft
|
built
1955
3248 NW 102nd St, Miami, FL 33147
$-1,174
Cash flow
-10.4%
Cash-on-Cash Return
3.8%
Cap rate
0.5%
Rent to Value Ratio
Active
$619,000
4
bds
|
2
ba
|
1,681
sqft
|
built
1947
1488 NW 101st St, Miami, FL 33147
$-1,720
Cash flow
-14.5%
Cash-on-Cash Return
2.8%
Cap rate
0.5%
Rent to Value Ratio
Active
$500,000
3
bds
|
3
ba
|
1,638
sqft
|
built
1937
8024 NW 36th Ct, Miami, FL 33147
$-727
Cash flow
-7.6%
Cash-on-Cash Return
4.4%
Cap rate
0.6%
Rent to Value Ratio
Active
$570,000
5
bds
|
4
ba
|
1,688
sqft
|
built
1953
8355 NW 32nd Ave, Miami, FL 33147
$-979
Cash flow
-9.0%
Cash-on-Cash Return
4.1%
Cap rate
0.5%
Rent to Value Ratio
Active
$850,000
6
bds
|
0
ba
|
2,128
sqft
|
built
2021
3066 NW 92nd St, Miami, FL 33147
$-3,120
Cash flow
-19.2%
Cash-on-Cash Return
1.7%
Cap rate
0.4%
Rent to Value Ratio
Active
$499,900
3
bds
|
2
ba
|
1,200
sqft
|
built
2017
1933 NW 85th St, Miami, FL 33147
$-805
Cash flow
-8.4%
Cash-on-Cash Return
4.2%
Cap rate
0.6%
Rent to Value Ratio
Active
$395,000
2
bds
|
1
ba
|
786
sqft
|
built
1945
2401 NW 91st St, Miami, FL 33147
$-790
Cash flow
-10.4%
Cash-on-Cash Return
3.7%
Cap rate
0.6%
Rent to Value Ratio
Active
$599,000
4
bds
|
2
ba
|
992
sqft
|
built
1954
9055 NW 33rd Avenue Rd, Miami, FL 33147
$-1,529
Cash flow
-13.3%
Cash-on-Cash Return
3.1%
Cap rate
0.5%
Rent to Value Ratio
Active
$469,000
3
bds
|
1
ba
|
1,024
sqft
|
built
1951
1235 NW 86th St, Miami, FL 33147
$-477
Cash flow
-5.3%
Cash-on-Cash Return
4.9%
Cap rate
0.6%
Rent to Value Ratio
Active
$595,000
3
bds
|
2
ba
|
1,684
sqft
|
built
1964
3041 NW 69th Ter, Miami, FL 33147
$-1,041
Cash flow
-9.1%
Cash-on-Cash Return
4.0%
Cap rate
0.7%
Rent to Value Ratio
Active
$599,000
3
bds
|
2
ba
|
1,518
sqft
|
built
1949
1520 NW 93rd St, Miami, FL 33147
$-825
Cash flow
-7.2%
Cash-on-Cash Return
4.5%
Cap rate
0.6%
Rent to Value Ratio
Active
$499,000
3
bds
|
2
ba
|
1,222
sqft
|
built
1959
3435 NW 80th St, Miami, FL 33147
$-776
Cash flow
-8.1%
Cash-on-Cash Return
4.3%
Cap rate
0.6%
Rent to Value Ratio
Active
$459,000
3
bds
|
1
ba
|
994
sqft
|
built
1961
2103 NW 63rd St, Miami, FL 33147
$-977
Cash flow
-11.1%
Cash-on-Cash Return
3.6%
Cap rate
0.5%
Rent to Value Ratio
Active
$340,000
2
bds
|
1
ba
|
625
sqft
|
built
1952
1887 NW 66th St, Miami, FL 33147
$-315
Cash flow
-4.8%
Cash-on-Cash Return
5.0%
Cap rate
0.7%
Rent to Value Ratio

Active
$525,000
3
bds
|
2
ba
|
1,260
sqft
|
built
2013
3109 NW 64th St, Miami, FL 33147
$-448
Cash flow
-4.5%
Cash-on-Cash Return
5.1%
Cap rate
0.7%
Rent to Value Ratio

Active
$549,000
3
bds
|
2
ba
|
1,314
sqft
|
built
1956
2250 NW 95th St, Miami, FL 33147
$-1,539
Cash flow
-14.6%
Cash-on-Cash Return
2.8%
Cap rate
0.5%
Rent to Value Ratio
Active
$799,000
6
bds
|
0
ba
|
2,340
sqft
|
built
2006
1601 NW 62nd Ter, Miami, FL 33147
$-3,008
Cash flow
-19.6%
Cash-on-Cash Return
1.6%
Cap rate
0.3%
Rent to Value Ratio
Active
$535,000
4
bds
|
2
ba
|
1,484
sqft
|
built
1959
7190 NW 21st Ave, Miami, FL 33147
$-1,446
Cash flow
-14.1%
Cash-on-Cash Return
2.9%
Cap rate
0.5%
Rent to Value Ratio
Active
$395,000
3
bds
|
1
ba
|
800
sqft
|
built
1954
1812 NW 64th St, Miami, FL 33147
$-480
Cash flow
-6.3%
Cash-on-Cash Return
4.7%
Cap rate
0.7%
Rent to Value Ratio
Active
$395,000
3
bds
|
1
ba
|
1,022
sqft
|
built
1949
8921 NW 17th Ave, Miami, FL 33147
$-553
Cash flow
-7.3%
Cash-on-Cash Return
4.5%
Cap rate
0.7%
Rent to Value Ratio
Active
$475,000
2
bds
|
1
ba
|
981
sqft
|
built
1949
9728 Little River Dr, Miami, FL 33147
$-967
Cash flow
-10.6%
Cash-on-Cash Return
3.7%
Cap rate
0.6%
Rent to Value Ratio
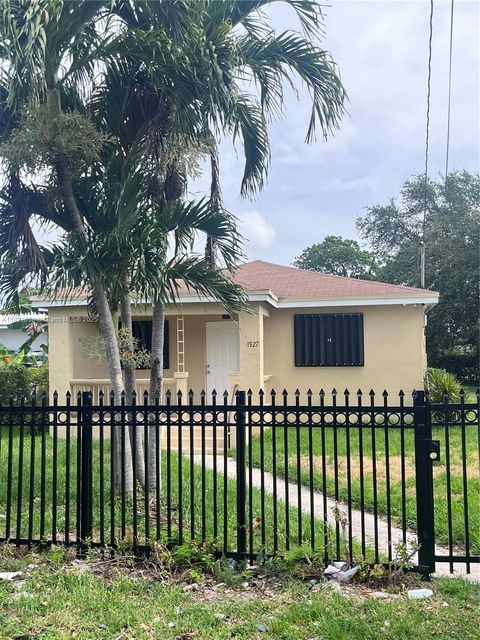
Active
$450,000
2
bds
|
1
ba
|
0
sqft
|
built
1949
1927 NW 64th St, Miami, FL 33147
$-1,039
Cash flow
-12.0%
Cash-on-Cash Return
3.4%
Cap rate
0.6%
Rent to Value Ratio