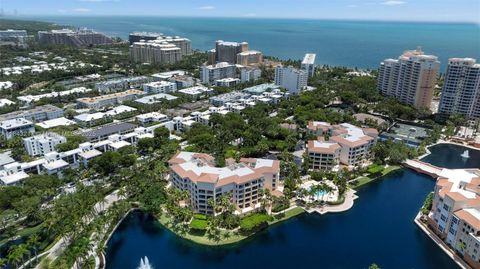
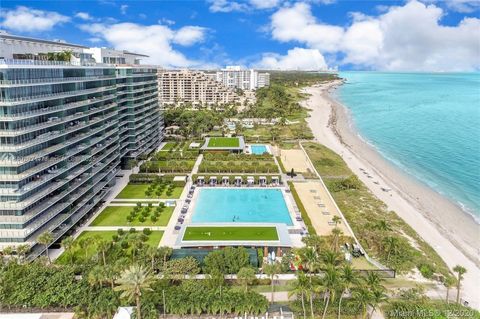
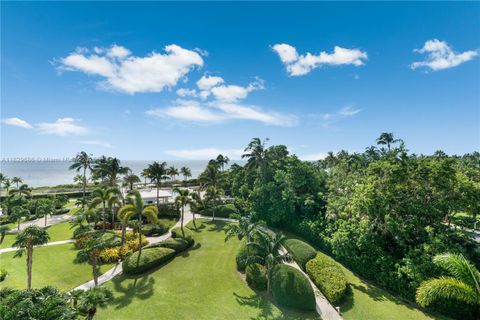
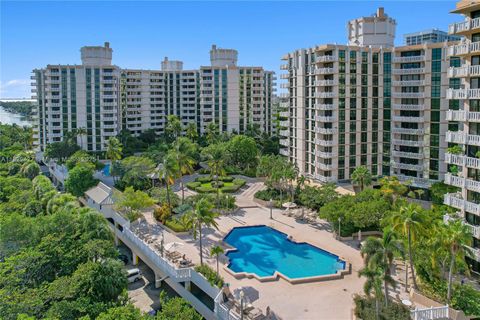
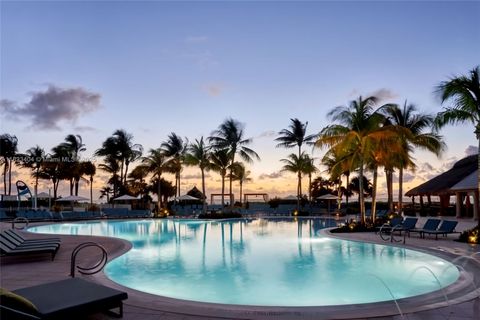
33149 Investment Properties for Sale
Browse homes for sale and investment properties in 33149. Refine your search by price, property type, or more.
Best cash flowing properties in 33149
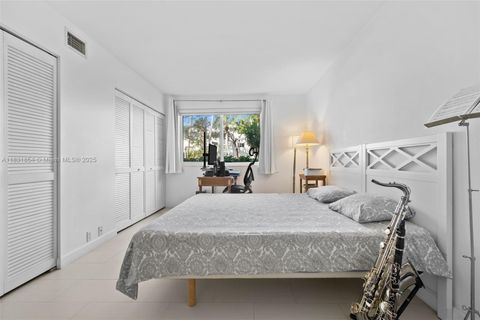
Active
$740,000
3
bds
|
2
ba
|
1,100
sqft
|
built
1967
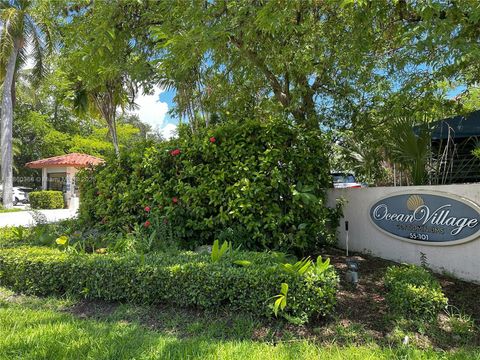
240 Galen Dr, Key Biscayne, FL 33149
$-901
Cash flow
-6.4%
Cash-on-Cash Return
4.7%
Cap rate
0.7%
Rent to Value Ratio

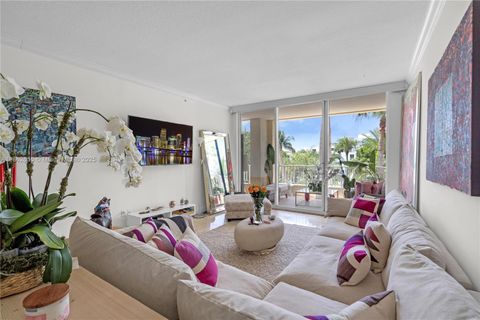
Active
$505,000
1
bds
|
2
ba
|
725
sqft
|
built
1967
240 Galen Dr, Key Biscayne, FL 33149
$-907
Cash flow
-9.4%
Cash-on-Cash Return
4.0%
Cap rate
0.6%
Rent to Value Ratio
110 out of 120 properties for sale in 33149
Limited Results Shown
Create a free account, or log in to reveal all property listings and enjoy the complete experience.
Active
$2,100,000
3
bds
|
3
ba
|
1,830
sqft
|
built
1998
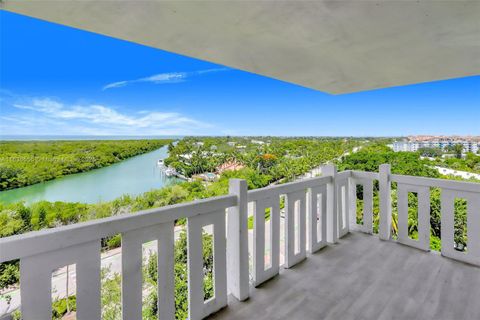
701 Crandon Blvd, Key Biscayne, FL 33149
$-6,316
Cash flow
-15.7%
Cash-on-Cash Return
2.5%
Cap rate
0.4%
Rent to Value Ratio
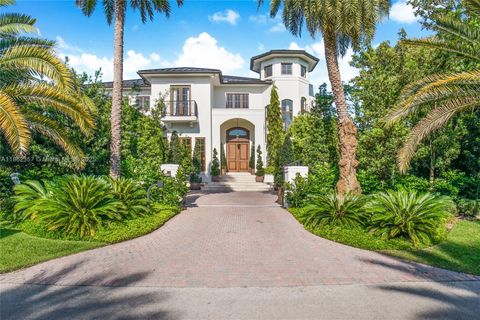
Active
$12,900,000
6
bds
|
7
ba
|
5,960
sqft
|
built
2005
365 Gulf Rd, Key Biscayne, FL 33149
$-65,096
Cash flow
-26.3%
Cash-on-Cash Return
0.1%
Cap rate
0.1%
Rent to Value Ratio

Active
$3,560,000
5
bds
|
4
ba
|
2,429
sqft
|
built
1951
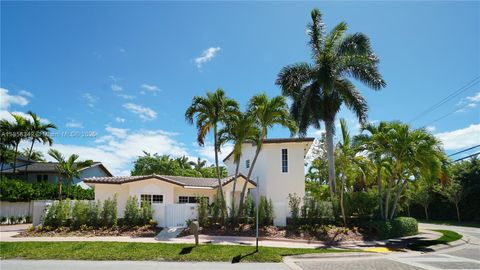
677 Hampton Ln, Key Biscayne, FL 33149
$-13,696
Cash flow
-20.1%
Cash-on-Cash Return
1.5%
Cap rate
0.3%
Rent to Value Ratio
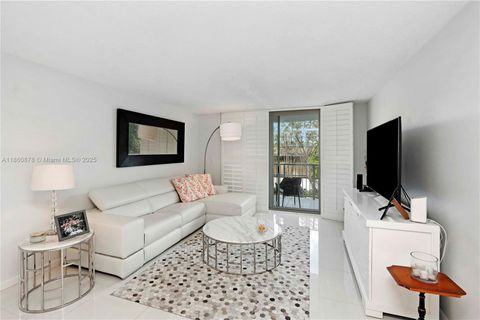
Active
$649,999
1
bds
|
2
ba
|
875
sqft
|
built
1972
210 Sea View Dr, Key Biscayne, FL 33149
$-2,485
Cash flow
-19.9%
Cash-on-Cash Return
1.6%
Cap rate
0.5%
Rent to Value Ratio

Active
$1,699,000
2
bds
|
2
ba
|
1,310
sqft
|
built
1997
715 Crandon Blvd, Key Biscayne, FL 33149
$-5,375
Cash flow
-16.5%
Cash-on-Cash Return
2.4%
Cap rate
0.5%
Rent to Value Ratio
Active
$879,000
2
bds
|
2
ba
|
1,450
sqft
|
built
1982
55 Ocean Lane Dr, Key Biscayne, FL 33149
$-4,350
Cash flow
-25.8%
Cash-on-Cash Return
0.2%
Cap rate
0.5%
Rent to Value Ratio
Active
$1,825,000
2
bds
|
2
ba
|
1,782
sqft
|
built
1971
1121 Crandon Blvd, Key Biscayne, FL 33149
$-8,588
Cash flow
-24.6%
Cash-on-Cash Return
0.5%
Cap rate
0.4%
Rent to Value Ratio

Active
$2,800,000
3
bds
|
3
ba
|
2,523
sqft
|
built
1974
600 Grapetree Dr, Key Biscayne, FL 33149
$-13,099
Cash flow
-24.4%
Cash-on-Cash Return
0.5%
Cap rate
0.3%
Rent to Value Ratio

Active
$4,650,000
6
bds
|
6
ba
|
3,436
sqft
|
built
1998
285 W Enid Dr, Key Biscayne, FL 33149
$-20,990
Cash flow
-23.6%
Cash-on-Cash Return
0.7%
Cap rate
0.2%
Rent to Value Ratio
Active
$3,895,000
4
bds
|
4
ba
|
3,403
sqft
|
built
1951
691 Ridgewood Rd, Key Biscayne, FL 33149
$-13,811
Cash flow
-18.5%
Cash-on-Cash Return
1.9%
Cap rate
0.2%
Rent to Value Ratio
Active
$8,600,000
5
bds
|
5
ba
|
4,166
sqft
|
built
2012
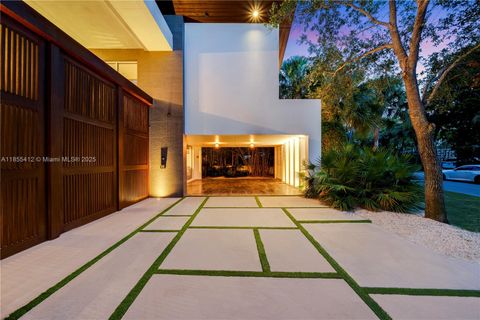
545 Sabal Palm Dr, Key Biscayne, FL 33149
$-41,207
Cash flow
-25.0%
Cash-on-Cash Return
0.4%
Cap rate
0.1%
Rent to Value Ratio
Active
$1,149,000
2
bds
|
2
ba
|
1,790
sqft
|
built
1981
121 Crandon Blvd, Key Biscayne, FL 33149
$-4,495
Cash flow
-20.4%
Cash-on-Cash Return
1.5%
Cap rate
0.6%
Rent to Value Ratio

Active
$1,249,000
2
bds
|
2
ba
|
1,409
sqft
|
built
1971
1121 Crandon Blvd, Key Biscayne, FL 33149
$-4,393
Cash flow
-18.4%
Cash-on-Cash Return
1.9%
Cap rate
0.6%
Rent to Value Ratio

Active
$2,975,000
3
bds
|
2
ba
|
1,403
sqft
|
built
1955
355 Redwood Ln, Key Biscayne, FL 33149
$-12,363
Cash flow
-21.7%
Cash-on-Cash Return
1.2%
Cap rate
0.3%
Rent to Value Ratio
Active
$3,150,000
3
bds
|
3
ba
|
2,402
sqft
|
built
1971
1121 Crandon Blvd, Key Biscayne, FL 33149
$-14,885
Cash flow
-24.7%
Cash-on-Cash Return
0.5%
Cap rate
0.3%
Rent to Value Ratio
Active
$681,993
1
bds
|
2
ba
|
895
sqft
|
built
1973
155 Ocean Lane Dr, Key Biscayne, FL 33149
$-1,870
Cash flow
-14.3%
Cash-on-Cash Return
2.9%
Cap rate
0.7%
Rent to Value Ratio

Active
$595,000
1
bds
|
2
ba
|
744
sqft
|
built
1974
77 Crandon Blvd, Key Biscayne, FL 33149
$-2,141
Cash flow
-18.8%
Cash-on-Cash Return
1.8%
Cap rate
0.6%
Rent to Value Ratio
Active
$1,595,000
2
bds
|
2
ba
|
1,496
sqft
|
built
1969
607 Ocean Dr, Key Biscayne, FL 33149
$-5,143
Cash flow
-16.8%
Cash-on-Cash Return
2.3%
Cap rate
0.4%
Rent to Value Ratio

Active
$515,000
1
bds
|
1
ba
|
530
sqft
|
built
1964
100 Sunrise Dr, Key Biscayne, FL 33149
$-1,620
Cash flow
-16.4%
Cash-on-Cash Return
2.4%
Cap rate
0.5%
Rent to Value Ratio
Active
$1,565,000
2
bds
|
2
ba
|
1,450
sqft
|
built
1998
703 Crandon Blvd, Key Biscayne, FL 33149
$-5,714
Cash flow
-19.0%
Cash-on-Cash Return
1.8%
Cap rate
0.5%
Rent to Value Ratio
Active
$2,999,900
3
bds
|
5
ba
|
3,112
sqft
|
built
2002
765 Crandon Blvd, Key Biscayne, FL 33149
$-12,171
Cash flow
-21.2%
Cash-on-Cash Return
1.3%
Cap rate
0.3%
Rent to Value Ratio
Active
$2,150,000
2
bds
|
3
ba
|
2,060
sqft
|
built
1996
733 Crandon Blvd, Key Biscayne, FL 33149
$-9,139
Cash flow
-22.2%
Cash-on-Cash Return
1.0%
Cap rate
0.3%
Rent to Value Ratio

Active
$2,300,000
2
bds
|
2
ba
|
1,496
sqft
|
built
1969
609 Ocean Dr, Key Biscayne, FL 33149
$-7,839
Cash flow
-17.8%
Cash-on-Cash Return
2.1%
Cap rate
0.3%
Rent to Value Ratio
Active
$5,000,000
2
bds
|
4
ba
|
1,703
sqft
|
built
2014
360 Ocean Dr, Key Biscayne, FL 33149
$-27,279
Cash flow
-28.5%
Cash-on-Cash Return
-0.4%
Cap rate
0.2%
Rent to Value Ratio
Active
$889,000
1
bds
|
2
ba
|
1,059
sqft
|
built
1978
201 Crandon Blvd, Key Biscayne, FL 33149
$-3,740
Cash flow
-21.9%
Cash-on-Cash Return
1.1%
Cap rate
0.5%
Rent to Value Ratio
Active
$2,875,000
3
bds
|
2
ba
|
1,312
sqft
|
built
1951
738 Fernwood Rd, Key Biscayne, FL 33149
$-11,868
Cash flow
-21.5%
Cash-on-Cash Return
1.2%
Cap rate
0.3%
Rent to Value Ratio
Active
$4,700,000
4
bds
|
3
ba
|
2,689
sqft
|
built
1951
475 Woodcrest Rd, Key Biscayne, FL 33149
$-20,111
Cash flow
-22.3%
Cash-on-Cash Return
1.0%
Cap rate
0.2%
Rent to Value Ratio
Active
$1,250,000
3
bds
|
2
ba
|
1,360
sqft
|
built
1991
50 Ocean Lane Dr, Key Biscayne, FL 33149
$-4,304
Cash flow
-18.0%
Cash-on-Cash Return
2.0%
Cap rate
0.5%
Rent to Value Ratio

Active
$3,170,000
2
bds
|
3
ba
|
2,100
sqft
|
built
1998
789 Crandon Blvd, Key Biscayne, FL 33149
$-13,877
Cash flow
-22.8%
Cash-on-Cash Return
0.9%
Cap rate
0.3%
Rent to Value Ratio

Active
$1,310,000
2
bds
|
2
ba
|
1,715
sqft
|
built
1981
161 Crandon Blvd, Key Biscayne, FL 33149
$-5,277
Cash flow
-21.0%
Cash-on-Cash Return
1.3%
Cap rate
0.5%
Rent to Value Ratio
Active
$1,775,000
2
bds
|
2
ba
|
1,496
sqft
|
built
1969
609 Ocean Dr, Key Biscayne, FL 33149
$-7,203
Cash flow
-21.2%
Cash-on-Cash Return
1.3%
Cap rate
0.4%
Rent to Value Ratio
Active
$1,375,000
2
bds
|
2
ba
|
1,782
sqft
|
built
1971
1121 Crandon Blvd, Key Biscayne, FL 33149
$-6,199
Cash flow
-23.5%
Cash-on-Cash Return
0.7%
Cap rate
0.5%
Rent to Value Ratio
Active
$2,300,000
4
bds
|
4
ba
|
1,750
sqft
|
built
2024
200 Sunrise Dr, Key Biscayne, FL 33149
$-6,954
Cash flow
-15.8%
Cash-on-Cash Return
2.5%
Cap rate
0.4%
Rent to Value Ratio
Active
$980,000
bds
|
1
ba
|
376
sqft
|
built
2001
455 Grand Bay Dr, Key Biscayne, FL 33149
$-4,035
Cash flow
-21.5%
Cash-on-Cash Return
1.2%
Cap rate
0.4%
Rent to Value Ratio

Active
$4,850,000
5
bds
|
6
ba
|
4,089
sqft
|
built
2015
220 Cypress Dr, Key Biscayne, FL 33149
$-22,982
Cash flow
-24.7%
Cash-on-Cash Return
0.5%
Cap rate
0.2%
Rent to Value Ratio
Active
$1,195,000
3
bds
|
2
ba
|
1,600
sqft
|
built
1981
141 Crandon Blvd, Key Biscayne, FL 33149
$-4,188
Cash flow
-18.3%
Cash-on-Cash Return
1.9%
Cap rate
0.6%
Rent to Value Ratio
Active
$915,000
2
bds
|
2
ba
|
1,311
sqft
|
built
1975
575 Crandon Blvd, Key Biscayne, FL 33149
$-2,706
Cash flow
-15.4%
Cash-on-Cash Return
2.6%
Cap rate
0.6%
Rent to Value Ratio
Active
$1,420,000
2
bds
|
2
ba
|
1,506
sqft
|
built
1980
151 Crandon Blvd, Key Biscayne, FL 33149
$-5,371
Cash flow
-19.7%
Cash-on-Cash Return
1.6%
Cap rate
0.5%
Rent to Value Ratio