33162 Investment Properties for Sale
Browse homes for sale and investment properties in 33162. Refine your search by price, property type, or more.
Best cash flowing properties in 33162
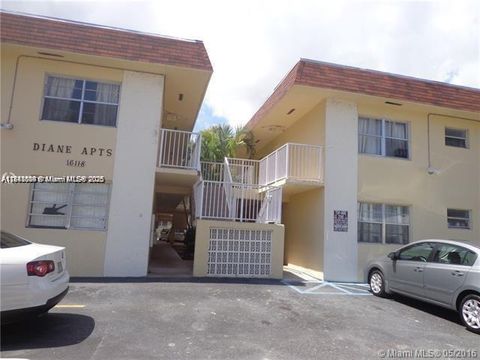
Active
$170,000
2
bds
|
1
ba
|
773
sqft
|
built
1970
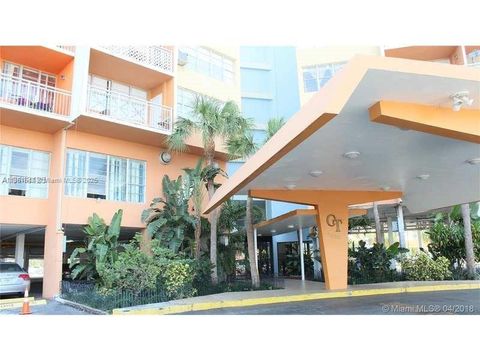
16150 NE 21st Ave, North Miami Beach, FL 33162
$0
Cash flow
n/a
Cash-on-Cash Return
n/a
Cap rate
n/a
Rent to Value Ratio
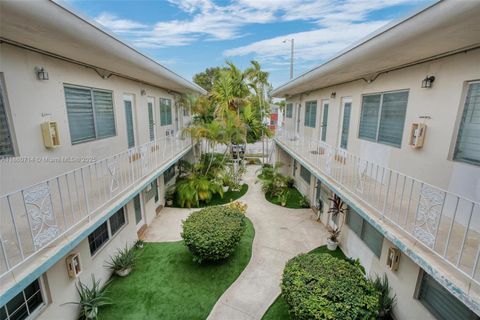
Active
$190,000
2
bds
|
2
ba
|
1,025
sqft
|
built
1963
2072 NE 169th St, North Miami Beach, FL 33162
$-31
Cash flow
-0.9%
Cash-on-Cash Return
5.9%
Cap rate
1.2%
Rent to Value Ratio
116 out of 124 properties for sale in 33162
Limited Results Shown
Create a free account, or log in to reveal all property listings and enjoy the complete experience.
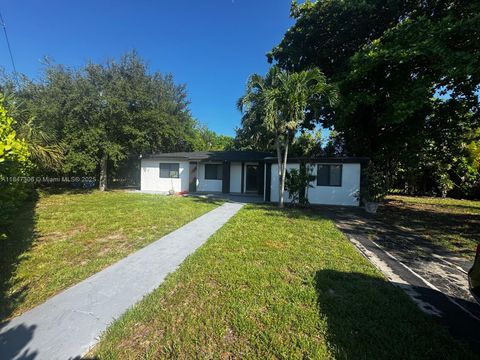
Active
$849,000
4
bds
|
5
ba
|
1,510
sqft
|
built
1953
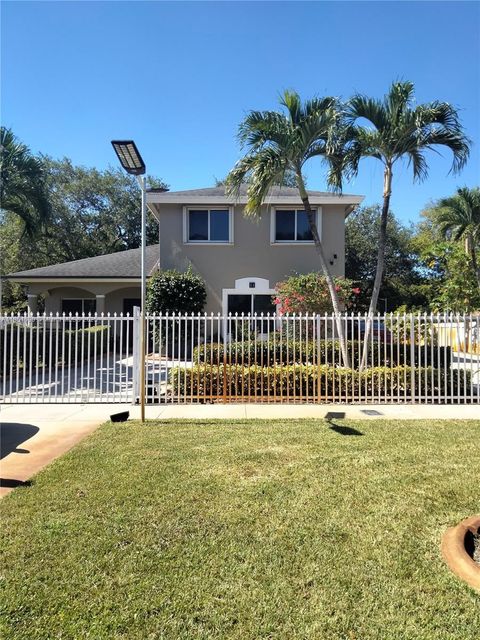
930 NE 163rd St, North Miami Beach, FL 33162
$-2,792
Cash flow
-17.2%
Cash-on-Cash Return
2.2%
Cap rate
0.4%
Rent to Value Ratio
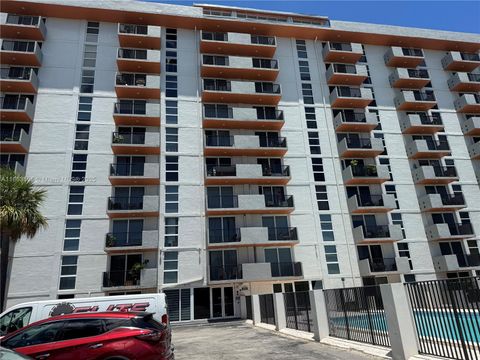
Active
$245,000
2
bds
|
2
ba
|
1,042
sqft
|
built
1971
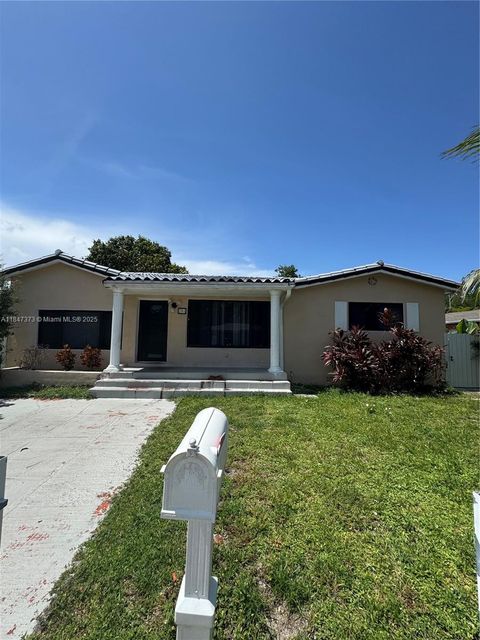
2075 NE 164th St, North Miami Beach, FL 33162
$-594
Cash flow
-12.6%
Cash-on-Cash Return
3.2%
Cap rate
0.9%
Rent to Value Ratio

Active
$512,000
3
bds
|
2
ba
|
1,244
sqft
|
built
1952
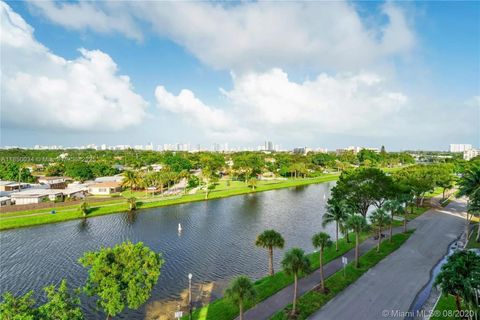
1985 NE 177th St, North Miami Beach, FL 33162
$-943
Cash flow
-9.6%
Cash-on-Cash Return
3.9%
Cap rate
0.6%
Rent to Value Ratio
Active
$190,000
1
bds
|
1
ba
|
700
sqft
|
built
1965
1851 NE 168th St, North Miami Beach, FL 33162
$-384
Cash flow
-10.5%
Cash-on-Cash Return
3.7%
Cap rate
0.8%
Rent to Value Ratio
Active
$1,100,000
5
bds
|
0
ba
|
2,142
sqft
|
built
1958
1958 NE 172nd St, North Miami Beach, FL 33162
$-4,498
Cash flow
-21.3%
Cash-on-Cash Return
1.2%
Cap rate
0.3%
Rent to Value Ratio
Active
$180,000
1
bds
|
1
ba
|
530
sqft
|
built
1965
1851 NE 168th St, North Miami Beach, FL 33162
$-305
Cash flow
-8.8%
Cash-on-Cash Return
4.1%
Cap rate
0.9%
Rent to Value Ratio
Active
$1,275,000
4
bds
|
2
ba
|
2,412
sqft
|
built
1957
1052 NE 179th Ter, North Miami Beach, FL 33162
$-3,863
Cash flow
-15.8%
Cash-on-Cash Return
2.5%
Cap rate
0.4%
Rent to Value Ratio
Active
$795,000
4
bds
|
3
ba
|
1,625
sqft
|
built
1959
1691 NE 177th St, North Miami Beach, FL 33162
$-3,871
Cash flow
-25.4%
Cash-on-Cash Return
0.3%
Cap rate
0.2%
Rent to Value Ratio
Active
$599,999
3
bds
|
1
ba
|
1,301
sqft
|
built
1953
1501 NE 176th St, North Miami Beach, FL 33162
$-1,643
Cash flow
-14.3%
Cash-on-Cash Return
2.9%
Cap rate
0.5%
Rent to Value Ratio
Active
$510,000
4
bds
|
2
ba
|
1,662
sqft
|
built
1953
1100 NE 151st Ter, North Miami Beach, FL 33162
$-817
Cash flow
-8.4%
Cash-on-Cash Return
4.2%
Cap rate
0.7%
Rent to Value Ratio
Active
$570,000
3
bds
|
2
ba
|
1,150
sqft
|
built
1950
1675 NE 160th St, North Miami Beach, FL 33162
$-1,101
Cash flow
-10.1%
Cash-on-Cash Return
3.8%
Cap rate
0.6%
Rent to Value Ratio
Active
$549,999
3
bds
|
0
ba
|
1,682
sqft
|
built
1941
15260 NE 2nd Ave, Miami, FL 33162
$-1,939
Cash flow
-18.4%
Cash-on-Cash Return
1.9%
Cap rate
0.4%
Rent to Value Ratio
Active
$599,000
4
bds
|
3
ba
|
1,476
sqft
|
built
1954
270 NE 162nd St, Miami, FL 33162
$-1,436
Cash flow
-12.5%
Cash-on-Cash Return
3.3%
Cap rate
0.4%
Rent to Value Ratio
Active
$799,000
3
bds
|
2
ba
|
1,586
sqft
|
built
1955
550 NE 173rd St, North Miami Beach, FL 33162
$-2,363
Cash flow
-15.4%
Cash-on-Cash Return
2.6%
Cap rate
0.4%
Rent to Value Ratio
Active
$949,900
2
bds
|
0
ba
|
2,659
sqft
|
built
1934
453 NE 154th St, Miami, FL 33162
$-3,786
Cash flow
-20.8%
Cash-on-Cash Return
1.4%
Cap rate
0.2%
Rent to Value Ratio
Active
$720,000
2
bds
|
1
ba
|
1,532
sqft
|
built
1952
70 NE 152nd St, Miami, FL 33162
$-1,772
Cash flow
-12.8%
Cash-on-Cash Return
3.2%
Cap rate
0.4%
Rent to Value Ratio

Active
$229,000
2
bds
|
2
ba
|
1,166
sqft
|
built
1969
16400 NE 17th Ave, North Miami Beach, FL 33162
$-330
Cash flow
-7.5%
Cash-on-Cash Return
4.4%
Cap rate
0.9%
Rent to Value Ratio
Active
$2,200,000
5
bds
|
4
ba
|
2,774
sqft
|
built
1973
245 NE 156th St, Miami, FL 33162
$-5,645
Cash flow
-13.4%
Cash-on-Cash Return
3.1%
Cap rate
0.4%
Rent to Value Ratio
Active
$2,975,000
5
bds
|
4
ba
|
3,742
sqft
|
built
1958
17131 NE 11th Ct, North Miami Beach, FL 33162
$-11,564
Cash flow
-20.3%
Cash-on-Cash Return
1.5%
Cap rate
0.2%
Rent to Value Ratio
Active
$499,000
3
bds
|
2
ba
|
1,386
sqft
|
built
1957
410 NE 172nd St, North Miami Beach, FL 33162
$-938
Cash flow
-9.8%
Cash-on-Cash Return
3.9%
Cap rate
0.6%
Rent to Value Ratio
Active
$230,000
2
bds
|
2
ba
|
1,112
sqft
|
built
1970
2025 NE 164th St, North Miami Beach, FL 33162
$-328
Cash flow
-7.4%
Cash-on-Cash Return
4.4%
Cap rate
1.0%
Rent to Value Ratio
Active
$1,300,000
5
bds
|
4
ba
|
2,337
sqft
|
built
2005
11 NE 151st St, Miami, FL 33162
$-4,486
Cash flow
-18.0%
Cash-on-Cash Return
2.0%
Cap rate
0.3%
Rent to Value Ratio
Active
$685,000
4
bds
|
3
ba
|
1,848
sqft
|
built
1953
281 NE 169th St, North Miami Beach, FL 33162
$-2,134
Cash flow
-16.3%
Cash-on-Cash Return
2.4%
Cap rate
0.5%
Rent to Value Ratio
Active
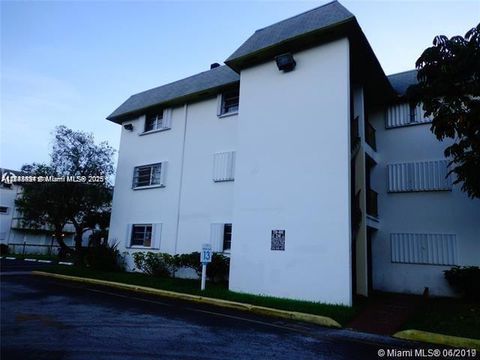
$185,000
1
bds
|
2
ba
|
790
sqft
|
built
1969
16850 S Glades Dr, North Miami Beach, FL 33162
$-472
Cash flow
-13.3%
Cash-on-Cash Return
3.1%
Cap rate
0.9%
Rent to Value Ratio
Active
$1,145,000
4
bds
|
2
ba
|
2,417
sqft
|
built
1963
930 NE 182nd Ter, North Miami Beach, FL 33162
$-2,035
Cash flow
-9.3%
Cash-on-Cash Return
4.0%
Cap rate
0.7%
Rent to Value Ratio
Active
$629,000
4
bds
|
2
ba
|
1,806
sqft
|
built
1968
255 NE 164th St, Miami, FL 33162
$-713
Cash flow
-5.9%
Cash-on-Cash Return
4.8%
Cap rate
0.7%
Rent to Value Ratio
Active
$470,000
3
bds
|
1
ba
|
1,044
sqft
|
built
1946
16128 NE 3rd Ave, North Miami Beach, FL 33162
$-641
Cash flow
-7.1%
Cash-on-Cash Return
4.5%
Cap rate
0.7%
Rent to Value Ratio
Active
$540,000
3
bds
|
2
ba
|
1,822
sqft
|
built
1958
427 NE 160th St, Miami, FL 33162
$-1,142
Cash flow
-11.0%
Cash-on-Cash Return
3.6%
Cap rate
0.6%
Rent to Value Ratio
Active
$549,900
3
bds
|
2
ba
|
1,536
sqft
|
built
1974
17175 NE 21st Ave, North Miami Beach, FL 33162
$-449
Cash flow
-4.3%
Cash-on-Cash Return
5.2%
Cap rate
0.7%
Rent to Value Ratio
Active
$165,000
1
bds
|
2
ba
|
790
sqft
|
built
1970
2025 NE 164th St, North Miami Beach, FL 33162
$-141
Cash flow
-4.5%
Cash-on-Cash Return
5.1%
Cap rate
1.1%
Rent to Value Ratio
Active
$630,000
4
bds
|
2
ba
|
1,523
sqft
|
built
1963
560 NE 161st St, Miami, FL 33162
$-1,152
Cash flow
-9.5%
Cash-on-Cash Return
4.0%
Cap rate
0.6%
Rent to Value Ratio
Active
$139,800
1
bds
|
2
ba
|
790
sqft
|
built
1970
2025 NE 164th St, North Miami Beach, FL 33162
$-149
Cash flow
-5.6%
Cash-on-Cash Return
4.9%
Cap rate
1.1%
Rent to Value Ratio
Active
$147,000
1
bds
|
1
ba
|
653
sqft
|
built
1961
1471 NE 170th St, North Miami Beach, FL 33162
$-361
Cash flow
-12.8%
Cash-on-Cash Return
3.2%
Cap rate
1.0%
Rent to Value Ratio
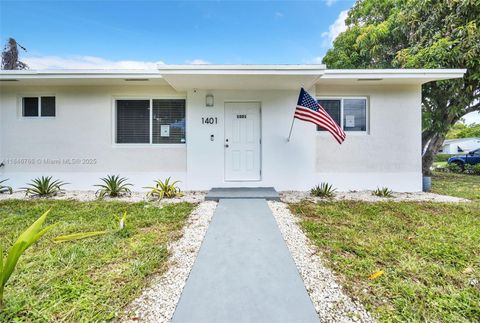
Active
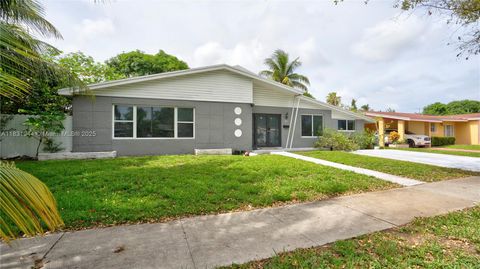
$579,900
4
bds
|
2
ba
|
1,300
sqft
|
built
1972
1401 NE 152nd St, North Miami Beach, FL 33162
$-1,337
Cash flow
-12.0%
Cash-on-Cash Return
3.4%
Cap rate
0.5%
Rent to Value Ratio
Active
$725,000
4
bds
|
3
ba
|
1,637
sqft
|
built
1952
781 NE 162nd St, Miami, FL 33162
$-1,267
Cash flow
-9.1%
Cash-on-Cash Return
4.1%
Cap rate
0.6%
Rent to Value Ratio
Active
$160,000
1
bds
|
2
ba
|
930
sqft
|
built
1975
16750 NE 10th Ave, North Miami Beach, FL 33162
$-416
Cash flow
-13.6%
Cash-on-Cash Return
3.0%
Cap rate
1.1%
Rent to Value Ratio
Active
$174,000
2
bds
|
2
ba
|
920
sqft
|
built
1967
15225 NE 6th Ave, Miami, FL 33162
$-167
Cash flow
-5.0%
Cash-on-Cash Return
5.0%
Cap rate
1.1%
Rent to Value Ratio
Active
$899,000
4
bds
|
3
ba
|
2,937
sqft
|
built
1957
225 NE 175th St, North Miami Beach, FL 33162
$-2,315
Cash flow
-13.4%
Cash-on-Cash Return
3.1%
Cap rate
0.4%
Rent to Value Ratio