33165 Investment Properties for Sale
Browse homes for sale and investment properties in 33165. Refine your search by price, property type, or more.
Best cash flowing properties in 33165
Active
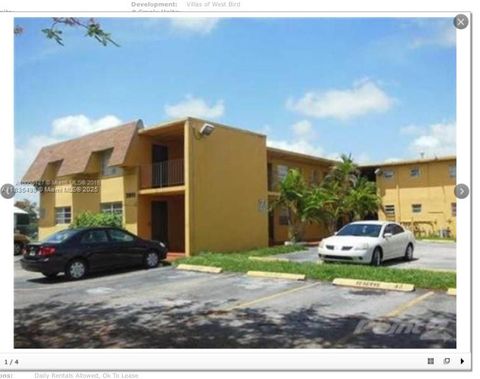
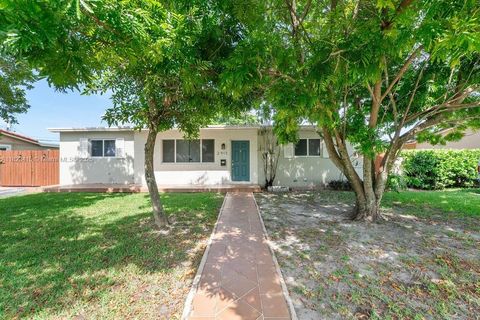
$189,000
1
bds
|
1
ba
|
558
sqft
|
built
1969
3901 SW 112th Ave, Miami, FL 33165
$-395
Cash flow
-10.9%
Cash-on-Cash Return
3.6%
Cap rate
1.0%
Rent to Value Ratio
Active
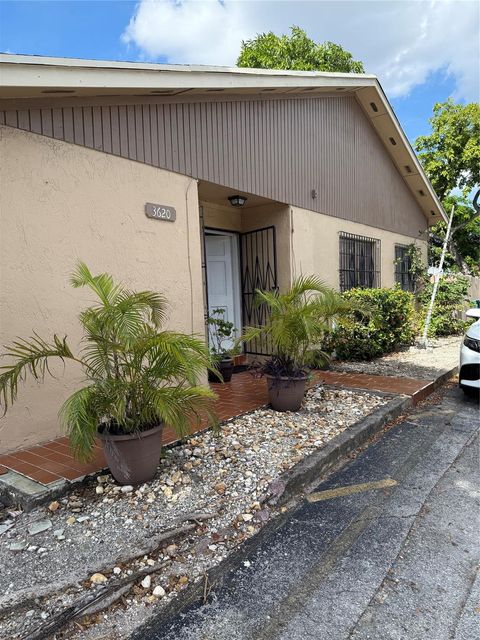
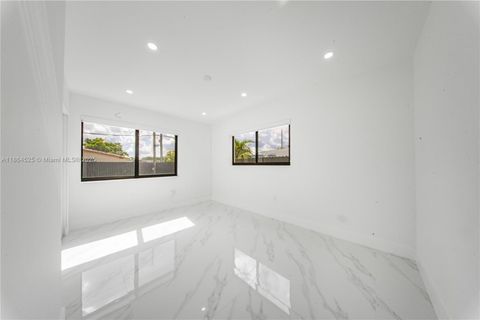
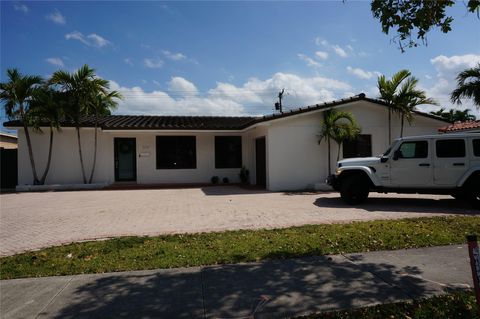
$350,000
3
bds
|
2
ba
|
1,120
sqft
|
built
1981
3620 SW 112th Ave, Miami, FL 33165
$-655
Cash flow
-9.8%
Cash-on-Cash Return
3.9%
Cap rate
0.7%
Rent to Value Ratio
70 out of 74 properties for sale in 33165
Limited Results Shown
Create a free account, or log in to reveal all property listings and enjoy the complete experience.
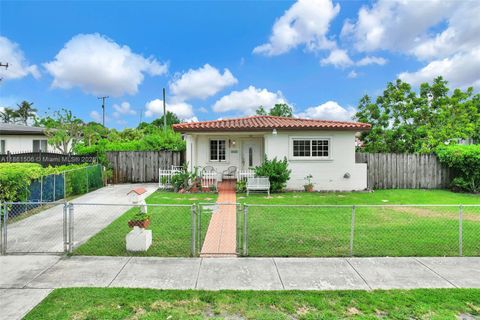
Active
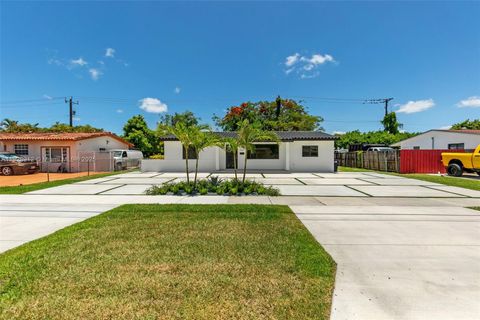
$899,000
3
bds
|
2
ba
|
1,767
sqft
|
built
1959
3021 SW 97th Ave, Miami, FL 33165
$-1,560
Cash flow
-9.1%
Cash-on-Cash Return
4.1%
Cap rate
0.6%
Rent to Value Ratio
Active
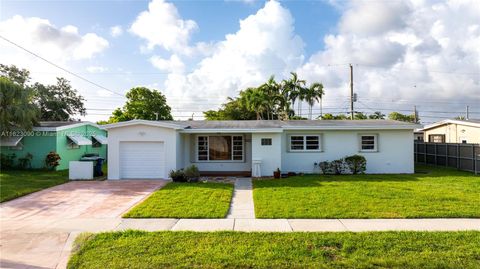
$665,000
3
bds
|
1
ba
|
1,057
sqft
|
built
1954
3635 SW 95th Ave, Miami, FL 33165
$-1,425
Cash flow
-11.2%
Cash-on-Cash Return
3.6%
Cap rate
0.5%
Rent to Value Ratio

Active
$775,000
3
bds
|
2
ba
|
1,905
sqft
|
built
1989
2671 SW 99th Ct, Miami, FL 33165
$-1,653
Cash flow
-11.1%
Cash-on-Cash Return
3.6%
Cap rate
0.5%
Rent to Value Ratio
Active
$925,000
4
bds
|
2
ba
|
2,554
sqft
|
built
1977
10450 SW 19th St, Miami, FL 33165
$-2,101
Cash flow
-11.9%
Cash-on-Cash Return
3.4%
Cap rate
0.5%
Rent to Value Ratio
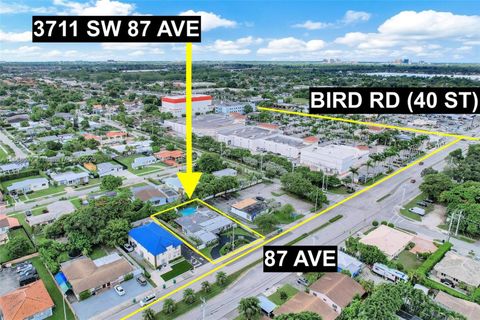
Active
$1,600,000
4
bds
|
3
ba
|
2,928
sqft
|
built
1954
3711 SW 87th Ave, Miami, FL 33165
$-4,986
Cash flow
-16.3%
Cash-on-Cash Return
2.4%
Cap rate
0.3%
Rent to Value Ratio
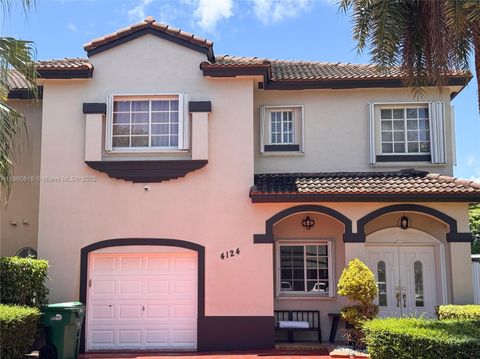
Active
$750,000
3
bds
|
3
ba
|
1,848
sqft
|
built
2003
4124 SW 91st Ct, Miami, FL 33165
$-1,807
Cash flow
-12.6%
Cash-on-Cash Return
3.3%
Cap rate
0.5%
Rent to Value Ratio
Active
$949,900
4
bds
|
4
ba
|
2,755
sqft
|
built
1976
9940 SW 23rd St, Miami, FL 33165
$-2,449
Cash flow
-13.5%
Cash-on-Cash Return
3.1%
Cap rate
0.4%
Rent to Value Ratio
Active
$825,000
4
bds
|
3
ba
|
3,123
sqft
|
built
1959
10255 SW 46th St, Miami, FL 33165
$-1,536
Cash flow
-9.7%
Cash-on-Cash Return
3.9%
Cap rate
0.5%
Rent to Value Ratio
Active
$675,000
4
bds
|
2
ba
|
1,773
sqft
|
built
1954
4151 SW 110th Ct, Miami, FL 33165
$-1,282
Cash flow
-9.9%
Cash-on-Cash Return
3.9%
Cap rate
0.5%
Rent to Value Ratio
Active
$735,000
3
bds
|
3
ba
|
1,440
sqft
|
built
1959
10450 SW 43rd St, Miami, FL 33165
$-1,946
Cash flow
-13.8%
Cash-on-Cash Return
3.0%
Cap rate
0.5%
Rent to Value Ratio
Active
$880,000
5
bds
|
5
ba
|
2,562
sqft
|
built
2006
10197 SW 26th Ter, Miami, FL 33165
$-1,941
Cash flow
-11.5%
Cash-on-Cash Return
3.5%
Cap rate
0.5%
Rent to Value Ratio
Active
$1,299,999
5
bds
|
4
ba
|
3,086
sqft
|
built
1990
2700 SW 113th Ave, Miami, FL 33165
$-3,396
Cash flow
-13.6%
Cash-on-Cash Return
3.0%
Cap rate
0.4%
Rent to Value Ratio
Active
$1,599,000
3
bds
|
3
ba
|
2,427
sqft
|
built
2018
2521 SW 105th Ave, Miami, FL 33165
$-2,430
Cash flow
-7.9%
Cash-on-Cash Return
4.3%
Cap rate
0.6%
Rent to Value Ratio
Active
$731,000
4
bds
|
3
ba
|
2,488
sqft
|
built
1980
3416 SW 116th Pl, Miami, FL 33165
$-1,714
Cash flow
-12.2%
Cash-on-Cash Return
3.3%
Cap rate
0.5%
Rent to Value Ratio
Active
$675,000
4
bds
|
3
ba
|
1,456
sqft
|
built
1958
3500 SW 87th Pl, Miami, FL 33165
$-1,660
Cash flow
-12.8%
Cash-on-Cash Return
3.2%
Cap rate
0.5%
Rent to Value Ratio
Active
$849,000
4
bds
|
0
ba
|
2,106
sqft
|
built
1963
9311 SW 37th St, Miami, FL 33165
$-3,176
Cash flow
-19.5%
Cash-on-Cash Return
1.7%
Cap rate
0.3%
Rent to Value Ratio
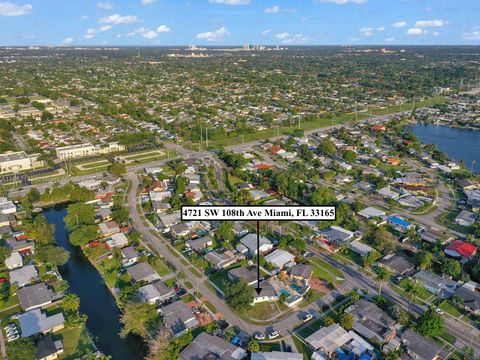
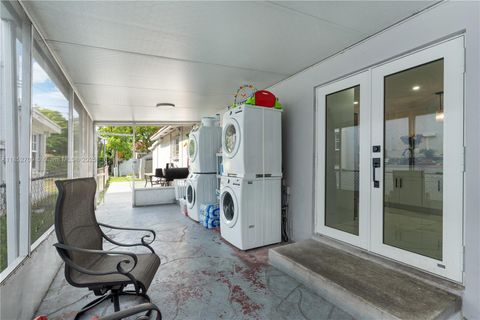
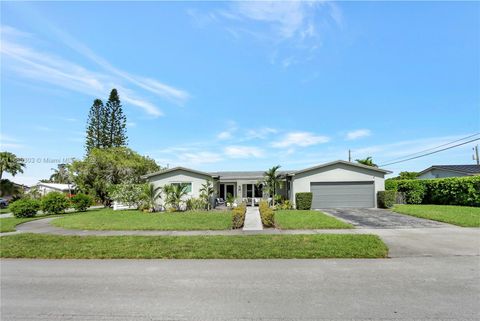
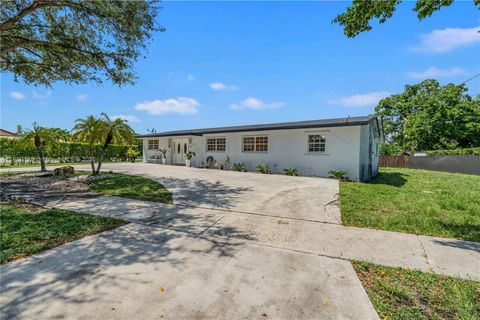
Active
$725,000
3
bds
|
2
ba
|
1,250
sqft
|
built
1957
4721 SW 108th Ave, Miami, FL 33165
$-1,250
Cash flow
-9.0%
Cash-on-Cash Return
4.1%
Cap rate
0.6%
Rent to Value Ratio
Active
$899,000
3
bds
|
2
ba
|
2,043
sqft
|
built
1965
1824 SW 100th Ave, Miami, FL 33165
$-1,291
Cash flow
-7.5%
Cash-on-Cash Return
4.4%
Cap rate
0.6%
Rent to Value Ratio
Active
$1,070,000
4
bds
|
4
ba
|
2,120
sqft
|
built
1959
10351 SW 49th St, Miami, FL 33165
$-3,691
Cash flow
-18.0%
Cash-on-Cash Return
2.0%
Cap rate
0.4%
Rent to Value Ratio
Active
$1,050,000
4
bds
|
2
ba
|
2,494
sqft
|
built
1976
4311 SW 95th Ct, Miami, FL 33165
$-2,881
Cash flow
-14.3%
Cash-on-Cash Return
2.9%
Cap rate
0.5%
Rent to Value Ratio
Active
$699,000
3
bds
|
2
ba
|
1,713
sqft
|
built
1956
3101 SW 103rd Ct, Miami, FL 33165
$-1,887
Cash flow
-14.1%
Cash-on-Cash Return
2.9%
Cap rate
0.5%
Rent to Value Ratio
Active
$749,000
3
bds
|
2
ba
|
1,897
sqft
|
built
1977
3005 SW 108th Ct, Miami, FL 33165
$-1,429
Cash flow
-10.0%
Cash-on-Cash Return
3.9%
Cap rate
0.5%
Rent to Value Ratio
Active
$830,000
5
bds
|
3
ba
|
1,854
sqft
|
built
1956
4040 SW 108th Ave, Miami, FL 33165
$-2,211
Cash flow
-13.9%
Cash-on-Cash Return
3.0%
Cap rate
0.4%
Rent to Value Ratio
Active
$949,000
4
bds
|
3
ba
|
3,022
sqft
|
built
1972
9433 SW 17th St, Miami, FL 33165
$-2,160
Cash flow
-11.9%
Cash-on-Cash Return
3.4%
Cap rate
0.5%
Rent to Value Ratio
Active
$1,250,000
4
bds
|
3
ba
|
3,044
sqft
|
built
2006
9751 SW 35th St, Miami, FL 33165
$-3,649
Cash flow
-15.2%
Cash-on-Cash Return
2.6%
Cap rate
0.4%
Rent to Value Ratio
Active
$1,100,000
5
bds
|
5
ba
|
3,692
sqft
|
built
1976
2705 SW 108th Ct, Miami, FL 33165
$-2,918
Cash flow
-13.8%
Cash-on-Cash Return
3.0%
Cap rate
0.4%
Rent to Value Ratio
Active
$799,000
5
bds
|
4
ba
|
1,891
sqft
|
built
1957
11020 SW 55th St, Miami, FL 33165
$-2,365
Cash flow
-15.4%
Cash-on-Cash Return
2.6%
Cap rate
0.4%
Rent to Value Ratio
Active
$775,000
4
bds
|
3
ba
|
1,917
sqft
|
built
1959
3331 SW 88th Ct, Miami, FL 33165
$-2,205
Cash flow
-14.8%
Cash-on-Cash Return
2.7%
Cap rate
0.5%
Rent to Value Ratio
Active
$899,000
4
bds
|
2
ba
|
1,508
sqft
|
built
1961
9865 SW 16th St, Miami, FL 33165
$-2,297
Cash flow
-13.3%
Cash-on-Cash Return
3.1%
Cap rate
0.5%
Rent to Value Ratio
Active
$739,000
3
bds
|
3
ba
|
1,651
sqft
|
built
1959
3310 SW 106th Ave, Miami, FL 33165
$-1,445
Cash flow
-10.2%
Cash-on-Cash Return
3.8%
Cap rate
0.5%
Rent to Value Ratio
Active
$630,000
3
bds
|
2
ba
|
1,634
sqft
|
built
1992
10360 SW 22nd St, Miami, FL 33165
$-1,025
Cash flow
-8.5%
Cash-on-Cash Return
4.2%
Cap rate
0.6%
Rent to Value Ratio
Active
$1,499,900
6
bds
|
4
ba
|
3,688
sqft
|
built
1975
5550 SW 87th Ave, Miami, FL 33165
$-3,939
Cash flow
-13.7%
Cash-on-Cash Return
3.0%
Cap rate
0.5%
Rent to Value Ratio
Active
$664,900
3
bds
|
2
ba
|
1,269
sqft
|
built
1965
2915 SW 92nd Pl, Miami, FL 33165
$-1,880
Cash flow
-14.8%
Cash-on-Cash Return
2.8%
Cap rate
0.5%
Rent to Value Ratio
Active
$900,001
4
bds
|
3
ba
|
1,776
sqft
|
built
1962
9220 SW 56th St, Miami, FL 33165
$-898
Cash flow
-5.2%
Cash-on-Cash Return
4.9%
Cap rate
0.7%
Rent to Value Ratio
Active
$779,999
3
bds
|
2
ba
|
1,886
sqft
|
built
1960
9360 SW 16th St, Miami, FL 33165
$-1,726
Cash flow
-11.5%
Cash-on-Cash Return
3.5%
Cap rate
0.4%
Rent to Value Ratio
Active
$734,999
3
bds
|
2
ba
|
1,384
sqft
|
built
1958
9351 SW 53rd St, Miami, FL 33165
$-1,646
Cash flow
-11.7%
Cash-on-Cash Return
3.5%
Cap rate
0.5%
Rent to Value Ratio
Active
$699,000
3
bds
|
3
ba
|
0
sqft
|
built
1956
11030 SW 42nd St, Miami, FL 33165
$-1,768
Cash flow
-13.2%
Cash-on-Cash Return
3.1%
Cap rate
0.4%
Rent to Value Ratio

Active
$817,000
3
bds
|
2
ba
|
2,201
sqft
|
built
1958
5025 SW 90th Ct, Miami, FL 33165
$-2,367
Cash flow
-15.1%
Cash-on-Cash Return
2.7%
Cap rate
0.5%
Rent to Value Ratio